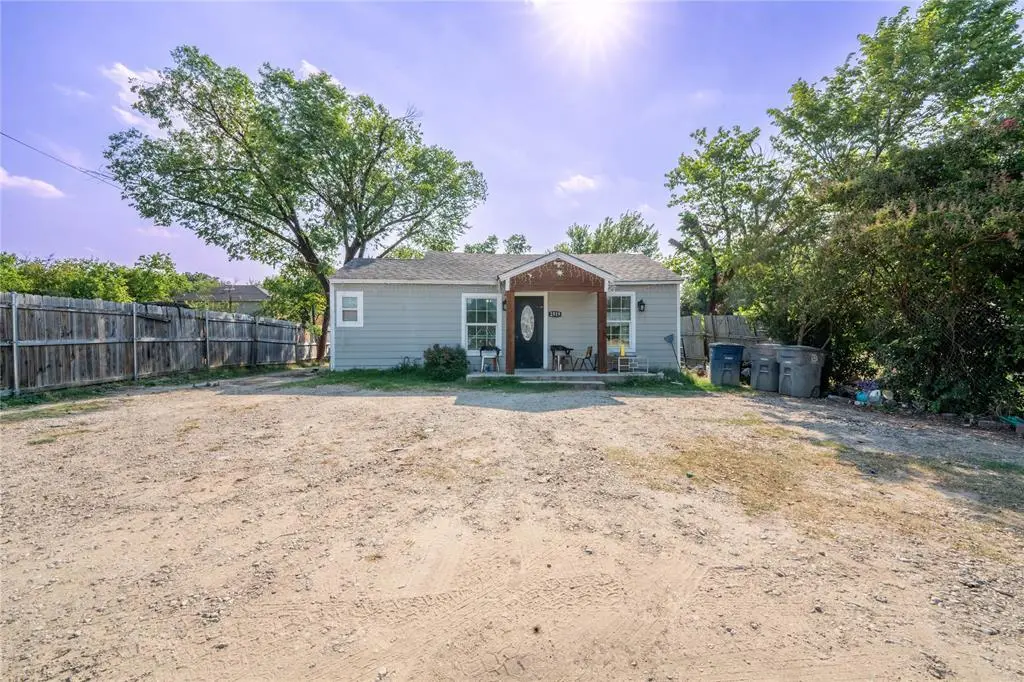
2519 Chalk Hill Rd · Dallas, TX
Flood risk 1/10 · Minimal
- FEMA flood zone
- X (unshaded)
- Chance of flooding over 30 yrs
- 0.0%
- Est. flood insurance / yr
- $507 – $1,088
Fire risk 1/10 · Minimal
- Est. fire insurance / yr
- $1,222 – $2,270
Heat risk 7/10 · Major
- Hot days now (above 109°F)
- 7 days/yr
- Hot days in 30 yrs
- 24 days/yr
Wind risk 6/10 · Moderate
- Chance of severe wind over 30 yrs
- 27.0%
Air-quality risk 3/10 · Minor
- Unhealthy air days now
- 3 days/yr
- Unhealthy air days in 30 yrs
- 4 days/yr
Risk factors via First Street. Map © Google.
Why this score? — see what drove the D grade
The composite is a weighted blend of 9 inputs, each scored 0–100. Each bar is that input's sub-score; the figure is the points it added to the 100-point composite (weight × sub-score).
- ARV discount +15.0/15.0
- Appreciation +10.0/10.0
- Cash flow +6.4/30.0
- Livability +4.0/5.0
- Schools +2.8/10.0
- Condition / age +2.5/5.0
- Rent growth +1.4/5.0
- DSCR +0.7/10.0
- 1% rule +0.4/10.0
$274,900
🖨 Deal sheet (PDF) 📄 Offer letter ✓ Due diligence
Listing remarks MLS
Motivated Seller! Bring all offers!! Prime location with incredible potential! This spacious 6-bedroom, 2.5-bath property is located in the heart of Dallas and offers a rare combination of space, flexibility, and opportunity. Ideal for a large household or buyers seeking additional workspace, the property features a functional layout along with a modern detached office. Situated on a generous lot, the expansive front and backyard provide endless possibilities for outdoor living, expansion, or future improvements. Whether you're looking to create your dream home or invest in a growing area, this property is full of potential. Conveniently located just minutes from Trinity Groves and Downtown Dallas, with quick access to I-30 and Loop 12, you’ll enjoy easy access to shopping, dining, and major commuting routes—all while being surrounded by ongoing development and revitalization. Property is being sold as-is and does require some work, making it a great opportunity for investors or buyers looking to add value. Don’t miss your chance to own a versatile property in a rapidly developing area—schedule your showing today!
Key facts
- Generous lot
- 7,492 sq ft lot
- Built 1945
Tags
Neighborhood map
What this means for you Summary
Snapshot
- This is a 1-bed/1.0-bath single-family listed at $275k.
Deal economics
- At list price, monthly cash flow is $-481 ($-6k/yr) — negative.
- To cash-flow at today's rent, offer at most $190k (30.9% below list).
- To meet the 1% rule (rent ≥ 1% of price), the offer needs to be $147k (46.4% below list).
- Recommended offer: $147k (46.4% below list) — sets the bar for 1% rule.
- Cap rate 4.2% vs local median 2.3% in Dallas — top-decile yield for the area; either an underpriced asset or a hidden risk that comps aren't pricing in. Stress-test before assuming the spread holds.
Location & tenants
- Location reads 81/100 on livability (#24 in TX, #1,380 nationally) — a professional / high-income tenant draw. Strengths: amenities A+, commute A+, housing A+; Watch: crime F.
- Dallas ISD (urban): math 31% / reading 36% proficiency, ranked #559 of 826 in TX (top 68%) — families likely to look elsewhere, expect single-tenant / working-renter base with shorter leases; 83% free/reduced lunch — lower-income household profile, screen leases tightly.
- Zoned schools: Eladio R Martinez Learning Center (math 25% / reading 21%, grade F, #3,277 of 4,322 statewide, top 77%, 536 students, 97% FRL); D A Hulcy Steam Middle (math 33% / reading 32%, grade F, #947 of 1,662 statewide, top 58%, 423 students, 88% FRL); L G Pinkston H S (math 10% / reading 21%, grade F, #1,505 of 1,632 statewide, top 92%, 1,139 students, 92% FRL).
- Market conditions: Rents falling (-4.2%/yr); 249 active listings in the ZIP; 1 comparable units currently listed for rent nearby; 12,577 units permitted in Dallas County in 2024 (6,829 in 5+ unit buildings).
Forward outlook
- In year one you build about $29k of equity ($2k loan paydown + $27k appreciation (10.0% local appreciation)).
- Dallas County population projected at +35% by 2050 — long-run rental-demand tailwind backs the buy-and-hold thesis.
- By year 2, paydown + projected appreciation supports a ~$47k cash-out refi (75% LTV) — recoverable capital for the next deal without selling this one.
Negotiation context
- It's been on market 66 days — a 6% lower offer ($258k) is reasonable based on typical stale-listing flexibility.
- 7 sale attempts since 16y ago; this cycle's ask has dropped $25k (8%) from the opening price — seller is motivated, your offer sets the floor, not the list.
Risks & watch-outs
- Watch-outs: built in 1945 — expect roof / HVAC / electrical / plumbing capex.
- Climate carrying-cost: major wind risk, 27% chance of damaging wind over 30y; extreme-heat days projected 7→24/yr by 2055 (HVAC capex compounding) — expect insurance premiums to compound above CPI over the hold.
Questions for the listing agent
- What do current leases actually rent for vs. the listed asking? Can we see a recent rent roll and the last 12 months of T-12 income?
- It's been on market 66 days. Have you received any prior offers? Is the seller open to a 46% concession, seller financing, or rate buy-down credit?
- Built in 1945 — when were the roof, HVAC, electrical panel, plumbing, and water heater last replaced?
- Why hasn't it sold? Are there any deal-killer items the seller is aware of (foundation, flood, title, zoning, code violations)?
- Is there a deadline driving the sale (1031 exchange, divorce, estate, relocation)? That informs how much negotiation room exists.
- Crime grade is F in this area — have there been break-ins, vandalism, or insurance claims at this property in the last 3 years? What carrier currently insures it and at what premium?
- The area grade is low — what's the realistic commute time and amenity access for the typical tenant pool here? Any planned neighborhood developments (good or bad) we should know about?
- What's the average days-on-market for RENTAL listings here right now (not sales)? A rising rental-DOM trend means longer vacancies and softer asking-rent achievability than the comps imply.
- What's the recent tenant-quality profile in this submarket — average credit score on applications, eviction rate, late-payment / NSF rate, and stable-employment percentage? A property-management company in the area should have these aggregated.
- How much new for-sale + rental construction is in the pipeline within 1–3 miles? Heavy new supply typically softens prices + rents 12–24 months out; constrained supply supports both.
Investment metrics
- 1% rule
- 0.54% ✗
- Cap rate
- 4.19%
- Cash-on-cash
- -7.50%
- DSCR
- 0.67
- GRM
- 15.6
CMA / ARV
- ARV (median comp)
- $408,120
- List price
- $274,900
- Delta
- -32.64%
- Verdict
- UNDERPRICED
- Comps
- 1 within 2.0 mi
Show comp detail 1 sale within ~0.75 mi
| Address | Dist | Beds/Ba | Sqft | Sold | Price | $/sf | Match |
|---|---|---|---|---|---|---|---|
| 5546 Bernal Dr | 0.39mi | 2/1.0 (+1) | 1,064 (-13%) | 4mo | $229,900 | $216 | 51 |
Match score weights: distance 35% · size 25% · config 20% · recency 20%. Top-matched comps best support the ARV.
Projected returns pro-forma
10.0% appreciation · 0.0% rent growth · sell at horizon
- IRR
- 18.4%
- Equity multiple
- 2.49×
- Total profit
- $114,631
- Equity at exit
- $247,652
- IRR
- 16.7%
- Equity multiple
- 5.59×
- Total profit
- $353,664
- Equity at exit
- $534,070
Cash invested: $76,972 (down + closing). Projections, not guarantees.
Landlord ↔ Tenant lean methodology
- Overall (STATE)
- 87 Strongly Landlord-Friendly
- State Texas
- 87 Strongly Landlord-Friendly · R+5
- County
- — inherits STATE
- City
- — inherits STATE
ZIP-level market 75212
- Rents YoY
- -4.2%
- Active inventory
- 249
- Price-to-rent
- 15.6×
Monthly cashflow live
- Estimated rent
- $1,473 medium interval (Pro) →
- Mortgage (P&I)
- −$1,442
- Tax from tax record
- −$89 /mo · $1,063/yr
- Insurance
- −$115
- HOA
- −$0
- Vacancy / Maint / Mgmt
- −$309
- Net cashflow
- $-481
Break-even live
Sensitivity live
| Price | -10% $-325 | -5% $-403 | +0% $-481 | +5% $-559 | +10% $-637 |
|---|---|---|---|---|---|
| Rent | -10% $-597 | -5% $-539 | +0% $-481 | +5% $-423 | +10% $-365 |
| Rate | -1.0pp $-343 | -0.5pp $-411 | base $-481 | +0.5pp $-552 | +1.0pp $-625 |
UW: 25.0% down · 7.5% · 30yr · 1.5% tax · 5.0% vac · 8.0% maint · 8.0% mgmt
Financing live
Cash to close
- Down payment
- $68,725
- Closing costs
- $8,247
- Reserves months
- —
- Total cash needed
- —
Loan-product check · same deal, 3 products live
Conventional
25% down · 7.5% · 30yr
- Down + closing
- —
- Monthly P&I
- —
- Monthly cashflow
- —
- DSCR
- —
- Eligible?
- —
Personal DTI + credit; lowest rate.
DSCR
20% down · 8.5% · 30yr
- Down + closing
- —
- Monthly P&I
- —
- Monthly cashflow
- —
- DSCR
- —
- Eligible?
- —
No personal income docs; deal must DSCR.
Hard money
10% down · 12.0% · 12mo
- Down + closing
- —
- Monthly P&I
- —
- Monthly cashflow
- —
- DSCR
- —
- Eligible?
- —
Short-term bridge; refi at stabilization.
Rent comps 1 comps
| Address | Beds | Baths | Sqft | Rent | $/sqft | DOM | Units | Dist |
|---|---|---|---|---|---|---|---|---|
| 1310 N Cockrell Hill Rd Dallas, TX | 3.0 | 1.0–2.0 | 875 | $1,530 | $1.75 | 0d | 36 | 1.50mi |
Listing history 33 events
-
2026-06-21days on market $274,900 Active 66 DOM
-
2026-06-18days on market $274,900 Active 63 DOM
-
2026-06-17days on market $274,900 Active 62 DOM
-
2026-06-16days on market $274,900 Active 61 DOM
-
2026-06-15days on market $274,900 Active 60 DOM
-
2026-06-13days on market $274,900 Active 58 DOM
-
2026-06-09days on market $274,900 Active 54 DOM
-
2026-06-08pricedays on market $274,900 Active 53 DOM
-
2026-06-07days on market $299,900 Active 52 DOM
-
2026-06-04days on market $299,900 Active 49 DOM
-
2026-06-03days on market $299,900 Active 48 DOM
-
2026-06-02days on market $299,900 Active 47 DOM
-
2026-06-01days on market $299,900 Active 46 DOM
-
2026-05-31days on market $299,900 Active 45 DOM
-
2026-04-16$299,900 Active 1159-char remark
Show marketing remark (1159 chars)
Motivated Seller! Bring all offers!! Prime location with incredible potential! This spacious 6-bedroom, 2.5-bath property is located in the heart of Dallas and offers a rare combination of space, flexibility, and opportunity. Ideal for a large household or buyers seeking additional workspace, the property features a functional layout along with a modern detached office. Situated on a generous lot, the expansive front and backyard provide endless possibilities for outdoor living, expansion, or future improvements. Whether you're looking to create your dream home or invest in a growing area, this property is full of potential. Conveniently located just minutes from Trinity Groves and Downtown Dallas, with quick access to I-30 and Loop 12, you’ll enjoy easy access to shopping, dining, and major commuting routes—all while being surrounded by ongoing development and revitalization. Property is being sold as-is and does require some work, making it a great opportunity for investors or buyers looking to add value. Don’t miss your chance to own a versatile property in a rapidly developing area—schedule your showing today!
-
2026-01-02historical
-
2025-07-10$279,900 Active
-
2025-04-18historical
-
2025-01-13price $279,900
-
2024-10-18status Active
-
2024-10-17historical
-
2024-09-05price $300,000
-
2024-07-22price $325,000
-
2024-04-17$350,000 Active
-
2023-12-28historical
-
2023-09-08$350,000 Active
-
2021-03-09historical
-
2020-08-15$350,000 Active
-
2016-05-26soldstatus
-
2010-12-13soldstatus
-
2010-12-10soldstatus Closed
-
2010-11-19status Pending
-
2010-09-15$40,000 Active
ⓘ Source: listings_history table (triggers on properties + properties_extension) + one-shot
backfill from property_details.listing_events for pre-trigger history.
Tax reassessment forecast TX · Resets to sale price
- Current annual tax
- $1,063 · $89/mo
- Projected year-2 tax
- $5,031 · $419/mo
- Expected delta
- +$3,968/yr (+$331/mo · 373.3%)
ⓘ Screening estimate from a state-policy table — verify with the county assessor before closing.
Climate risk First Street
- Flood 1/10 Low FEMA zone X (unshaded) · 0% chance over 30 yrs
- Wildfire 1/10 Low
- Heat 7/10 Severe 7 d/yr ≥109°F today · 24 d/yr by 30 yrs out
- Wind 6/10 Major 27% chance of damaging wind over 30 yrs
- Air quality 3/10 Moderate 3 unhealthy d/yr today · 4 by 30 yrs out
Nearby sold comps map
Loading sold comps map…
Walkable amenities ~0.75 mi
Loading nearby amenities…
Taxation est. · year 1
- Rental income
- $17,677
- − Mortgage interest
- −$15,399
- − Property taxes
- −$1,063
- − Insurance
- −$1,374
- − Repairs & maintenance
- −$1,414
- − Management
- −$1,414
- − Depreciation
- −$7,997
- Taxable loss
- −$10,985
- Est. tax savings @ 24.0%
- +$2,636
- After-tax cash flow
- $-3,136/yr
For passive investors: Depreciation is non-cash, so a rental often shows a tax loss while cash-flowing — sheltering income. Rental losses are passive: they offset passive income freely, and up to $25,000/yr can offset ordinary (W-2) income if you actively participate and your MAGI is under $100k (phasing out to $0 by $150k); unused losses carry forward. On sale, claimed depreciation is recaptured at up to 25%, and gains may owe capital-gains tax (a 1031 exchange can defer both). Figures are a year-1 estimate at your 24.0% rate — not tax advice; consult a CPA.
Schools (NCES district)
- District
- Dallas ISD
- NCES district ID
- 4816230
- Math proficiency
- 31% ▼ -16.00%
- Reading proficiency
- 36% ▼ -4.00%
- Median HH income
- $42,881
- Composite
- 28.41/100
- National rank
- #6763
- State rank
- #559 of 826 in TX
Livability — Dallas
- Score
- 81/100
- State rank
- #24
- US rank
- #1380
Category grades
Schools grade is shown separately in the Schools card above.
Census & demographics
- Census place
- Dallas, TX
- County
- Dallas County · 2,612,404 people
- City population
- 1,168,437
- Metro
- Dallas-Fort Worth-Arlington, TX
- Population (ZIP)
- 28,259
- Household income
- $59,750
- Rent vs Own
- Severe rent burden
- 892.0
Population outlook (Dallas County) Hauer SSP2
- Today (2025)
- 2,979,839 people
- By 2030
- 3,191,823 · +7.1%
- By 2040
- 3,619,611 · +21.5%
- By 2050
- 4,026,915 · +35.1%
- By 2075
- 4,957,073 · +66.4%
- By 2100
- 5,508,725 · +84.9%
Race, ethnicity, and origin ACS 2023
- Neighborhood character
- Predominantly Hispanic (67%)
- Race & ethnicity
- Hispanic / Latino 67% Two or more races 26% Black 23% White 6% Asian 2%
- Hispanic origin (detail)
- Mexican 55%
- Common ancestry
- Slovak 1%
- Foreign-born
- 27% · Canada, Vietnam, Jamaica
- Languages at home
- 42% English-only · Spanish 52% Vietnamese 1%
Political lean MEDSL · Dallas
- 2024 margin
- Strong D (+22.2) · D 60.2% · R 38.0% · Other 1.8%
- 2008→2024 swing
- +6.9pp toward D · 2008: 15.3pp · 2024: 22.2pp
- All cycles
- 2024: D+22.2 2020: D+31.6 2016: D+26.2 2012: D+15.4 2008: D+15.3
Not yet ingested
- Civics
- —
Market trends
- HPI YoY
- ▲ 138.69%
- Current HPI
- 477.2035
- Rent YoY
- ▼ -4.21%
- Metro
- Dallas-Fort Worth-Arlington, TX
- State GDP YoY
- ▲ 3.95%
- F500 in state
- 110
Industry mix (Fortune 500 HQ in TX)
| Industry | F500 HQs | Revenue |
|---|---|---|
| Energy | 16 | $1,198B |
|
||
| Technology | 5 | $198B |
|
||
| Engineering / Construction | 4 | $72B |
|
||
| Energy Services | 3 | $60B |
|
||
| Utilities | 3 | $41B |
|
||
| Healthcare | 2 | $330B |
|
||
Price history
+649.8% since first listed19 events — show timeline
- 2026-04-16 Listed $299,900 NTREIS
- 2026-01-02 Listing Removed — NTREIS
- 2025-07-10 Listed $279,900 NTREIS
- 2025-04-18 Listing Removed — NTREIS
- 2025-01-13 Price Changed $279,900 NTREIS
- 2024-10-18 Relisted — NTREIS
- 2024-10-17 Listing Removed — NTREIS
- 2024-09-05 Price Changed $300,000 NTREIS
- 2024-07-22 Price Changed $325,000 NTREIS
- 2024-04-17 Listed $350,000 NTREIS
- 2023-12-28 Listing Removed — NTREIS
- 2023-09-08 Listed $350,000 NTREIS
- 2021-03-09 Listing Removed — NTREIS
- 2020-08-15 Listed $350,000 NTREIS
- 2016-05-26 Sold (Public Records) — Public Records
- 2010-12-13 Sold (Public Records) — Public Records
- 2010-12-10 Sold (MLS) — NTREIS
- 2010-11-19 Pending — NTREIS
- 2010-09-15 Listed $40,000 NTREIS
Property tax history
+11.5%/yrLatest (2014): $1,063 · +0.3% YoY. Source: county tax records.
Cash-flow waterfall
monthlySold comps — $/sqft
last 12 mo · ≤1 miLoading sold comps…