 Multi-family
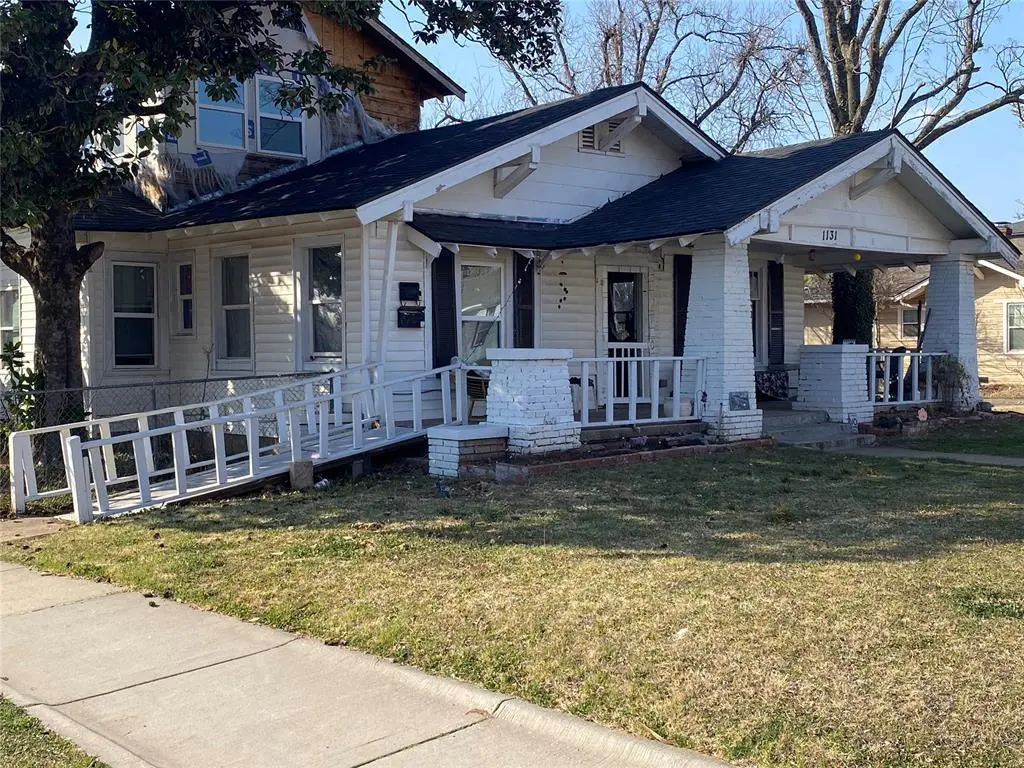
1131 N Ellison Ave · Oklahoma City, OK
Flood risk 1/10 · Minimal
- FEMA flood zone
- X (unshaded)
- Chance of flooding over 30 yrs
- 0.0%
- Est. flood insurance / yr
- $507 – $1,088
Fire risk 1/10 · Minimal
- Est. fire insurance / yr
- $2,463 – $4,575
Heat risk 6/10 · Moderate
- Hot days now (above 107°F)
- 7 days/yr
- Hot days in 30 yrs
- 19 days/yr
Wind risk 2/10 · Minimal
- Chance of severe wind over 30 yrs
- 3.0%
Air-quality risk 2/10 · Minimal
- Unhealthy air days now
- 1 days/yr
- Unhealthy air days in 30 yrs
- 2 days/yr
Risk factors via First Street. Map © Google.
Why this score? — see what drove the B grade
The composite is a weighted blend of 9 inputs, each scored 0–100. Each bar is that input's sub-score; the figure is the points it added to the 100-point composite (weight × sub-score).
- Cash flow +30.0/30.0
- ARV discount +15.0/15.0
- DSCR +10.0/10.0
- 1% rule +9.4/10.0
- Livability +4.0/5.0
- Rent growth +3.2/5.0
- Condition / age +2.5/5.0
- Schools +0.7/10.0
- Appreciation +0.0/10.0
$189,000
🖨 Deal sheet 📄 Offer letter ✓ Due diligence
Multi-family units
County records classify this as Multi-Family (2-4 Unit). Listing-text estimate: 1 unit. estimate disagrees with records
Listing remarks MLS
EXCELLENT OPPORTUNITY CLOSE TO DOWNTOWN and (CLASSEN 10 PENN. NEIGHBORHOOD) a couple blocks from the Old St. Anthony's Hospital. GREAT LOCATION GREAT PRICE. *** INCOME PRODUCING PROPERTY CURRENTLY $750. -$1300. UNIT ONE. (Below Market) , $500.-$600. (Below Market) UNIT 2 . UNIT 3 needs minor work. ( $650.-$750. when leased ) DON'T DELAY CALL TODAY !
Key facts
- Close to downtown
- 7,501 sq ft lot
- Built 1922
Tags
Neighborhood map
What this means for you Summary
Snapshot
- This is a 2-bed/2.0-bath multifamily listed at $189k.
Deal economics
- At list price, monthly cash flow is $1k ($12k/yr) — positive.
- The deal already cash-flows at list — no discount required.
- Meets the 1% rule at list price ($3k rent vs $189k).
- Recommended offer: $178k (6.0% below list) — sets the bar for market timing.
- Cap rate 12.9% vs local median 3.7% in Oklahoma City — top-decile yield for the area; either an underpriced asset or a hidden risk that comps aren't pricing in. Stress-test before assuming the spread holds.
Location & tenants
- Location reads 80/100 on livability (#3 in OK, #1,635 nationally) — a professional / high-income tenant draw. Strengths: amenities A+, commute A+, cost of living A+; Watch: schools F, crime F.
- Oklahoma City (urban): math 7% / reading 10% proficiency, ranked #254 of 270 in OK (top 94%) — low school quality limits family demand, transient renter base, plan for 1-2y turnover; 82% free/reduced lunch — lower-income household profile, screen leases tightly.
- Market conditions: Rents rising (+2.9%/yr); 167 active listings in the ZIP; 27 comparable units currently listed for rent nearby; rentals at typical pace (median 24d on market — plan ~3-4 weeks tenant-placement turnaround); 44% of comp listings sitting > 30 days — soft ceiling on asking rent; 5,365 units permitted in Oklahoma County in 2024 (569 in 5+ unit buildings).
- At $2,723/mo this rent would consume 54% of the median local household income ($60k/yr) (locally 892% of renters already pay >50% of income on rent) — very limited rent-growth headroom before tenants either downsize or default.
Forward outlook
- Local home prices are declining (-3.0%/yr); year-one equity from $1k of loan paydown is wiped out by about $6k of value loss. Plan a longer hold.
- Oklahoma County population projected at +41% by 2050 — long-run rental-demand tailwind backs the buy-and-hold thesis.
- At projected returns (-3.0% appreciation + 2.9% rent growth), your $53k cash investment doubles in ~6 years — after that, you're playing with house money.
Negotiation context
- It's been on market 63 days — a 6% lower offer ($178k) is reasonable based on typical stale-listing flexibility.
- 6 sale attempts with the ask held roughly flat each time — persistent listings suggest the price (not the market) is what's stuck; bring a comps-based counter.
- Current owner paid $33k; list at $189k implies a 473% gain — meaningful room to come down on a strong offer.
Risks & watch-outs
- Watch-outs: built in 1922 — expect roof / HVAC / electrical / plumbing capex.
- Climate carrying-cost: extreme-heat days projected 7→19/yr by 2055 (HVAC capex compounding) — expect insurance premiums to compound above CPI over the hold.
Questions for the listing agent
- It's been on market 63 days. Have you received any prior offers? Is the seller open to a 6% concession, seller financing, or rate buy-down credit?
- Built in 1922 — when were the roof, HVAC, electrical panel, plumbing, and water heater last replaced?
- Why hasn't it sold? Are there any deal-killer items the seller is aware of (foundation, flood, title, zoning, code violations)?
- Is there a deadline driving the sale (1031 exchange, divorce, estate, relocation)? That informs how much negotiation room exists.
- Schools are F-rated, which usually means shorter tenancies and higher turnover. Who's the typical renter profile here, and what's been the actual vacancy rate?
- Crime grade is F in this area — have there been break-ins, vandalism, or insurance claims at this property in the last 3 years? What carrier currently insures it and at what premium?
- What's the average days-on-market for RENTAL listings here right now (not sales)? A rising rental-DOM trend means longer vacancies and softer asking-rent achievability than the comps imply.
- What's the recent tenant-quality profile in this submarket — average credit score on applications, eviction rate, late-payment / NSF rate, and stable-employment percentage? A property-management company in the area should have these aggregated.
- How much new apartment / multifamily construction is in the pipeline within 1–3 miles? Heavy new supply (>2% of stock underway) typically softens rents 12–24 months out; light construction supports rent growth.
Investment metrics
- 1% rule
- 1.44% ✓
- Cap rate
- 12.87%
- Cash-on-cash
- 23.49%
- DSCR
- 2.04
- GRM
- 5.8
CMA / ARV
- ARV (median comp)
- $305,311
- List price
- $189,000
- Delta
- -38.10%
- Verdict
- UNDERPRICED
- Comps
- 20 within 1.0 mi
Projected returns pro-forma
-3.0% appreciation · 2.93% rent growth · sell at horizon
- IRR
- 16.5%
- Equity multiple
- 1.66×
- Total profit
- $35,071
- Equity at exit
- $28,181
- IRR
- 25.0%
- Equity multiple
- 3.16×
- Total profit
- $114,385
- Equity at exit
- $16,341
Cash invested: $52,920 (down + closing). Projections, not guarantees.
Landlord ↔ Tenant lean methodology
- Overall (STATE)
- 83 Strongly Landlord-Friendly
- State Oklahoma
- 83 Strongly Landlord-Friendly · R+20
- County
- — inherits STATE
- City
- — inherits STATE
ZIP-level market 73106
- Home prices YoY
- -34.8%
- Rents YoY
- 2.9%
- Active inventory
- 167
- Price-to-rent
- 17.4×
Monthly cashflow live
- Estimated rent
- $2,723 high interval (Pro) →
- Mortgage (P&I)
- −$991
- Tax from tax record
- −$46 /mo · $547/yr
- Insurance
- −$79
- HOA
- −$0
- Vacancy / Maint / Mgmt
- −$572
- Net cashflow
- $1,036
Break-even live
3-unit breakdown (identical units grouped — click to expand)
| Units | Beds | Baths | Est. rent |
|---|---|---|---|
| 3× units | 1 | 1 | $2,724 |
| #1 | 1 | 1 | $908 |
| #2 | 1 | 1 | $908 |
| #3 | 1 | 1 | $908 |
| Total (3 units) | $2,723 | ||
UW: 25.0% down · 7.5% · 30yr · 1.5% tax · 5.0% vac · 8.0% maint · 8.0% mgmt
Financing live
Cash to close
- Down payment
- $47,250
- Closing costs
- $5,670
- Reserves months
- —
- Total cash needed
- —
Loan-product check · same deal, 3 products live
Conventional
25% down · 7.5% · 30yr
- Down + closing
- —
- Monthly P&I
- —
- Monthly cashflow
- —
- DSCR
- —
- Eligible?
- —
Personal DTI + credit; lowest rate.
DSCR
20% down · 8.5% · 30yr
- Down + closing
- —
- Monthly P&I
- —
- Monthly cashflow
- —
- DSCR
- —
- Eligible?
- —
No personal income docs; deal must DSCR.
Hard money
10% down · 12.0% · 12mo
- Down + closing
- —
- Monthly P&I
- —
- Monthly cashflow
- —
- DSCR
- —
- Eligible?
- —
Short-term bridge; refi at stabilization.
Rent comps 27 comps
| Address | Beds | Baths | Sqft | Rent | $/sqft | DOM | Units | Dist |
|---|---|---|---|---|---|---|---|---|
| 1209 NW 11th St Oklahoma City, OK | 2.0 | 2.5 | 1400 | $1,795 | $1.28 | 17d | 1 | 0.10mi |
| 1209 NW 11th St Oklahoma City, OK | 2.0 | 2.5 | 1400 | $1,795 | $1.28 | 4d | 1 | 0.10mi |
| 925 NW 8th St Oklahoma City, OK | 3.0 | 3.0 | 2156 | $2,950 | $1.37 | 43d | 1 | 0.38mi |
| 1305 Classen Dr Oklahoma City, OK | 1.0–3.0 | 1.0–3.5 | 1677 | $3,548 | $2.11 | 4d | 7 | 0.55mi |
| 819 NW 6th St Oklahoma City, OK | 3.0 | 3.5 | 2100 | $6,995 | $3.33 | 43d | 1 | 0.56mi |
| 817 NW 6th St Oklahoma City, OK | 3.0 | 3.5 | 2100 | $6,500 | $3.10 | 43d | 1 | 0.57mi |
| 1303 N Dewey Ave Oklahoma City, OK | 3.0 | 3.5 | 2438 | $5,750 | $2.36 | 43d | 1 | 0.63mi |
| 1303 N Dewey Ave Oklahoma City, OK | 3.0 | 3.5 | 2438 | $5,750 | $2.36 | 23d | 1 | 0.63mi |
| 1325 N Dewey Ave Unit 1325 Oklahoma City, OK | 2.0 | 4.0 | 2442 | $5,750 | $2.35 | 16d | 1 | 0.64mi |
| 1721 NW 18th St Oklahoma City, OK | 3.0 | 2.0 | 1900 | $1,300 | $0.68 | 43d | 1 | 0.65mi |
| 1928 NW 18th St Oklahoma City, OK | 3.0 | 2.5 | 1914 | $2,200 | $1.15 | 43d | 1 | 0.81mi |
| 1302 NW 22nd St Oklahoma City, OK | 3.0 | 2.0 | 1647 | $2,395 | $1.45 | 43d | 1 | 0.83mi |
| 1302 NW 22nd St Oklahoma City, OK | 3.0 | 2.5 | 1647 | $2,395 | $1.45 | 23d | 1 | 0.83mi |
| 627 Couch Dr Oklahoma City, OK | 2.0 | 2.5 | 1534 | $2,495 | $1.63 | 23d | 1 | 0.90mi |
| 2301 N Florida Ave Oklahoma City, OK | 2.0 | 1.5 | 1700 | $1,235 | $0.73 | 17d | 1 | 0.93mi |
| 2139 NW 15th St Oklahoma City, OK | 3.0 | 2.0 | 1551 | $1,950 | $1.26 | 43d | 1 | 0.95mi |
| 835 W Sheridan Ave Oklahoma City, OK | 3.0 | 1.0–2.0 | 992 | $2,271 | $2.29 | 1d | 19 | 1.00mi |
| 1400 NW 25th St Unit 2515-200 Oklahoma City, OK | 3.0 | 2.5 | 1600 | $1,595 | $1.00 | 43d | 1 | 1.05mi |
| 726 NW 24th St Oklahoma City, OK | 3.0 | 2.0 | 1485 | $1,599 | $1.08 | 2d | 1 | 1.09mi |
| 1100 NW 27th St Unit 1100 Oklahoma City, OK | 3.0 | 2.0 | 1500 | $1,195 | $0.80 | 23d | 1 | 1.20mi |
| 140 Park Ave Oklahoma City, OK | 3.0 | 1.0–2.5 | 2033 | $9,107 | $4.48 | 1d | 32 | 1.32mi |
| 2519 W Park Pl Oklahoma City, OK | 3.0 | 2.0 | 2000 | $1,900 | $0.95 | 43d | 1 | 1.33mi |
| 2525 NW 11th St Oklahoma City, OK | 3.0 | 2.0 | 1415 | $1,550 | $1.10 | 43d | 1 | 1.35mi |
| 800 N Oklahoma Ave Oklahoma City, OK | 2.0 | 1.0–3.0 | 1051 | $2,555 | $2.43 | 1d | 32 | 1.39mi |
| 425 N Oklahoma Ave Oklahoma City, OK | 1.0–3.0 | 1.0–2.5 | 1030 | $1,658 | $1.61 | 1d | 44 | 1.42mi |
| 2004 NW 28th St Oklahoma City, OK | 2.0 | 1.0 | 1425 | $1,195 | $0.84 | 43d | 1 | 1.43mi |
| 148 NE 15th St Oklahoma City, OK | 3.0 | 2.5 | 1593 | $2,099 | $1.32 | 1d | 1 | 1.44mi |
Listing history 10 events
-
2026-05-05status Pending 375-char remark
Show marketing remark (375 chars)
EXCELLENT OPPORTUNITY CLOSE TO DOWNTOWN and (CLASSEN 10 PENN. NEIGHBORHOOD) a couple blocks from the Old St. Anthony's Hospital. GREAT LOCATION GREAT PRICE. *** INCOME PRODUCING PROPERTY CURRENTLY $750. -$1300. UNIT ONE. (Below Market) , $500.-$600. (Below Market) UNIT 2 . UNIT 3 needs minor work. ( $650.-$750. when leased ) DON'T DELAY CALL TODAY !
-
2026-04-22status Active 375-char remark
Show marketing remark (375 chars)
EXCELLENT OPPORTUNITY CLOSE TO DOWNTOWN and (CLASSEN 10 PENN. NEIGHBORHOOD) a couple blocks from the Old St. Anthony's Hospital. GREAT LOCATION GREAT PRICE. *** INCOME PRODUCING PROPERTY CURRENTLY $750. -$1300. UNIT ONE. (Below Market) , $500.-$600. (Below Market) UNIT 2 . UNIT 3 needs minor work. ( $650.-$750. when leased ) DON'T DELAY CALL TODAY !
-
2026-04-11status Pending 375-char remark
Show marketing remark (375 chars)
EXCELLENT OPPORTUNITY CLOSE TO DOWNTOWN and (CLASSEN 10 PENN. NEIGHBORHOOD) a couple blocks from the Old St. Anthony's Hospital. GREAT LOCATION GREAT PRICE. *** INCOME PRODUCING PROPERTY CURRENTLY $750. -$1300. UNIT ONE. (Below Market) , $500.-$600. (Below Market) UNIT 2 . UNIT 3 needs minor work. ( $650.-$750. when leased ) DON'T DELAY CALL TODAY !
-
2026-04-08status Active 375-char remark
Show marketing remark (375 chars)
EXCELLENT OPPORTUNITY CLOSE TO DOWNTOWN and (CLASSEN 10 PENN. NEIGHBORHOOD) a couple blocks from the Old St. Anthony's Hospital. GREAT LOCATION GREAT PRICE. *** INCOME PRODUCING PROPERTY CURRENTLY $750. -$1300. UNIT ONE. (Below Market) , $500.-$600. (Below Market) UNIT 2 . UNIT 3 needs minor work. ( $650.-$750. when leased ) DON'T DELAY CALL TODAY !
-
2026-03-25status Active 375-char remark
Show marketing remark (375 chars)
EXCELLENT OPPORTUNITY CLOSE TO DOWNTOWN and (CLASSEN 10 PENN. NEIGHBORHOOD) a couple blocks from the Old St. Anthony's Hospital. GREAT LOCATION GREAT PRICE. *** INCOME PRODUCING PROPERTY CURRENTLY $750. -$1300. UNIT ONE. (Below Market) , $500.-$600. (Below Market) UNIT 2 . UNIT 3 needs minor work. ( $650.-$750. when leased ) DON'T DELAY CALL TODAY !
-
2026-03-21status Active 375-char remark
Show marketing remark (375 chars)
EXCELLENT OPPORTUNITY CLOSE TO DOWNTOWN and (CLASSEN 10 PENN. NEIGHBORHOOD) a couple blocks from the Old St. Anthony's Hospital. GREAT LOCATION GREAT PRICE. *** INCOME PRODUCING PROPERTY CURRENTLY $750. -$1300. UNIT ONE. (Below Market) , $500.-$600. (Below Market) UNIT 2 . UNIT 3 needs minor work. ( $650.-$750. when leased ) DON'T DELAY CALL TODAY !
-
2026-03-14status Active 375-char remark
Show marketing remark (375 chars)
EXCELLENT OPPORTUNITY CLOSE TO DOWNTOWN and (CLASSEN 10 PENN. NEIGHBORHOOD) a couple blocks from the Old St. Anthony's Hospital. GREAT LOCATION GREAT PRICE. *** INCOME PRODUCING PROPERTY CURRENTLY $750. -$1300. UNIT ONE. (Below Market) , $500.-$600. (Below Market) UNIT 2 . UNIT 3 needs minor work. ( $650.-$750. when leased ) DON'T DELAY CALL TODAY !
-
2026-02-27price $189,000 375-char remark
Show marketing remark (375 chars)
EXCELLENT OPPORTUNITY CLOSE TO DOWNTOWN and (CLASSEN 10 PENN. NEIGHBORHOOD) a couple blocks from the Old St. Anthony's Hospital. GREAT LOCATION GREAT PRICE. *** INCOME PRODUCING PROPERTY CURRENTLY $750. -$1300. UNIT ONE. (Below Market) , $500.-$600. (Below Market) UNIT 2 . UNIT 3 needs minor work. ( $650.-$750. when leased ) DON'T DELAY CALL TODAY !
-
2026-02-04$195,000 Active 375-char remark
Show marketing remark (375 chars)
EXCELLENT OPPORTUNITY CLOSE TO DOWNTOWN and (CLASSEN 10 PENN. NEIGHBORHOOD) a couple blocks from the Old St. Anthony's Hospital. GREAT LOCATION GREAT PRICE. *** INCOME PRODUCING PROPERTY CURRENTLY $750. -$1300. UNIT ONE. (Below Market) , $500.-$600. (Below Market) UNIT 2 . UNIT 3 needs minor work. ( $650.-$750. when leased ) DON'T DELAY CALL TODAY !
-
1979-07-01soldstatus $33,000
ⓘ Source: listings_history table (triggers on properties + properties_extension) + one-shot
backfill from property_details.listing_events for pre-trigger history.
Tax reassessment forecast OK · Resets to sale price
- Current annual tax
- $547 · $46/mo
- Projected year-2 tax
- $1,701 · $142/mo
- Expected delta
- +$1,154/yr (+$96/mo · 211.0%)
ⓘ Screening estimate from a state-policy table — verify with the county assessor before closing.
Climate risk First Street
- Flood 1/10 Low FEMA zone X (unshaded) · 0% chance over 30 yrs
- Wildfire 1/10 Low
- Heat 6/10 Major 7 d/yr ≥107°F today · 19 d/yr by 30 yrs out
- Wind 2/10 Low 3% chance of damaging wind over 30 yrs
- Air quality 2/10 Low 1 unhealthy d/yr today · 2 by 30 yrs out
Nearby sold comps map
Loading sold comps map…
Walkable amenities ~0.75 mi
Loading nearby amenities…
Taxation est. · year 1
- Rental income
- $32,676
- − Mortgage interest
- −$10,587
- − Property taxes
- −$547
- − Insurance
- −$945
- − Repairs & maintenance
- −$2,614
- − Management
- −$2,614
- − Depreciation
- −$5,498
- Taxable income
- $9,871
- Est. tax owed @ 24.0%
- −$2,369
- After-tax cash flow
- $10,059/yr
For passive investors: Depreciation is non-cash, so a rental often shows a tax loss while cash-flowing — sheltering income. Rental losses are passive: they offset passive income freely, and up to $25,000/yr can offset ordinary (W-2) income if you actively participate and your MAGI is under $100k (phasing out to $0 by $150k); unused losses carry forward. On sale, claimed depreciation is recaptured at up to 25%, and gains may owe capital-gains tax (a 1031 exchange can defer both). Figures are a year-1 estimate at your 24.0% rate — not tax advice; consult a CPA.
Schools (NCES district)
- District
- Oklahoma City
- NCES district ID
- 4022770
- Math proficiency
- 7% ▼ -5.00%
- Reading proficiency
- 10% ▼ -6.00%
- Median HH income
- $35,606
- Composite
- 7.0/100
- National rank
- #9970
- State rank
- #254 of 270 in OK
Livability — Oklahoma City
- Score
- 80/100
- State rank
- #3
- US rank
- #1635
Category grades
Schools grade is shown separately in the Schools card above.
Census & demographics
- Census place
- Oklahoma City, OK
- County
- Oklahoma County · 771,644 people
- City population
- 498,656
- Metro
- Oklahoma City, OK
- Population (ZIP)
- 12,140
- Household income
- $60,205
- Rent vs Own
- Severe rent burden
- 892.0
Population outlook (Oklahoma County) Hauer SSP2
- Today (2025)
- 911,875 people
- By 2030
- 982,413 · +7.7%
- By 2040
- 1,130,468 · +24.0%
- By 2050
- 1,288,422 · +41.3%
- By 2075
- 1,711,482 · +87.7%
- By 2100
- 2,088,448 · +129.0%
Race, ethnicity, and origin ACS 2023
- Neighborhood character
- Diverse neighborhood (Simpson 0.67)
- Race & ethnicity
- White 50% Hispanic / Latino 27% Two or more races 15% Black 7% Asian 6% Native American 3%
- Hispanic origin (detail)
- Mexican 20%
- Common ancestry
- Scottish 3% Lithuanian 2% Slovak 2%
- Foreign-born
- 17% · Canada, Vietnam, Jamaica
- Languages at home
- 71% English-only · Spanish 21% German/W. Germanic 3% Vietnamese 2%
Political lean MEDSL · Oklahoma
- 2024 margin
- Toss-up / Even · D 48.0% · R 49.7% · Other 2.3%
- 2008→2024 swing
- +15.1pp toward D · 2008: -16.8pp · 2024: -1.7pp
- All cycles
- 2024: R+1.7 2020: R+1.1 2016: R+10.5 2012: R+16.7 2008: R+16.8
Not yet ingested
- Civics
- —
Market trends
- HPI YoY
- ▼ -237.74%
- Current HPI
- 445.1464
- Rent YoY
- ▲ 2.93%
- Metro
- Oklahoma City, OK
- State GDP YoY
- ▲ 1.55%
- F500 in state
- 6
Industry mix (Fortune 500 HQ in OK)
| Industry | F500 HQs | Revenue |
|---|---|---|
| Energy | 3 | $48B |
|
||
Price history
+472.7% since first listed10 events — show timeline
- 2026-05-05 Pending — MLSOK
- 2026-04-22 Relisted — MLSOK
- 2026-04-11 Pending — MLSOK
- 2026-04-08 Relisted — MLSOK
- 2026-03-25 Relisted — MLSOK
- 2026-03-21 Relisted — MLSOK
- 2026-03-14 Relisted — MLSOK
- 2026-02-27 Price Changed $189,000 MLSOK
- 2026-02-04 Listed $195,000 MLSOK
- 1979-07-01 Sold (Public Records) $33,000 Public Records
Property tax history
+5.5%/yrLatest (2025): $547 · +4.2% YoY. Source: county tax records.
Cash-flow waterfall
monthlySold comps — $/sqft
last 12 mo · ≤1 miLoading sold comps…