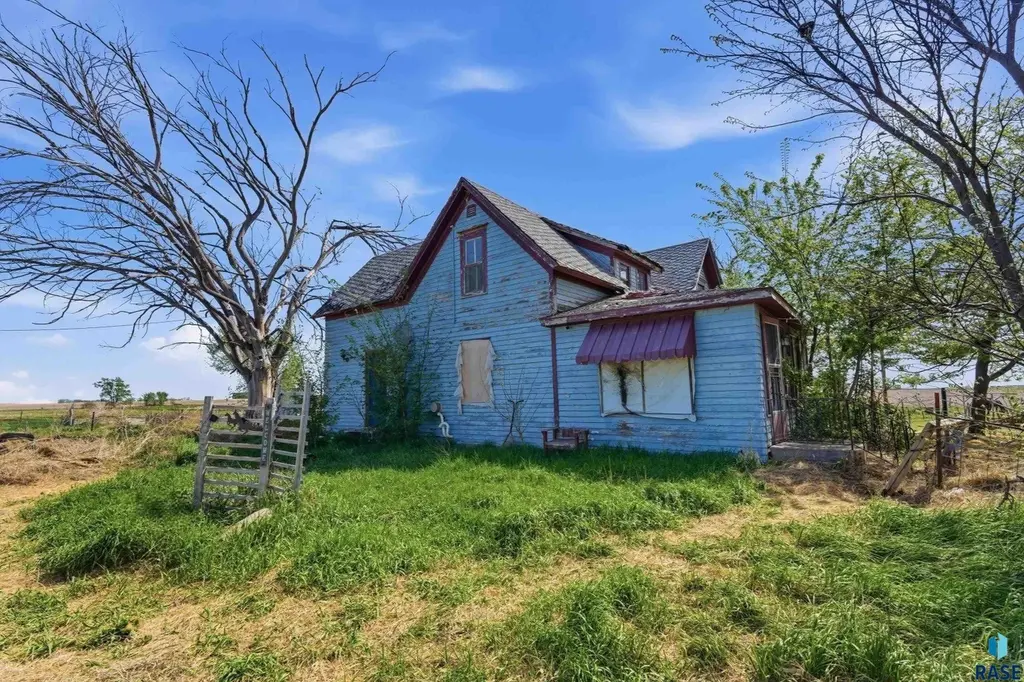
44654 261st St St · Canistota, SD
Flood risk 1/10 · Minimal
- FEMA flood zone
- X (unshaded)
- Chance of flooding over 30 yrs
- 0.0%
- Est. flood insurance / yr
- $473 – $860
Fire risk 2/10 · Minimal
- Est. fire insurance / yr
- $1,342 – $2,492
Heat risk 2/10 · Minimal
- Hot days now (above 99°F)
- 7 days/yr
- Hot days in 30 yrs
- 14 days/yr
Wind risk 2/10 · Minimal
- Chance of severe wind over 30 yrs
- —
Air-quality risk 2/10 · Minimal
- Unhealthy air days now
- 1 days/yr
- Unhealthy air days in 30 yrs
- 1 days/yr
Risk factors via First Street. Map © Google.
Why this score? — see what drove the B- grade
The composite is a weighted blend of 9 inputs, each scored 0–100. Each bar is that input's sub-score; the figure is the points it added to the 100-point composite (weight × sub-score).
- Cash flow +24.2/30.0
- Appreciation +9.8/10.0
- DSCR +7.8/10.0
- ARV discount +7.5/15.0
- Schools +5.9/10.0
- 1% rule +5.4/10.0
- Livability +3.3/5.0
- Rent growth +2.5/5.0
- Condition / age +2.5/5.0
$105,000
🖨 Deal sheet 📄 Offer letter ✓ Due diligence
Key facts
- 1.8 acres
- Functional layout
- 1.8 acre lot
Tags
Property features AI
Finance
- Financial info: Annual tax amount listed
Exterior
- Parking: Detached garage
- Utilities: Rural water; Septic tank
- Home design: Two-story single-family residence; Above-grade finished area listed (1,785)
- Construction: Wood siding exterior
- Exterior features: Composition roof; Property located outside city limits; Land suited for horses and livestock; wooded areas
Interior
- Kitchen: Kitchen on main level (approx. 15 x 13)
- Bedrooms: Main-level primary bedroom (approx. 11 x 13); Upper-level bedrooms: three rooms approximately 10 x 11, 10 x 13, and 12 x 15; Additional upper-level bedroom approximately 12 x 13; Four bedrooms on upper level (total bedroom count reflects listed room distribution)
- Flooring: Carpet; Wood; Laminate; Vinyl; Concrete
- Bathrooms: One full bathroom (main level)
- Heating & cooling: Natural gas heating
- Interior features: Partial basement; Five total rooms
- Laundry & utility: Water heater: propane
Neighborhood map
What this means for you Summary
Snapshot
- This is a 3-bed/1.0-bath single-family listed at $105k.
Deal economics
- At list price, monthly cash flow is $209 ($3k/yr) — positive.
- The deal already cash-flows at list — no discount required.
- Meets the 1% rule at list price ($1k rent vs $105k).
- Recommended offer: $103k (1.5% below list) — sets the bar for market timing.
Location & tenants
- Location reads 66/100 on livability (#126 in SD) — a middle-class / working-renter tenant base. Strengths: cost of living A+, housing A+; Watch: crime D-, amenities F, commute F.
- Canistota School District 43-1 (rural): math 65% / reading 70% proficiency, ranked #7 of 148 in SD (top 5%) — acceptable for families but not a draw, mixed tenant base, ~2y average lease.
- Zoned schools: Canistota Elementary - 02 (math 74% / reading 64%, grade A-, #19 of 253 statewide, top 12%, 157 students, 24% FRL); Canistota High School - 01 (math 24% / reading 75%, grade D+, #69 of 151 statewide, top 65%, 76 students, 16% FRL) — zoned schools at 20% FRL track the district average.
- Market conditions: 17 active listings in the ZIP; 22 units permitted in McCook County in 2024 (0 in 5+ unit buildings).
Forward outlook
- In year one you build about $11k of equity ($726 loan paydown + $10k appreciation (9.5% local appreciation)).
- McCook County population projected at +7% by 2050 — modest demand growth; plan on rents tracking national, not racing it.
- At projected returns (9.5% appreciation + 3.0% rent growth), your $29k cash investment doubles in ~3 years — after that, you're playing with house money.
- By year 4, paydown + projected appreciation supports a ~$38k cash-out refi (75% LTV) — recoverable capital for the next deal without selling this one.
Negotiation context
- It's been on market 20 days — a 2% lower offer ($103k) is reasonable based on typical stale-listing flexibility.
- 2 sale attempts since 2y ago; this cycle's ask has dropped $10k (9%) from the opening price — seller is motivated, your offer sets the floor, not the list.
Risks & watch-outs
- Watch-outs: built in 1900 — expect roof / HVAC / electrical / plumbing capex.
Questions for the listing agent
- Built in 1900 — when were the roof, HVAC, electrical panel, plumbing, and water heater last replaced?
- Is there a deadline driving the sale (1031 exchange, divorce, estate, relocation)? That informs how much negotiation room exists.
- Schools are B-rated — typically a magnet for longer-tenancy family renters. What's the average tenant stay here, and is there a school-zone premium baked into asking?
- Crime grade is D in this area — have there been break-ins, vandalism, or insurance claims at this property in the last 3 years? What carrier currently insures it and at what premium?
- What's the average days-on-market for RENTAL listings here right now (not sales)? A rising rental-DOM trend means longer vacancies and softer asking-rent achievability than the comps imply.
- What's the recent tenant-quality profile in this submarket — average credit score on applications, eviction rate, late-payment / NSF rate, and stable-employment percentage? A property-management company in the area should have these aggregated.
- How much new for-sale + rental construction is in the pipeline within 1–3 miles? Heavy new supply typically softens prices + rents 12–24 months out; constrained supply supports both.
Investment metrics
- 1% rule
- 1.04% ✓
- Cap rate
- 8.68%
- Cash-on-cash
- 8.51%
- DSCR
- 1.38
- GRM
- 8.0
CMA / ARV
No comps found within radius.
Projected returns pro-forma
9.54% appreciation · 3.0% rent growth · sell at horizon
- IRR
- 29.6%
- Equity multiple
- 3.28×
- Total profit
- $67,178
- Equity at exit
- $91,118
- IRR
- 25.8%
- Equity multiple
- 7.34×
- Total profit
- $186,535
- Equity at exit
- $192,915
Cash invested: $29,400 (down + closing). Projections, not guarantees.
Landlord ↔ Tenant lean methodology
- Overall (STATE)
- 83 Strongly Landlord-Friendly
- State South Dakota
- 83 Strongly Landlord-Friendly · R+16
- County
- — inherits STATE
- City
- — inherits STATE
ZIP-level market 57012
- Home prices YoY
- 3.2%
- Active inventory
- 17
- Price-to-rent
- 8.0×
Monthly cashflow live
- Estimated rent
- $1,094 medium interval (Pro) →
- Mortgage (P&I)
- −$551
- Tax from tax record
- −$62 /mo · $740/yr
- Insurance
- −$44
- HOA
- −$0
- Vacancy / Maint / Mgmt
- −$230
- Net cashflow
- $209
Break-even live
UW: 25.0% down · 7.5% · 30yr · 1.5% tax · 5.0% vac · 8.0% maint · 8.0% mgmt
Financing live
Cash to close
- Down payment
- $26,250
- Closing costs
- $3,150
- Reserves months
- —
- Total cash needed
- —
Loan-product check · same deal, 3 products live
Conventional
25% down · 7.5% · 30yr
- Down + closing
- —
- Monthly P&I
- —
- Monthly cashflow
- —
- DSCR
- —
- Eligible?
- —
Personal DTI + credit; lowest rate.
DSCR
20% down · 8.5% · 30yr
- Down + closing
- —
- Monthly P&I
- —
- Monthly cashflow
- —
- DSCR
- —
- Eligible?
- —
No personal income docs; deal must DSCR.
Hard money
10% down · 12.0% · 12mo
- Down + closing
- —
- Monthly P&I
- —
- Monthly cashflow
- —
- DSCR
- —
- Eligible?
- —
Short-term bridge; refi at stabilization.
Listing history 18 events
-
2026-06-18days on market $105,000 Active 20 DOM
-
2026-06-17days on market $105,000 Active 19 DOM
-
2026-06-16days on market $105,000 Active 18 DOM
-
2026-06-15days on market $105,000 Active 17 DOM
-
2026-06-13pricedays on market $105,000 Active 15 DOM
-
2026-06-12days on market $115,000 Active 14 DOM
-
2026-06-09days on market $115,000 Active 11 DOM
-
2026-06-08days on market $115,000 Active 10 DOM
-
2026-06-08days on market $115,000 Active 9 DOM
-
2026-06-05days on market $115,000 Active 7 DOM
-
2026-06-04days on market $115,000 Active 5 DOM
-
2026-06-02days on market $115,000 Active 4 DOM
-
2026-06-01days on market $115,000 Active 3 DOM
-
2026-05-31days on market $115,000 Active 2 DOM
-
2026-05-29$115,000 Active
-
2024-09-05historical
-
2024-07-15historical Active - Contingent Misc
-
2024-07-11$109,900 Active - New
ⓘ Source: listings_history table (triggers on properties + properties_extension) + one-shot
backfill from property_details.listing_events for pre-trigger history.
Tax reassessment forecast SD · Resets to sale price
- Current annual tax
- $740 · $62/mo
- Projected year-2 tax
- $1,376 · $115/mo
- Expected delta
- +$636/yr (+$53/mo · 85.9%)
ⓘ Screening estimate from a state-policy table — verify with the county assessor before closing.
Climate risk First Street
- Flood 1/10 Low FEMA zone X (unshaded) · 0% chance over 30 yrs
- Wildfire 2/10 Low
- Heat 2/10 Low 7 d/yr ≥99°F today · 14 d/yr by 30 yrs out
- Wind 2/10 Low
- Air quality 2/10 Low 1 unhealthy d/yr today · 1 by 30 yrs out
Nearby sold comps map
Loading sold comps map…
Walkable amenities ~0.75 mi
Loading nearby amenities…
Taxation est. · year 1
- Rental income
- $13,134
- − Mortgage interest
- −$5,882
- − Property taxes
- −$740
- − Insurance
- −$525
- − Repairs & maintenance
- −$1,051
- − Management
- −$1,051
- − Depreciation
- −$3,055
- Taxable income
- $831
- Est. tax owed @ 24.0%
- −$199
- After-tax cash flow
- $2,304/yr
For passive investors: Depreciation is non-cash, so a rental often shows a tax loss while cash-flowing — sheltering income. Rental losses are passive: they offset passive income freely, and up to $25,000/yr can offset ordinary (W-2) income if you actively participate and your MAGI is under $100k (phasing out to $0 by $150k); unused losses carry forward. On sale, claimed depreciation is recaptured at up to 25%, and gains may owe capital-gains tax (a 1031 exchange can defer both). Figures are a year-1 estimate at your 24.0% rate — not tax advice; consult a CPA.
Schools (NCES district)
- District
- Canistota School District 43-1
- NCES district ID
- 4610320
- Math proficiency
- 65% ▲ 5.00%
- Reading proficiency
- 70% ▼ -10.00%
- Median HH income
- $53,811
- Composite
- 58.95/100
- National rank
- #1971
- State rank
- #7 of 148 in SD
Livability — Canistota
- Score
- 66/100
- State rank
- #126
- US rank
- #11934
Category grades
Schools grade is shown separately in the Schools card above.
Census & demographics
- Population (ZIP)
- 1,164
Population outlook (McCook County) Hauer SSP2
- Today (2025)
- 5,591 people
- By 2030
- 5,617 · +0.5%
- By 2040
- 5,771 · +3.2%
- By 2050
- 5,996 · +7.2%
- By 2075
- 7,870 · +40.8%
- By 2100
- 11,517 · +106.0%
Race, ethnicity, and origin ACS 2023
- Neighborhood character
- Predominantly White (88%)
- Race & ethnicity
- White 88% Two or more races 6% Hispanic / Latino 5% Black 1%
- Common ancestry
- Iranian 8% Portuguese 7% Serbian 3%
- Foreign-born
- 1%
- Languages at home
- 98% English-only · Spanish 2%
Political lean MEDSL · McCook
- 2024 margin
- Solid R (+49.3) · D 24.2% · R 73.5% · Other 2.3%
- 2008→2024 swing
- -34.8pp toward R · 2008: -14.5pp · 2024: -49.3pp
- All cycles
- 2024: R+49.3 2020: R+44.8 2016: R+45.3 2012: R+28.7 2008: R+14.5
Not yet ingested
- Civics
- —
Market trends
- HPI YoY
- ▲ 9.54%
- Current HPI
- 308.734
- Rent YoY
- —
- Metro
- —
- State GDP YoY
- ▲ 0.70%
- F500 in state
- 2
Industry mix (Fortune 500 HQ in SD)
| Industry | F500 HQs | Revenue |
|---|---|---|
| Utilities | 1 | $1B |
|
||
Price history
+4.6% since first listed4 events — show timeline
- 2026-05-29 Listed $115,000 REALTOR® Association of the Sioux Empire
- 2024-09-05 Listing Removed — REALTOR® Association of the Sioux Empire
- 2024-07-15 Contingent — REALTOR® Association of the Sioux Empire
- 2024-07-11 Listed $109,900 REALTOR® Association of the Sioux Empire
Property tax history
+3.8%/yrLatest (2025): $740 · -8.7% YoY. Source: county tax records.
Cash-flow waterfall
monthlySold comps — $/sqft
last 12 mo · ≤1 miLoading sold comps…