Summer St · El Dorado Springs, MO
Flood risk No data
- FEMA flood zone
- —
- Chance of flooding over 30 yrs
- —
- Est. flood insurance / yr
- —
Fire risk No data
- Est. fire insurance / yr
- —
Heat risk No data
- Hot days now (above threshold)
- —
- Hot days in 30 yrs
- —
Wind risk No data
- Chance of severe wind over 30 yrs
- —
Air-quality risk No data
- Unhealthy air days now
- —
- Unhealthy air days in 30 yrs
- —
Risk factors via First Street. Map © Google.
Why this score? — see what drove the C- grade
The composite is a weighted blend of 9 inputs, each scored 0–100. Each bar is that input's sub-score; the figure is the points it added to the 100-point composite (weight × sub-score).
- Cash flow +15.0/30.0
- Appreciation +10.0/10.0
- ARV discount +7.5/15.0
- 1% rule +5.0/10.0
- DSCR +5.0/10.0
- Livability +3.1/5.0
- Rent growth +2.5/5.0
- Condition / age +2.5/5.0
- Schools +2.4/10.0
$29,000
🖨 Deal sheet (PDF) 📄 Offer letter ✓ Due diligence
Listing remarks
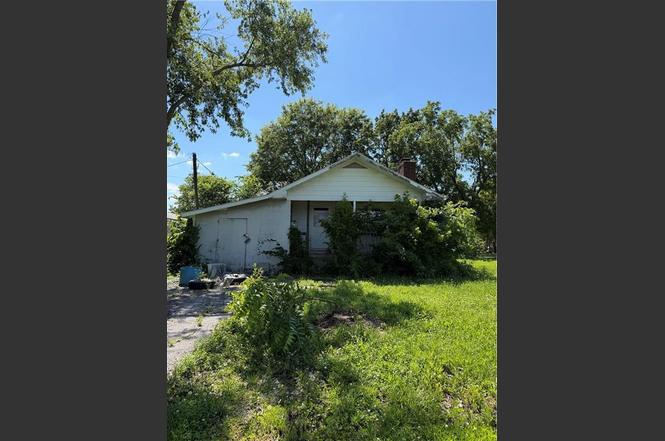
Investment Property on a corner lot! This former 3-bedroom, 1 bath home with a partial basement is in need of extensive repairs and renovation. The property is currently non habitable and is being sold as-is. Ideal for investors, contractors, or buyers seeking a redevelopment opportunity, With a corner lot location and utilities available, this property offers potential for renovation or new construction. Bring your vision and transform this property into something new.
Key facts
- Utilities available
- Partial basement
- Corner lot
Tags
Property features AI
Finance
- Other: Living area reported as 1,100 (above grade); Above- and below-grade finished area sources: Other
- Financial info: Tax annual amount reported
- HOA & community: No association fees; No community maintenance provided
Exterior
- Parking: Other parking
- Utilities: Public water; Public sewer
- Home design: Residential single-family home; Single-story (information not specifically stated)
- Construction: Shingle roof; Construction materials: Other; Home age: 51–75 years
- Exterior features: Lot approximately 0.3 acres; Flood plain status: Unknown
Interior
- Bedrooms: 3 bedrooms
- Bathrooms: 1 full bathroom
- Heating & cooling: Other heating; Other cooling
- Interior features: Partial basement
Neighborhood map
What this means for you Summary
Snapshot
- This is a 3-bed/1.0-bath land listed at $29k.
Deal economics
- At list price, monthly cash flow is $945 ($11k/yr) — positive.
- The deal already cash-flows at list — no discount required.
- Meets the 1% rule at list price ($1k rent vs $29k).
- Cap rate 45.4% vs local median 4.9% in El Dorado Springs — top-decile yield for the area; either an underpriced asset or a hidden risk that comps aren't pricing in. Stress-test before assuming the spread holds.
Location & tenants
- Location reads 62/100 on livability (#370 in MO) — a middle-class / working-renter tenant base. Strengths: cost of living A+, housing A+, health & safety A+; Watch: amenities F, commute F, employment F.
- El Dorado Springs R-II (town): math 25% / reading 34% proficiency, ranked #279 of 324 in MO (top 86%) — low school quality limits family demand, transient renter base, plan for 1-2y turnover.
- Zoned schools: El Dorado Springs Elem. (math 26% / reading 34%, grade F, #808 of 1,115 statewide, top 73%, 580 students, 100% FRL); El Dorado Springs Middle (math 28% / reading 31%, grade F, #291 of 391 statewide, top 76%, 244 students, 51% FRL); El Dorado Springs High (math 12% / reading 47%, grade F, #382 of 521 statewide, top 78%, 348 students, 40% FRL).
- Market conditions: 84 active listings in the ZIP; 1 comparable units currently listed for rent nearby; 4 units permitted in Cedar County in 2024 (0 in 5+ unit buildings).
Forward outlook
- In year one you build about $3k of equity ($200 loan paydown + $3k appreciation (10.0% local appreciation)).
- Cedar County population projected at -12% by 2050 — secular population decline; favor cash flow + early exit over multi-decade hold.
- At projected returns (10.0% appreciation + 3.0% rent growth), your $8k cash investment doubles in ~1 year — after that, you're playing with house money.
- By year 9, paydown + projected appreciation supports a ~$32k cash-out refi (75% LTV) — recoverable capital for the next deal without selling this one.
Negotiation context
- Only 7 days on market — expect competitive offers; lowballing is unlikely to land.
- 2 sale attempts since 9y ago with the ask held roughly flat each time — persistent listings suggest the price (not the market) is what's stuck; bring a comps-based counter.
Questions for the listing agent
- Is there a deadline driving the sale (1031 exchange, divorce, estate, relocation)? That informs how much negotiation room exists.
- Schools are D-rated, which usually means shorter tenancies and higher turnover. Who's the typical renter profile here, and what's been the actual vacancy rate?
- What's the average days-on-market for RENTAL listings here right now (not sales)? A rising rental-DOM trend means longer vacancies and softer asking-rent achievability than the comps imply.
- What's the recent tenant-quality profile in this submarket — average credit score on applications, eviction rate, late-payment / NSF rate, and stable-employment percentage? A property-management company in the area should have these aggregated.
- How much new for-sale + rental construction is in the pipeline within 1–3 miles? Heavy new supply typically softens prices + rents 12–24 months out; constrained supply supports both.
Investment metrics
- 1% rule
- 5.00% ✓
- Cap rate
- 45.40%
- Cash-on-cash
- 139.67%
- DSCR
- 7.21
- GRM
- 1.7
CMA / ARV
No comps found within radius.
Projected returns pro-forma
10.0% appreciation · 3.0% rent growth · sell at horizon
- IRR
- —
- Equity multiple
- 10.36×
- Total profit
- $76,009
- Equity at exit
- $26,125
- IRR
- —
- Equity multiple
- 22.74×
- Total profit
- $176,543
- Equity at exit
- $56,341
Cash invested: $8,120 (down + closing). Projections, not guarantees.
Landlord ↔ Tenant lean methodology
- Overall (STATE)
- 81 Strongly Landlord-Friendly
- State Missouri
- 81 Strongly Landlord-Friendly · R+10
- County
- — inherits STATE
- City
- — inherits STATE
ZIP-level market 64744
- Home prices YoY
- 5.2%
- Active inventory
- 84
- Price-to-rent
- 1.7×
Monthly cashflow live
- Estimated rent
- $1,450 medium interval (Pro) →
- Mortgage (P&I)
- −$152
- Tax est. 1.5%
- −$36 /mo · $435/yr
- Insurance
- −$12
- HOA
- −$0
- Vacancy / Maint / Mgmt
- −$304
- Net cashflow
- $945
Break-even live
Sensitivity live
| Price | -10% $965 | -5% $955 | +0% $945 | +5% $935 | +10% $925 |
|---|---|---|---|---|---|
| Rent | -10% $831 | -5% $888 | +0% $945 | +5% $1,002 | +10% $1,060 |
| Rate | -1.0pp $960 | -0.5pp $952 | base $945 | +0.5pp $938 | +1.0pp $930 |
UW: 25.0% down · 7.5% · 30yr · 1.5% tax · 5.0% vac · 8.0% maint · 8.0% mgmt
Financing live
Cash to close
- Down payment
- $7,250
- Closing costs
- $870
- Reserves months
- —
- Total cash needed
- —
Loan-product check · same deal, 3 products live
Conventional
25% down · 7.5% · 30yr
- Down + closing
- —
- Monthly P&I
- —
- Monthly cashflow
- —
- DSCR
- —
- Eligible?
- —
Personal DTI + credit; lowest rate.
DSCR
20% down · 8.5% · 30yr
- Down + closing
- —
- Monthly P&I
- —
- Monthly cashflow
- —
- DSCR
- —
- Eligible?
- —
No personal income docs; deal must DSCR.
Hard money
10% down · 12.0% · 12mo
- Down + closing
- —
- Monthly P&I
- —
- Monthly cashflow
- —
- DSCR
- —
- Eligible?
- —
Short-term bridge; refi at stabilization.
Rent comps 1 comps
| Address | Beds | Baths | Sqft | Rent | $/sqft | DOM | Units | Dist |
|---|---|---|---|---|---|---|---|---|
| 410 S Ohio St El Dorado Springs, MO | 3.0 | 2.0 | 1020 | $1,450 | $1.42 | 45d | 1 | 0.26mi |
Listing history 7 events
-
2026-06-21days on market $29,000 Active 7 DOM
-
2026-06-21days on market $29,000 Active 6 DOM
-
2026-06-18days on market $29,000 Active 4 DOM
-
2026-06-17days on market $29,000 Active 3 DOM
-
2026-06-16days on market $29,000 Active 2 DOM
-
2026-06-15remarks 474-char remark
-
2026-06-15$29,000 Active 1 DOM
ⓘ Source: listings_history table (triggers on properties + properties_extension) + one-shot
backfill from property_details.listing_events for pre-trigger history.
Nearby sold comps map
Loading sold comps map…
Walkable amenities ~0.75 mi
Loading nearby amenities…
Taxation est. · year 1
- Rental income
- $17,400
- − Mortgage interest
- −$1,624
- − Property taxes
- −$435
- − Insurance
- −$145
- − Repairs & maintenance
- −$1,392
- − Management
- −$1,392
- − Depreciation
- −$844
- Taxable income
- $11,568
- Est. tax owed @ 24.0%
- −$2,776
- After-tax cash flow
- $8,565/yr
For passive investors: Depreciation is non-cash, so a rental often shows a tax loss while cash-flowing — sheltering income. Rental losses are passive: they offset passive income freely, and up to $25,000/yr can offset ordinary (W-2) income if you actively participate and your MAGI is under $100k (phasing out to $0 by $150k); unused losses carry forward. On sale, claimed depreciation is recaptured at up to 25%, and gains may owe capital-gains tax (a 1031 exchange can defer both). Figures are a year-1 estimate at your 24.0% rate — not tax advice; consult a CPA.
Schools (NCES district)
- District
- El Dorado Springs R-II
- NCES district ID
- 2911310
- Math proficiency
- 25% ▼ -5.00%
- Reading proficiency
- 34% ▼ -5.00%
- Median HH income
- $31,880
- Composite
- 24.02/100
- National rank
- #7772
- State rank
- #279 of 324 in MO
Livability — El Dorado Springs
- Score
- 62/100
- State rank
- #370
- US rank
- #16324
Category grades
Schools grade is shown separately in the Schools card above.
Census & demographics
- Census place
- El Dorado Springs, MO
- Population (ZIP)
- 8,547
Population outlook (Cedar County) Hauer SSP2
- Today (2025)
- 13,424 people
- By 2030
- 13,080 · -2.6%
- By 2040
- 12,434 · -7.4%
- By 2050
- 11,841 · -11.8%
- By 2075
- 10,171 · -24.2%
- By 2100
- 7,744 · -42.3%
Race, ethnicity, and origin ACS 2023
- Neighborhood character
- Predominantly White (95%)
- Race & ethnicity
- White 95% Two or more races 4%
- Common ancestry
- Italian 6% Iranian 3% Romanian 3%
- Foreign-born
- 1% · Canada
- Languages at home
- 94% English-only · German/W. Germanic 5% Spanish 1%
Political lean MEDSL · Cedar
- 2024 margin
- Solid R (+69.6) · D 14.8% · R 84.4%
- 2008→2024 swing
- -36.0pp toward R · 2008: -33.6pp · 2024: -69.6pp
- All cycles
- 2024: R+69.6 2020: R+65.9 2016: R+63.9 2012: R+47.0 2008: R+33.6
Not yet ingested
- Civics
- —
Market trends
- HPI YoY
- ▲ 11.88%
- Current HPI
- 242.0421
- Rent YoY
- —
- Metro
- —
- State GDP YoY
- ▲ 1.84%
- F500 in state
- 20
Industry mix (Fortune 500 HQ in MO)
| Industry | F500 HQs | Revenue |
|---|---|---|
| Healthcare | 1 | $163B |
|
||
| Insurance | 1 | $21B |
|
||
| Industrial Technology | 1 | $17B |
|
||
| Retail | 1 | $16B |
|
||
| Industrial Distribution | 1 | $10B |
|
||
| Utilities | 1 | $9B |
|
||
Price history
+866.7% since first listed3 events — show timeline
- 2026-06-14 Listed $29,000 Heartland MLS as Distributed by MLS Grid
- 2017-09-26 Sold (MLS) — SOMO
- 2017-04-28 Listed $3,000 SOMO
Cash-flow waterfall
monthlySold comps — $/sqft
last 12 mo · ≤1 miLoading sold comps…