2067 New Lake Rd · South Jacksonville, IL
Flood risk 1/10 · Minimal
- FEMA flood zone
- X (unshaded)
- Chance of flooding over 30 yrs
- 0.0%
- Est. flood insurance / yr
- $473 – $860
Fire risk 1/10 · Minimal
- Est. fire insurance / yr
- $804 – $1,492
Heat risk 4/10 · Minor
- Hot days now (above 105°F)
- 7 days/yr
- Hot days in 30 yrs
- 19 days/yr
Wind risk 2/10 · Minimal
- Chance of severe wind over 30 yrs
- 2.0%
Air-quality risk 2/10 · Minimal
- Unhealthy air days now
- 1 days/yr
- Unhealthy air days in 30 yrs
- 2 days/yr
Risk factors via First Street. Map © Google.
Why this score? — see what drove the B- grade
The composite is a weighted blend of 9 inputs, each scored 0–100. Each bar is that input's sub-score; the figure is the points it added to the 100-point composite (weight × sub-score).
- Cash flow +28.8/30.0
- 1% rule +10.0/10.0
- DSCR +10.0/10.0
- ARV discount +7.5/15.0
- Livability +3.6/5.0
- Rent growth +2.5/5.0
- Condition / age +2.5/5.0
- Schools +1.9/10.0
- Appreciation +0.0/10.0
$75,000
🖨 Deal sheet (PDF) 📄 Offer letter ✓ Due diligence
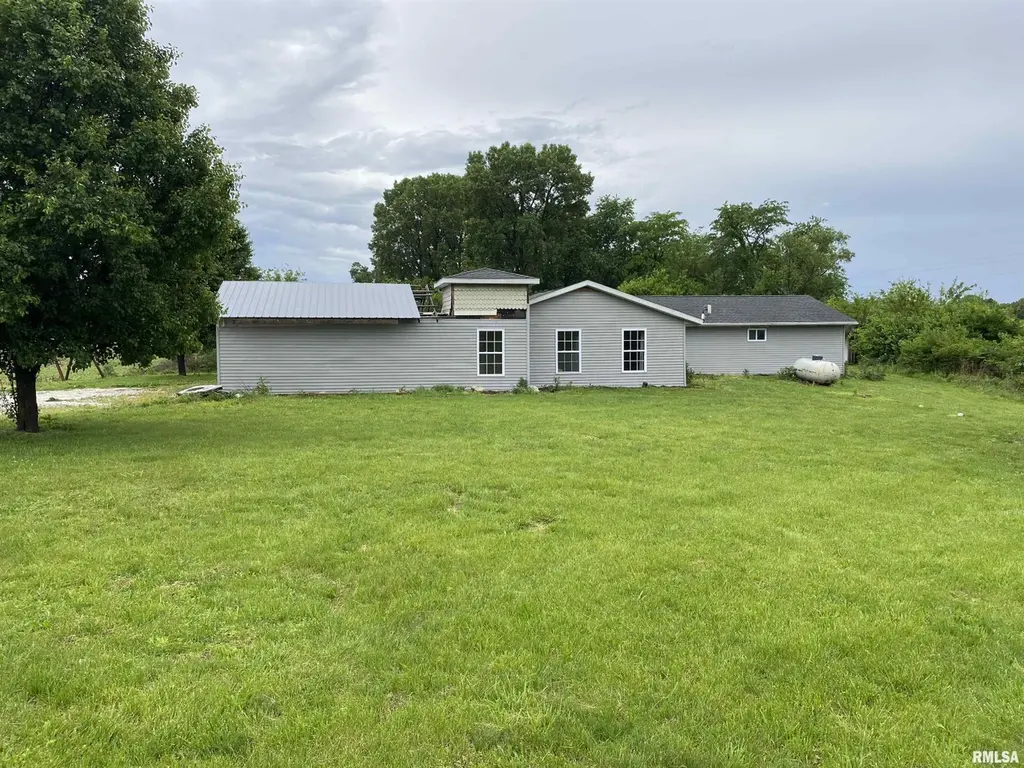
Listing remarks MLS
Looking to stay within 3 miles of Jacksonville and have a few acres to enjoy? This may be the property for you, 2 bedroom, 2 bath, open floor plan with kitchen and living room, nice big yard shed and a gazebo. This property even has a pond! All this and close to town, great County Road District roads and close to Lake Jacksonville! What more could you ask for?
Key facts
- Weekend getaway
- Customize interior
- Personal retreat
Tags
Property features AI
Exterior
- Parking: Attached 2-car garage
- Utilities: Septic system
- Home design: Single-family residence; Built in 2008
- Construction: Shingle roof
- Exterior features: Property includes a pond/lake; 3-acre lot
Interior
- Kitchen: Kitchen on main level
- Bedrooms: Two bedrooms (both on the main level)
- Flooring: Luxury vinyl plank flooring in bedrooms and kitchen
- Bathrooms: Two full bathrooms
- Interior features: No basement; No fireplaces
Neighborhood map
What this means for you Summary
Snapshot
- This is a 2-bed/2.0-bath single-family listed at $75k.
Deal economics
- At list price, monthly cash flow is $253 ($3k/yr) — positive.
- The deal already cash-flows at list — no discount required.
- Meets the 1% rule at list price ($1k rent vs $75k).
Location & tenants
- Location reads 71/100 on livability (#331 in IL) — a middle-class / working-renter tenant base. Strengths: cost of living A+, housing A+, crime A; Watch: schools F, amenities F, commute F.
- Jacksonville SD 117 (town): math 20% / reading 23% proficiency, ranked #407 of 620 in IL (top 66%) — low school quality limits family demand, transient renter base, plan for 1-2y turnover.
- Market conditions: 143 active listings in the ZIP; 3 units permitted in Morgan County in 2024 (0 in 5+ unit buildings).
Forward outlook
- Local home prices are declining (-3.0%/yr); year-one equity from $519 of loan paydown is wiped out by about $2k of value loss. Plan a longer hold.
- Morgan County population projected at -20% by 2050 — secular population decline; favor cash flow + early exit over multi-decade hold.
- At projected returns (-3.0% appreciation + 3.0% rent growth), your $21k cash investment doubles in ~9 years — after that, you're playing with house money.
Negotiation context
- Only 2 days on market — expect competitive offers; lowballing is unlikely to land.
- 3 sale attempts since 18y ago with the ask held roughly flat each time — persistent listings suggest the price (not the market) is what's stuck; bring a comps-based counter.
- Current owner paid $65k; 15% above their basis — modest negotiation headroom, anchor on the comps not their cost.
Risks & watch-outs
- Watch-outs: property tax is 4.0% of price.
Questions for the listing agent
- Property tax is high relative to price — has the assessment been appealed recently, and will the sale trigger a re-assessment?
- Is there a deadline driving the sale (1031 exchange, divorce, estate, relocation)? That informs how much negotiation room exists.
- Schools are F-rated, which usually means shorter tenancies and higher turnover. Who's the typical renter profile here, and what's been the actual vacancy rate?
- What's the average days-on-market for RENTAL listings here right now (not sales)? A rising rental-DOM trend means longer vacancies and softer asking-rent achievability than the comps imply.
- What's the recent tenant-quality profile in this submarket — average credit score on applications, eviction rate, late-payment / NSF rate, and stable-employment percentage? A property-management company in the area should have these aggregated.
- How much new for-sale + rental construction is in the pipeline within 1–3 miles? Heavy new supply typically softens prices + rents 12–24 months out; constrained supply supports both.
Investment metrics
- 1% rule
- 1.57% ✓
- Cap rate
- 10.34%
- Cash-on-cash
- 14.45%
- DSCR
- 1.64
- GRM
- 5.3
CMA / ARV
- ARV (on-the-fly)
- $330,720
- Comps found
- 1
Show comp detail 1 sale within ~0.75 mi
| Address | Dist | Beds/Ba | Sqft | Sold | Price | $/sf | Match |
|---|---|---|---|---|---|---|---|
| 403 Timbercreek Dr | 0.69mi | 3/2.5 (+1) | 2,073 (-0%) | 10mo | $330,000 | $159 | 52 |
Match score weights: distance 35% · size 25% · config 20% · recency 20%. Top-matched comps best support the ARV.
Projected returns pro-forma
-3.0% appreciation · 3.0% rent growth · sell at horizon
- IRR
- 5.0%
- Equity multiple
- 1.19×
- Total profit
- $4,072
- Equity at exit
- $11,183
- IRR
- 14.5%
- Equity multiple
- 2.18×
- Total profit
- $24,758
- Equity at exit
- $6,485
Cash invested: $21,000 (down + closing). Projections, not guarantees.
Landlord ↔ Tenant lean methodology
- Overall (STATE)
- 43 Moderately Tenant-Leaning
- State Illinois
- 43 Moderately Tenant-Leaning · D+7
- County
- — inherits STATE
- City
- — inherits STATE
ZIP-level market 62650
- Active inventory
- 143
- Price-to-rent
- 5.3×
Monthly cashflow live
- Estimated rent
- $1,178 medium interval (Pro) →
- Mortgage (P&I)
- −$393
- Tax from tax record
- −$253 /mo · $3,034/yr
- Insurance
- −$31
- HOA
- −$0
- Vacancy / Maint / Mgmt
- −$247
- Net cashflow
- $253
Break-even live
Sensitivity live
| Price | -10% $295 | -5% $274 | +0% $253 | +5% $232 | +10% $210 |
|---|---|---|---|---|---|
| Rent | -10% $160 | -5% $206 | +0% $253 | +5% $299 | +10% $346 |
| Rate | -1.0pp $291 | -0.5pp $272 | base $253 | +0.5pp $233 | +1.0pp $214 |
UW: 25.0% down · 7.5% · 30yr · 1.5% tax · 5.0% vac · 8.0% maint · 8.0% mgmt
Financing live
Cash to close
- Down payment
- $18,750
- Closing costs
- $2,250
- Reserves months
- —
- Total cash needed
- —
Loan-product check · same deal, 3 products live
Conventional
25% down · 7.5% · 30yr
- Down + closing
- —
- Monthly P&I
- —
- Monthly cashflow
- —
- DSCR
- —
- Eligible?
- —
Personal DTI + credit; lowest rate.
DSCR
20% down · 8.5% · 30yr
- Down + closing
- —
- Monthly P&I
- —
- Monthly cashflow
- —
- DSCR
- —
- Eligible?
- —
No personal income docs; deal must DSCR.
Hard money
10% down · 12.0% · 12mo
- Down + closing
- —
- Monthly P&I
- —
- Monthly cashflow
- —
- DSCR
- —
- Eligible?
- —
Short-term bridge; refi at stabilization.
Listing history 9 events
-
2026-05-21status Pending
-
2026-05-19$75,000 Active
-
2021-08-06historical
-
2017-03-30soldstatus $65,000 362-char remark
Show marketing remark (362 chars)
Looking to stay within 3 miles of Jacksonville and have a few acres to enjoy? This may be the property for you, 2 bedroom, 2 bath, open floor plan with kitchen and living room, nice big yard shed and a gazebo. This property even has a pond! All this and close to town, great County Road District roads and close to Lake Jacksonville! What more could you ask for?
-
2016-10-03$77,760 362-char remark
Show marketing remark (362 chars)
Looking to stay within 3 miles of Jacksonville and have a few acres to enjoy? This may be the property for you, 2 bedroom, 2 bath, open floor plan with kitchen and living room, nice big yard shed and a gazebo. This property even has a pond! All this and close to town, great County Road District roads and close to Lake Jacksonville! What more could you ask for?
-
2009-05-14soldstatus $110,000
-
2009-04-20soldstatus $110,000
-
2008-08-14$119,900
-
2007-01-05soldstatus $35,000
ⓘ Source: listings_history table (triggers on properties + properties_extension) + one-shot
backfill from property_details.listing_events for pre-trigger history.
Tax reassessment forecast IL · Partial reset (capped growth)
- Current annual tax
- $3,034 · $253/mo
- Projected year-2 tax
- $3,034 · $253/mo
- Expected delta
- $0/yr ($0/mo · 0.0%)
ⓘ Screening estimate from a state-policy table — verify with the county assessor before closing.
Climate risk First Street
- Flood 1/10 Low FEMA zone X (unshaded) · 0% chance over 30 yrs
- Wildfire 1/10 Low
- Heat 4/10 Moderate 7 d/yr ≥105°F today · 19 d/yr by 30 yrs out
- Wind 2/10 Low 2% chance of damaging wind over 30 yrs
- Air quality 2/10 Low 1 unhealthy d/yr today · 2 by 30 yrs out
Nearby sold comps map
Loading sold comps map…
Walkable amenities ~0.75 mi
Loading nearby amenities…
Taxation est. · year 1
- Rental income
- $14,132
- − Mortgage interest
- −$4,201
- − Property taxes
- −$3,034
- − Insurance
- −$375
- − Repairs & maintenance
- −$1,131
- − Management
- −$1,131
- − Depreciation
- −$2,182
- Taxable income
- $2,078
- Est. tax owed @ 24.0%
- −$499
- After-tax cash flow
- $2,536/yr
For passive investors: Depreciation is non-cash, so a rental often shows a tax loss while cash-flowing — sheltering income. Rental losses are passive: they offset passive income freely, and up to $25,000/yr can offset ordinary (W-2) income if you actively participate and your MAGI is under $100k (phasing out to $0 by $150k); unused losses carry forward. On sale, claimed depreciation is recaptured at up to 25%, and gains may owe capital-gains tax (a 1031 exchange can defer both). Figures are a year-1 estimate at your 24.0% rate — not tax advice; consult a CPA.
Schools (NCES district)
- District
- Jacksonville SD 117
- NCES district ID
- 1720280
- Math proficiency
- 20% ▼ -3.00%
- Reading proficiency
- 23% ▼ -6.00%
- Median HH income
- $44,909
- Composite
- 18.66/100
- National rank
- #8888
- State rank
- #407 of 620 in IL
Livability — South Jacksonville
- Score
- 71/100
- State rank
- #331
- US rank
- #6557
Category grades
Schools grade is shown separately in the Schools card above.
Census & demographics
- Population (ZIP)
- 24,318
Population outlook (Morgan County) Hauer SSP2
- Today (2025)
- 32,874 people
- By 2030
- 31,698 · -3.6%
- By 2040
- 29,050 · -11.6%
- By 2050
- 26,381 · -19.8%
- By 2075
- 20,235 · -38.4%
- By 2100
- 14,324 · -56.4%
Race, ethnicity, and origin ACS 2023
- Neighborhood character
- Predominantly White (85%)
- Race & ethnicity
- White 85% Black 7% Two or more races 5% Hispanic / Latino 3%
- Common ancestry
- Lithuanian 2% Slovak 1% Iranian 1%
- Foreign-born
- 1% · Canada, South Korea
- Languages at home
- 97% English-only · Spanish 2%
Political lean MEDSL · Morgan
- 2024 margin
- Solid R (+32.5) · D 33.1% · R 65.6% · Other 1.3%
- 2008→2024 swing
- -31.7pp toward R · 2008: -0.8pp · 2024: -32.5pp
- All cycles
- 2024: R+32.5 2020: R+31.8 2016: R+29.9 2012: R+15.4 2008: R+0.8
Not yet ingested
- Civics
- —
Market trends
- HPI YoY
- ▼ -84.33%
- Current HPI
- 126.5712
- Rent YoY
- —
- Metro
- —
- State GDP YoY
- ▲ 1.59%
- F500 in state
- 60
Industry mix (Fortune 500 HQ in IL)
| Industry | F500 HQs | Revenue |
|---|---|---|
| Insurance | 4 | $201B |
|
||
| Consumer Goods | 4 | $87B |
|
||
| Industrial Machinery | 3 | $64B |
|
||
| Healthcare | 2 | $55B |
|
||
| Retail / Pharmacy | 1 | $148B |
|
||
| Agriculture / Food | 1 | $86B |
|
||
Price history
+114.3% since first listed9 events — show timeline
- 2026-05-21 Pending — RMLSA as Distributed by MLS Grid
- 2026-05-19 Listed $75,000 RMLSA as Distributed by MLS Grid
- 2021-08-06 Listing Removed — RMLSA as Distributed by MLS Grid
- 2017-03-30 Sold (MLS) $65,000 RMLSA as Distributed by MLS Grid
- 2016-10-03 Listed $77,760 RMLSA as Distributed by MLS Grid
- 2009-05-14 Sold (Public Records) $110,000 Public Records
- 2009-04-20 Sold (MLS) $110,000 RMLSA as Distributed by MLS Grid
- 2008-08-14 Listed $119,900 RMLSA as Distributed by MLS Grid
- 2007-01-05 Sold (Public Records) $35,000 Public Records
Property tax history
+1.8%/yrLatest (2024): $3,034 · +3.9% YoY. Source: county tax records.
Cash-flow waterfall
monthlySold comps — $/sqft
last 12 mo · ≤1 miLoading sold comps…