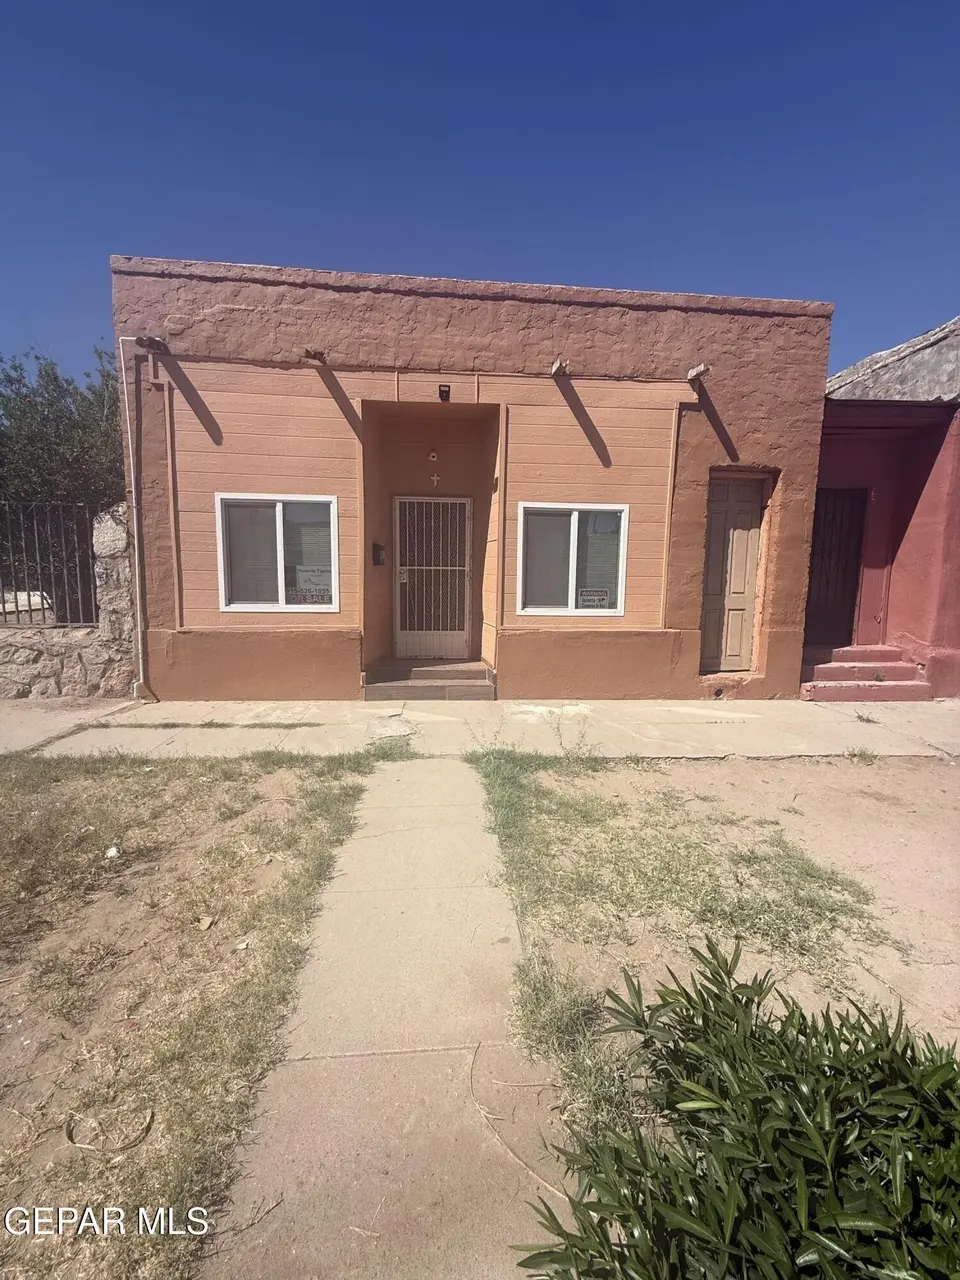
805 Tays St · El Paso, TX
Flood risk 5/10 · Moderate
- FEMA flood zone
- X
- Chance of flooding over 30 yrs
- 0.24%
- Est. flood insurance / yr
- $507 – $1,088
Fire risk 1/10 · Minimal
- Est. fire insurance / yr
- $1,222 – $2,270
Heat risk 6/10 · Moderate
- Hot days now (above 101°F)
- 7 days/yr
- Hot days in 30 yrs
- 25 days/yr
Wind risk 1/10 · Minimal
- Chance of severe wind over 30 yrs
- —
Air-quality risk 2/10 · Minimal
- Unhealthy air days now
- 1 days/yr
- Unhealthy air days in 30 yrs
- 1 days/yr
Risk factors via First Street. Map © Google.
Why this score? — see what drove the B grade
The composite is a weighted blend of 9 inputs, each scored 0–100. Each bar is that input's sub-score; the figure is the points it added to the 100-point composite (weight × sub-score).
- Cash flow +27.7/30.0
- DSCR +9.8/10.0
- 1% rule +9.2/10.0
- Appreciation +8.7/10.0
- ARV discount +7.5/15.0
- Livability +4.0/5.0
- Schools +2.7/10.0
- Rent growth +2.5/5.0
- Condition / age +2.5/5.0
$124,900
🖨 Deal sheet 📄 Offer letter ✓ Due diligence
Listing remarks MLS
Motivated seller! Step into timeless charm with this 1924 El Paso home, perfectly situated near downtown! Featuring spacious living areas, classic El Paso character, and a 3,000 sq ft lot with room to grow, this home blends historic charm with modern convenience. Modern climate control and updated electrical panel installed ensure comfort and efficiency. Enjoy breathtaking views of the Franklin Mountains, highlighted by the iconic lighted star at night. Just minutes from dining, shopping, entertainment, and major roadways, it offers unmatched accessibility. Perfect as a primary residence, investment, or renovation project, this property is full of personality and potential. Walking distance to the infamous Bowie bakery and local schools. Don't miss the chance to own a stylish, historic gem with a view in one of El Paso's most desirable locations! Sold As Is. Back Storage attached to home is not included in sq ft. of home.
Key facts
- Breathtaking views
- 3,000 sq ft lot
- Built 1924
Tags
Neighborhood map
What this means for you Summary
Snapshot
- This is a 3-bed/1.0-bath single-family listed at $125k.
Deal economics
- At list price, monthly cash flow is $379 ($5k/yr) — positive.
- The deal already cash-flows at list — no discount required.
- Meets the 1% rule at list price ($2k rent vs $125k).
- Recommended offer: $117k (6.0% below list) — sets the bar for market timing.
Location & tenants
- Location reads 81/100 on livability (#23 in TX, #1,375 nationally) — a professional / high-income tenant draw. Strengths: commute A+, cost of living A+, housing A+; Watch: employment D+.
- El Paso ISD (urban): math 27% / reading 37% proficiency, ranked #591 of 826 in TX (top 72%) — families likely to look elsewhere, expect single-tenant / working-renter base with shorter leases; 65% free/reduced lunch — lower-income household profile, screen leases tightly.
- Market conditions: 18 active listings in the ZIP; 12 comparable units currently listed for rent nearby; rentals at typical pace (median 24d on market — plan ~3-4 weeks tenant-placement turnaround); 42% of comp listings sitting > 30 days — soft ceiling on asking rent; 2,196 units permitted in El Paso County in 2024 (143 in 5+ unit buildings).
Forward outlook
- In year one you build about $10k of equity ($864 loan paydown + $9k appreciation (7.5% local appreciation)).
- El Paso County population projected at +10% by 2050 — modest demand growth; plan on rents tracking national, not racing it.
- At projected returns (7.5% appreciation + 3.0% rent growth), your $35k cash investment doubles in ~3 years — after that, you're playing with house money.
- By year 4, paydown + projected appreciation supports a ~$35k cash-out refi (75% LTV) — recoverable capital for the next deal without selling this one.
Negotiation context
- It's been on market 83 days — a 6% lower offer ($117k) is reasonable based on typical stale-listing flexibility.
Risks & watch-outs
- Watch-outs: property tax is 3.1% of price; built in 1924 — expect roof / HVAC / electrical / plumbing capex.
- Climate carrying-cost: moderate flood risk; extreme-heat days projected 7→25/yr by 2055 (HVAC capex compounding) — expect insurance premiums to compound above CPI over the hold.
Questions for the listing agent
- It's been on market 83 days. Have you received any prior offers? Is the seller open to a 6% concession, seller financing, or rate buy-down credit?
- Built in 1924 — when were the roof, HVAC, electrical panel, plumbing, and water heater last replaced?
- Property tax is high relative to price — has the assessment been appealed recently, and will the sale trigger a re-assessment?
- Why hasn't it sold? Are there any deal-killer items the seller is aware of (foundation, flood, title, zoning, code violations)?
- Is there a deadline driving the sale (1031 exchange, divorce, estate, relocation)? That informs how much negotiation room exists.
- Schools are B-rated — typically a magnet for longer-tenancy family renters. What's the average tenant stay here, and is there a school-zone premium baked into asking?
- What's the average days-on-market for RENTAL listings here right now (not sales)? A rising rental-DOM trend means longer vacancies and softer asking-rent achievability than the comps imply.
- What's the recent tenant-quality profile in this submarket — average credit score on applications, eviction rate, late-payment / NSF rate, and stable-employment percentage? A property-management company in the area should have these aggregated.
- How much new for-sale + rental construction is in the pipeline within 1–3 miles? Heavy new supply typically softens prices + rents 12–24 months out; constrained supply supports both.
Investment metrics
- 1% rule
- 1.42% ✓
- Cap rate
- 9.93%
- Cash-on-cash
- 12.99%
- DSCR
- 1.58
- GRM
- 5.9
CMA / ARV
No comps found within radius.
Projected returns pro-forma
7.49% appreciation · 3.0% rent growth · sell at horizon
- IRR
- 29.1%
- Equity multiple
- 3.05×
- Total profit
- $71,611
- Equity at exit
- $90,554
- IRR
- 26.4%
- Equity multiple
- 6.44×
- Total profit
- $190,104
- Equity at exit
- $175,763
Cash invested: $34,972 (down + closing). Projections, not guarantees.
Landlord ↔ Tenant lean methodology
- Overall (STATE)
- 87 Strongly Landlord-Friendly
- State Texas
- 87 Strongly Landlord-Friendly · R+5
- County
- — inherits STATE
- City
- — inherits STATE
ZIP-level market 79901
- Home prices YoY
- 3.6%
- Active inventory
- 18
- Price-to-rent
- 5.9×
Monthly cashflow live
- Estimated rent
- $1,778 high interval (Pro) →
- Mortgage (P&I)
- −$655
- Tax from tax record
- −$319 /mo · $3,824/yr
- Insurance
- −$52
- HOA
- −$0
- Vacancy / Maint / Mgmt
- −$373
- Net cashflow
- $379
Break-even live
UW: 25.0% down · 7.5% · 30yr · 1.5% tax · 5.0% vac · 8.0% maint · 8.0% mgmt
Financing live
Cash to close
- Down payment
- $31,225
- Closing costs
- $3,747
- Reserves months
- —
- Total cash needed
- —
Loan-product check · same deal, 3 products live
Conventional
25% down · 7.5% · 30yr
- Down + closing
- —
- Monthly P&I
- —
- Monthly cashflow
- —
- DSCR
- —
- Eligible?
- —
Personal DTI + credit; lowest rate.
DSCR
20% down · 8.5% · 30yr
- Down + closing
- —
- Monthly P&I
- —
- Monthly cashflow
- —
- DSCR
- —
- Eligible?
- —
No personal income docs; deal must DSCR.
Hard money
10% down · 12.0% · 12mo
- Down + closing
- —
- Monthly P&I
- —
- Monthly cashflow
- —
- DSCR
- —
- Eligible?
- —
Short-term bridge; refi at stabilization.
Rent comps 12 comps
| Address | Beds | Baths | Sqft | Rent | $/sqft | DOM | Units | Dist |
|---|---|---|---|---|---|---|---|---|
| 1310 E San Antonio Ave El Paso, TX | 2.0 | 1.0 | 1100 | $1,335 | $1.21 | 43d | 1 | 0.51mi |
| 921 Olive Ave El Paso, TX | 3.0 | 1.5 | 1194 | $1,300 | $1.09 | 11d | 1 | 0.52mi |
| 115 N Mesa St Unit 3B El Paso, TX | 3.0 | 2.0 | 1550 | $2,200 | $1.42 | 43d | 1 | 0.73mi |
| 505 W Missouri Ave El Paso, TX | 2.0 | 1.0 | 1100 | $950 | $0.86 | 43d | 1 | 1.13mi |
| 604 Upson Dr El Paso, TX | 3.0 | 3.0 | 1680 | $1,900 | $1.13 | 43d | 1 | 1.23mi |
| 608 Stewart Ct Unit A El Paso, TX | 2.0 | 1.0 | 1221 | $1,200 | $0.98 | 14d | 1 | 1.26mi |
| 1509 Montana Ave Unit 4 El Paso, TX | 2.0 | 1.5 | 1200 | $1,200 | $1.00 | 2d | 1 | 1.29mi |
| 1509 Montana Ave El Paso, TX | 2.0 | 1.0 | 1200 | $1,200 | $1.00 | 2d | 1 | 1.29mi |
| 1519 Golden Hill Ter Unit 5 El Paso, TX | 2.0 | 2.5 | 1550 | $2,550 | $1.65 | 23d | 1 | 1.36mi |
| 1519 Golden Hill Ter Unit 8 El Paso, TX | 2.0 | 2.5 | 1650 | $2,950 | $1.79 | 23d | 1 | 1.36mi |
| 1519 Golden Hill Ter El Paso, TX | 2.0 | 2.5 | 1600 | $2,750 | $1.72 | 43d | 6 | 1.36mi |
| 305 E River Ave El Paso, TX | 2.0 | 2.0 | 1382 | $1,750 | $1.27 | 2d | 1 | 1.45mi |
Listing history 21 events
-
2026-06-18days on market $124,900 Active 83 DOM
-
2026-06-17days on market $124,900 Active 82 DOM
-
2026-06-16days on market $124,900 Active 81 DOM
-
2026-06-15days on market $124,900 Active 80 DOM
-
2026-06-13days on market $124,900 Active 78 DOM
-
2026-06-13days on market $124,900 Active 77 DOM
-
2026-06-10days on market $124,900 Active 75 DOM
-
2026-06-09days on market $124,900 Active 74 DOM
-
2026-06-08days on market $124,900 Active 73 DOM
-
2026-06-07days on market $124,900 Active 72 DOM
-
2026-06-05days on market $124,900 Active 69 DOM
-
2026-06-03days on market $124,900 Active 68 DOM
-
2026-06-03days on market $124,900 Active 67 DOM
-
2026-06-01days on market $124,900 Active 66 DOM
-
2026-05-31days on market $124,900 Active 65 DOM
-
2026-04-15price $124,900 935-char remark
Show marketing remark (935 chars)
Motivated seller! Step into timeless charm with this 1924 El Paso home, perfectly situated near downtown! Featuring spacious living areas, classic El Paso character, and a 3,000 sq ft lot with room to grow, this home blends historic charm with modern convenience. Modern climate control and updated electrical panel installed ensure comfort and efficiency. Enjoy breathtaking views of the Franklin Mountains, highlighted by the iconic lighted star at night. Just minutes from dining, shopping, entertainment, and major roadways, it offers unmatched accessibility. Perfect as a primary residence, investment, or renovation project, this property is full of personality and potential. Walking distance to the infamous Bowie bakery and local schools. Don't miss the chance to own a stylish, historic gem with a view in one of El Paso's most desirable locations! Sold As Is. Back Storage attached to home is not included in sq ft. of home.
-
2026-03-27$134,900 Active 935-char remark
Show marketing remark (935 chars)
Motivated seller! Step into timeless charm with this 1924 El Paso home, perfectly situated near downtown! Featuring spacious living areas, classic El Paso character, and a 3,000 sq ft lot with room to grow, this home blends historic charm with modern convenience. Modern climate control and updated electrical panel installed ensure comfort and efficiency. Enjoy breathtaking views of the Franklin Mountains, highlighted by the iconic lighted star at night. Just minutes from dining, shopping, entertainment, and major roadways, it offers unmatched accessibility. Perfect as a primary residence, investment, or renovation project, this property is full of personality and potential. Walking distance to the infamous Bowie bakery and local schools. Don't miss the chance to own a stylish, historic gem with a view in one of El Paso's most desirable locations! Sold As Is. Back Storage attached to home is not included in sq ft. of home.
-
2020-01-08soldstatus
-
2008-02-04soldstatus
-
1979-08-01soldstatus
-
1979-04-04soldstatus
ⓘ Source: listings_history table (triggers on properties + properties_extension) + one-shot
backfill from property_details.listing_events for pre-trigger history.
Tax reassessment forecast TX · Resets to sale price
- Current annual tax
- $3,824 · $319/mo
- Projected year-2 tax
- $3,824 · $319/mo
- Expected delta
- $0/yr ($0/mo · 0.0%)
ⓘ Screening estimate from a state-policy table — verify with the county assessor before closing.
Climate risk First Street
- Flood 5/10 Major FEMA zone X · 24% chance over 30 yrs
- Wildfire 1/10 Low
- Heat 6/10 Major 7 d/yr ≥101°F today · 25 d/yr by 30 yrs out
- Wind 1/10 Low
- Air quality 2/10 Low 1 unhealthy d/yr today · 1 by 30 yrs out
Nearby sold comps map
Loading sold comps map…
Walkable amenities ~0.75 mi
Loading nearby amenities…
Taxation est. · year 1
- Rental income
- $21,330
- − Mortgage interest
- −$6,996
- − Property taxes
- −$3,824
- − Insurance
- −$624
- − Repairs & maintenance
- −$1,706
- − Management
- −$1,706
- − Depreciation
- −$3,633
- Taxable income
- $2,839
- Est. tax owed @ 24.0%
- −$681
- After-tax cash flow
- $3,861/yr
For passive investors: Depreciation is non-cash, so a rental often shows a tax loss while cash-flowing — sheltering income. Rental losses are passive: they offset passive income freely, and up to $25,000/yr can offset ordinary (W-2) income if you actively participate and your MAGI is under $100k (phasing out to $0 by $150k); unused losses carry forward. On sale, claimed depreciation is recaptured at up to 25%, and gains may owe capital-gains tax (a 1031 exchange can defer both). Figures are a year-1 estimate at your 24.0% rate — not tax advice; consult a CPA.
Schools (NCES district)
- District
- El Paso ISD
- NCES district ID
- 4818300
- Math proficiency
- 27% ▼ -24.00%
- Reading proficiency
- 37% ▼ -7.00%
- Median HH income
- $38,704
- Composite
- 26.75/100
- National rank
- #7138
- State rank
- #591 of 826 in TX
Livability — El Paso
- Score
- 81/100
- State rank
- #23
- US rank
- #1375
Category grades
Schools grade is shown separately in the Schools card above.
Census & demographics
- Census place
- El Paso, TX
- City population
- 630,223
- Population (ZIP)
- 8,321
Population outlook (El Paso County) Hauer SSP2
- Today (2025)
- 897,899 people
- By 2030
- 922,694 · +2.8%
- By 2040
- 960,492 · +7.0%
- By 2050
- 982,919 · +9.5%
- By 2075
- 997,266 · +11.1%
- By 2100
- 900,630 · +0.3%
Race, ethnicity, and origin ACS 2023
- Neighborhood character
- Predominantly Hispanic (94%)
- Race & ethnicity
- Hispanic / Latino 94% Two or more races 48% White 4% Black 2%
- Hispanic origin (detail)
- Mexican 90%
- Foreign-born
- 44% · Canada
- Languages at home
- 13% English-only · Spanish 86%
Political lean MEDSL · El Paso
- 2024 margin
- D (+15.1) · D 57.0% · R 41.8% · Other 1.2%
- 2008→2024 swing
- -17.4pp toward R · 2008: 32.5pp · 2024: 15.1pp
- All cycles
- 2024: D+15.1 2020: D+35.1 2016: D+43.2 2012: D+32.6 2008: D+32.5
Not yet ingested
- Civics
- —
Market trends
- HPI YoY
- ▲ 7.49%
- Current HPI
- 215.1564
- Rent YoY
- —
- Metro
- —
- State GDP YoY
- ▲ 3.95%
- F500 in state
- 110
Industry mix (Fortune 500 HQ in TX)
| Industry | F500 HQs | Revenue |
|---|---|---|
| Energy | 16 | $1,198B |
|
||
| Technology | 5 | $198B |
|
||
| Engineering / Construction | 4 | $72B |
|
||
| Energy Services | 3 | $60B |
|
||
| Utilities | 3 | $41B |
|
||
| Healthcare | 2 | $330B |
|
||
Price history
-7.4% since first listed6 events — show timeline
- 2026-04-15 Price Changed $124,900 GEPARMLS
- 2026-03-27 Listed $134,900 GEPARMLS
- 2020-01-08 Sold (Public Records) — Public Records
- 2008-02-04 Sold (Public Records) — Public Records
- 1979-08-01 Sold (Public Records) — Public Records
- 1979-04-04 Sold (Public Records) — Public Records
Property tax history
+14.6%/yrLatest (2025): $3,824 · +20.4% YoY. Source: county tax records.
Cash-flow waterfall
monthlySold comps — $/sqft
last 12 mo · ≤1 miLoading sold comps…