4320 Obsidian Pl · Mesquite, TX
Flood risk No data
- FEMA flood zone
- —
- Chance of flooding over 30 yrs
- —
- Est. flood insurance / yr
- —
Fire risk No data
- Est. fire insurance / yr
- —
Heat risk No data
- Hot days now (above threshold)
- —
- Hot days in 30 yrs
- —
Wind risk No data
- Chance of severe wind over 30 yrs
- —
Air-quality risk No data
- Unhealthy air days now
- —
- Unhealthy air days in 30 yrs
- —
Risk factors via First Street. Map © Google.
Why this score? — see what drove the D grade
The composite is a weighted blend of 9 inputs, each scored 0–100. Each bar is that input's sub-score; the figure is the points it added to the 100-point composite (weight × sub-score).
- Cash flow +15.6/30.0
- ARV discount +7.5/15.0
- DSCR +4.8/10.0
- 1% rule +3.7/10.0
- Livability +3.5/5.0
- Schools +2.9/10.0
- Rent growth +2.5/5.0
- Condition / age +2.5/5.0
- Appreciation +0.0/10.0
$429,999
🖨 Deal sheet 📄 Offer letter ✓ Due diligence
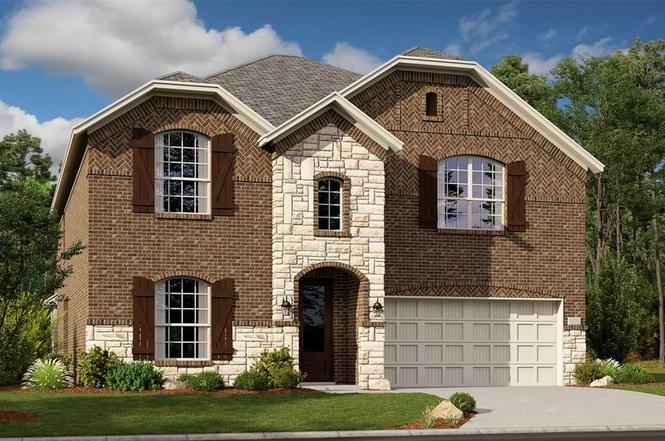
Listing remarks
Discover the LENNAR Solterra community with the stunning Sunstone with Media Floorplan—a sophisticated two-story home designed for modern living! This elegant residence features an expansive open-concept layout that makes everyday gatherings a breeze. Enjoy soaring ceilings that enhance the feeling of space and light, while the inviting covered patio offers the perfect spot for alfresco dining or morning coffee. The luxurious owner’s suite, complete with a spacious walk-in closet, is thoughtfully positioned for privacy alongside a flexible study on the first floor. Upstairs, you'll find three additional bedrooms, a breezy game room for fun-filled evenings, and a dedicated media
Key facts
- Walk-in closet
- Covered patio
- Game room
Tags
Neighborhood map
What this means for you Summary
Snapshot
- This is a 5-bed/4.5-bath land listed at $430k.
Deal economics
- At list price, monthly cash flow is $179 ($2k/yr) — positive.
- The deal already cash-flows at list — no discount required.
- To meet the 1% rule (rent ≥ 1% of price), the offer needs to be $374k (13.1% below list).
- Recommended offer: $374k (13.1% below list) — sets the bar for 1% rule.
- Cap rate 6.8% vs local median 4.4% in Mesquite — top-decile yield for the area; either an underpriced asset or a hidden risk that comps aren't pricing in. Stress-test before assuming the spread holds.
Location & tenants
- Location reads 70/100 on livability (#358 in TX) — a middle-class / working-renter tenant base. Strengths: cost of living A+, housing A+, health & safety A-; Watch: crime F, commute F.
- Mesquite ISD (suburban): math 35% / reading 32% proficiency, ranked #536 of 826 in TX (top 65%) — families likely to look elsewhere, expect single-tenant / working-renter base with shorter leases; 63% free/reduced lunch — lower-income household profile, screen leases tightly.
- Zoned schools: Gentry El (math 34% / reading 40%, grade F, #1,769 of 4,322 statewide, top 44%, 637 students, 79% FRL) — zoned schools average 79% FRL vs 63% district-wide (16 pts higher); higher-poverty schools than district average — tighter screening recommended.
- Market conditions: Rents flat; 590 active listings in the ZIP; 4 comparable units currently listed for rent nearby; rentals at typical pace (median 25d on market — plan ~3-4 weeks tenant-placement turnaround); high-income renter base; 12,577 units permitted in Dallas County in 2024 (6,829 in 5+ unit buildings).
- This rent runs 40% of the median local income ($111k/yr) — at the standard rent-burdened threshold; future hikes will face affordability resistance.
Forward outlook
- Local home prices are declining (-3.0%/yr); year-one equity from $3k of loan paydown is wiped out by about $13k of value loss. Plan a longer hold.
- Dallas County population projected at +35% by 2050 — long-run rental-demand tailwind backs the buy-and-hold thesis.
Negotiation context
- It's been on market 53 days — a 3% lower offer ($417k) is reasonable based on typical stale-listing flexibility.
Questions for the listing agent
- It's been on market 53 days. Have you received any prior offers? Is the seller open to a 13% concession, seller financing, or rate buy-down credit?
- What does the HOA fee cover, when was the last increase, and are there any pending special assessments or reserve-fund shortfalls?
- Is there a deadline driving the sale (1031 exchange, divorce, estate, relocation)? That informs how much negotiation room exists.
- Crime grade is F in this area — have there been break-ins, vandalism, or insurance claims at this property in the last 3 years? What carrier currently insures it and at what premium?
- The area grade is low — what's the realistic commute time and amenity access for the typical tenant pool here? Any planned neighborhood developments (good or bad) we should know about?
- What's the average days-on-market for RENTAL listings here right now (not sales)? A rising rental-DOM trend means longer vacancies and softer asking-rent achievability than the comps imply.
- What's the recent tenant-quality profile in this submarket — average credit score on applications, eviction rate, late-payment / NSF rate, and stable-employment percentage? A property-management company in the area should have these aggregated.
- How much new for-sale + rental construction is in the pipeline within 1–3 miles? Heavy new supply typically softens prices + rents 12–24 months out; constrained supply supports both.
Investment metrics
- 1% rule
- 0.87% ✗
- Cap rate
- 6.79%
- Cash-on-cash
- 1.78%
- DSCR
- 1.08
- GRM
- 9.6
CMA / ARV
No comps found within radius.
Projected returns pro-forma
-3.0% appreciation · 0.07% rent growth · sell at horizon
- IRR
- -16.6%
- Equity multiple
- 0.43×
- Total profit
- $-69,063
- Equity at exit
- $64,114
- IRR
- -14.4%
- Equity multiple
- 0.28×
- Total profit
- $-87,160
- Equity at exit
- $37,178
Cash invested: $120,400 (down + closing). Projections, not guarantees.
Landlord ↔ Tenant lean methodology
- Overall (STATE)
- 87 Strongly Landlord-Friendly
- State Texas
- 87 Strongly Landlord-Friendly · R+5
- County
- — inherits STATE
- City
- — inherits STATE
ZIP-level market 75181
- Home prices YoY
- -9.4%
- Rents YoY
- 0.1%
- Active inventory
- 590
- Price-to-rent
- 9.6×
Monthly cashflow live
- Estimated rent
- $3,736 medium interval (Pro) →
- Mortgage (P&I)
- −$2,255
- Tax from tax record
- −$156 /mo · $1,877/yr
- Insurance
- −$179
- HOA
- −$182
- Vacancy / Maint / Mgmt
- −$784
- Net cashflow
- $179
Break-even live
UW: 25.0% down · 7.5% · 30yr · 1.5% tax · 5.0% vac · 8.0% maint · 8.0% mgmt
Financing live
Cash to close
- Down payment
- $107,500
- Closing costs
- $12,900
- Reserves months
- —
- Total cash needed
- —
Loan-product check · same deal, 3 products live
Conventional
25% down · 7.5% · 30yr
- Down + closing
- —
- Monthly P&I
- —
- Monthly cashflow
- —
- DSCR
- —
- Eligible?
- —
Personal DTI + credit; lowest rate.
DSCR
20% down · 8.5% · 30yr
- Down + closing
- —
- Monthly P&I
- —
- Monthly cashflow
- —
- DSCR
- —
- Eligible?
- —
No personal income docs; deal must DSCR.
Hard money
10% down · 12.0% · 12mo
- Down + closing
- —
- Monthly P&I
- —
- Monthly cashflow
- —
- DSCR
- —
- Eligible?
- —
Short-term bridge; refi at stabilization.
Rent comps 4 comps
| Address | Beds | Baths | Sqft | Rent | $/sqft | DOM | Units | Dist |
|---|---|---|---|---|---|---|---|---|
| 3216 Southampton Dr Mesquite, TX | 5.0 | 3.5 | 2947 | $3,250 | $1.10 | 43d | 1 | 1.26mi |
| 1308 Dawson Way Mesquite, TX | 4.0 | 2.5 | 2476 | $3,573 | $1.44 | 24d | 1 | 1.38mi |
| 1908 Twisted Tree Ln Mesquite, TX | 5.0 | 2.5 | 2750 | $3,670 | $1.33 | 24d | 1 | 1.38mi |
| 6308 Ashford Trl Mesquite, TX | 5.0 | 3.0 | 3279 | $3,200 | $0.98 | 18d | 1 | 1.40mi |
HOA detail
- Monthly dues
- $182 · $2,184/yr
Listing history 4 events
-
2026-04-01status Pending
-
2026-03-04price $429,999
-
2026-02-26price $434,999
-
2026-02-07$445,999 Active
ⓘ Source: listings_history table (triggers on properties + properties_extension) + one-shot
backfill from property_details.listing_events for pre-trigger history.
Tax reassessment forecast TX · Resets to sale price
- Current annual tax
- $1,877 · $156/mo
- Projected year-2 tax
- $7,869 · $656/mo
- Expected delta
- +$5,992/yr (+$499/mo · 319.3%)
ⓘ Screening estimate from a state-policy table — verify with the county assessor before closing.
Nearby sold comps map
Loading sold comps map…
Walkable amenities ~0.75 mi
Loading nearby amenities…
Taxation est. · year 1
- Rental income
- $44,828
- − Mortgage interest
- −$24,087
- − Property taxes
- −$1,877
- − Insurance
- −$2,150
- − Repairs & maintenance
- −$3,586
- − Management
- −$3,586
- − HOA
- −$2,184
- − Depreciation
- −$12,509
- Taxable loss
- −$5,150
- Est. tax savings @ 24.0%
- +$1,236
- After-tax cash flow
- $3,380/yr
For passive investors: Depreciation is non-cash, so a rental often shows a tax loss while cash-flowing — sheltering income. Rental losses are passive: they offset passive income freely, and up to $25,000/yr can offset ordinary (W-2) income if you actively participate and your MAGI is under $100k (phasing out to $0 by $150k); unused losses carry forward. On sale, claimed depreciation is recaptured at up to 25%, and gains may owe capital-gains tax (a 1031 exchange can defer both). Figures are a year-1 estimate at your 24.0% rate — not tax advice; consult a CPA.
Schools (NCES district)
- District
- Mesquite ISD
- NCES district ID
- 4830390
- Math proficiency
- 35% ▼ -11.00%
- Reading proficiency
- 32% ▼ -7.00%
- Median HH income
- $49,372
- Composite
- 29.06/100
- National rank
- #6606
- State rank
- #536 of 826 in TX
Livability — Mesquite
- Score
- 70/100
- State rank
- #358
- US rank
- #7743
Category grades
Schools grade is shown separately in the Schools card above.
Census & demographics
- Census place
- Mesquite, TX
- County
- Dallas County · 2,612,404 people
- City population
- 150,788
- Metro
- Dallas-Fort Worth-Arlington, TX
- Population (ZIP)
- 29,788
- Household income
- $111,052
- Rent vs Own
- Severe rent burden
- 857.0
Population outlook (Dallas County) Hauer SSP2
- Today (2025)
- 2,979,839 people
- By 2030
- 3,191,823 · +7.1%
- By 2040
- 3,619,611 · +21.5%
- By 2050
- 4,026,915 · +35.1%
- By 2075
- 4,957,073 · +66.4%
- By 2100
- 5,508,725 · +84.9%
Race, ethnicity, and origin ACS 2023
- Neighborhood character
- Highly diverse neighborhood (Simpson 0.71)
- Race & ethnicity
- Black 39% Hispanic / Latino 32% Two or more races 21% White 16% Asian 5% Native American 1%
- Hispanic origin (detail)
- Mexican 27% Puerto Rican 1%
- Common ancestry
- Slovak 2% Italian 1%
- Foreign-born
- 22% · Canada, Vietnam
- Languages at home
- 64% English-only · Spanish 27% Tagalog/Filipino 3% Other Asian/Pacific 1%
Political lean MEDSL · Dallas
- 2024 margin
- Strong D (+22.2) · D 60.2% · R 38.0% · Other 1.8%
- 2008→2024 swing
- +6.9pp toward D · 2008: 15.3pp · 2024: 22.2pp
- All cycles
- 2024: D+22.2 2020: D+31.6 2016: D+26.2 2012: D+15.4 2008: D+15.3
Not yet ingested
- Civics
- —
Market trends
- HPI YoY
- ▼ -26.63%
- Current HPI
- 257.0959
- Rent YoY
- ▲ 0.07%
- Metro
- Dallas-Fort Worth-Arlington, TX
- State GDP YoY
- ▲ 3.95%
- F500 in state
- 110
Industry mix (Fortune 500 HQ in TX)
| Industry | F500 HQs | Revenue |
|---|---|---|
| Energy | 16 | $1,198B |
|
||
| Technology | 5 | $198B |
|
||
| Engineering / Construction | 4 | $72B |
|
||
| Energy Services | 3 | $60B |
|
||
| Utilities | 3 | $41B |
|
||
| Healthcare | 2 | $330B |
|
||
Price history
-3.6% since first listed4 events — show timeline
- 2026-04-01 Pending — NTREIS
- 2026-03-04 Price Changed $429,999 NTREIS
- 2026-02-26 Price Changed $434,999 NTREIS
- 2026-02-07 Listed $445,999 NTREIS
Cash-flow waterfall
monthlySold comps — $/sqft
last 12 mo · ≤1 miLoading sold comps…