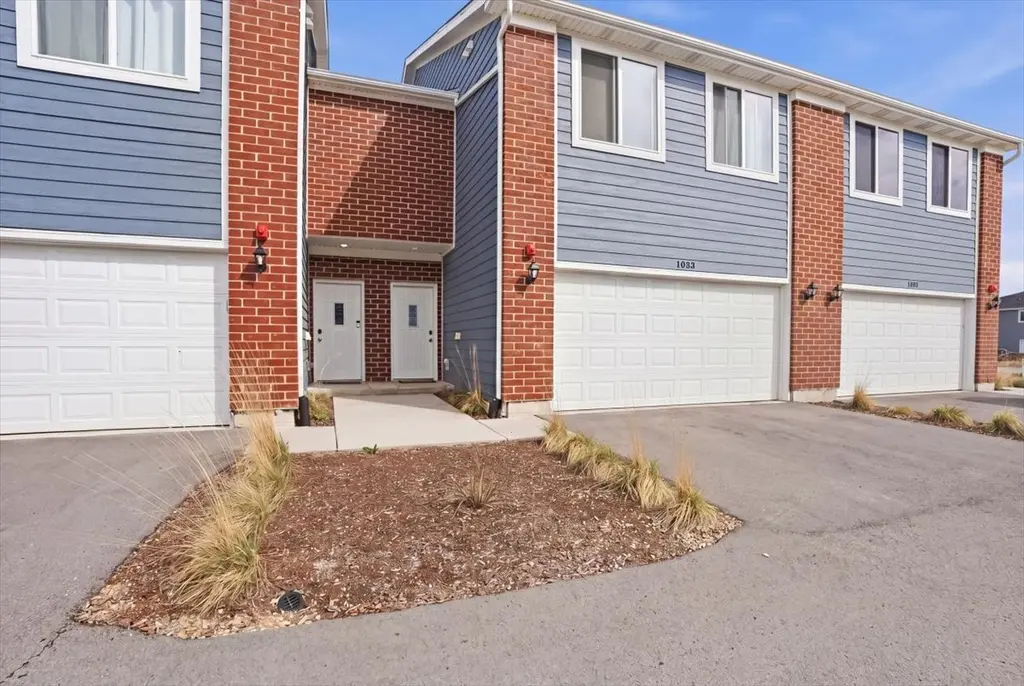
1033 Gillespie Ln · Yorkville, IL
Flood risk 1/10 · Minimal
- FEMA flood zone
- X (unshaded)
- Chance of flooding over 30 yrs
- 0.0%
- Est. flood insurance / yr
- $507 – $1,088
Fire risk 1/10 · Minimal
- Est. fire insurance / yr
- $804 – $1,492
Heat risk 3/10 · Minor
- Hot days now (above 102°F)
- 7 days/yr
- Hot days in 30 yrs
- 15 days/yr
Wind risk 2/10 · Minimal
- Chance of severe wind over 30 yrs
- 1.0%
Air-quality risk 2/10 · Minimal
- Unhealthy air days now
- 1 days/yr
- Unhealthy air days in 30 yrs
- 2 days/yr
Risk factors via First Street. Map © Google.
Why this score? — see what drove the D grade
The composite is a weighted blend of 9 inputs, each scored 0–100. Each bar is that input's sub-score; the figure is the points it added to the 100-point composite (weight × sub-score).
- Cash flow +10.9/30.0
- ARV discount +8.6/15.0
- Livability +4.3/5.0
- Condition / age +4.0/5.0
- 1% rule +3.8/10.0
- Schools +3.6/10.0
- DSCR +3.2/10.0
- Rent growth +2.5/5.0
- Appreciation +0.0/10.0
$299,900
🖨 Deal sheet 📄 Offer letter ✓ Due diligence
Listing remarks MLS
Welcome to 1033 Gillespie Lane in Yorkville, a beautifully maintained townhouse located in the highly sought after Yorkville School District. From the moment you enter, you will appreciate the bright and open layout designed for both everyday living and entertaining. The main level offers a seamless flow between the kitchen (which has 42" cabinetry, stunning granite countertops and a large kitchen island) and living space, creating a comfortable and inviting atmosphere. Upstairs, you will find three spacious bedrooms, two full bathrooms, and a versatile loft that can easily serve as a home office, additional living area, or flex space to fit your needs. The layout provides both functionality and privacy, making it ideal for a variety of lifestyles. This home also features a convenient second floor laundry area with washer and dryer included, along with a 2 car garage offering added storage and ease. Combining space, comfort, and a desirable location, this home is a great opportunity you will not want to miss.
Key facts
- Large kitchen island
- 2 car garage
- $210 HOA
Tags
Neighborhood map
What this means for you Summary
Snapshot
- This is a 3-bed/2.5-bath single-family listed at $300k. Condition is rated good.
Deal economics
- At list price, monthly cash flow is $-134 ($-2k/yr) — negative.
- To cash-flow at today's rent, offer at most $276k (7.9% below list).
- To meet the 1% rule (rent ≥ 1% of price), the offer needs to be $263k (12.4% below list).
- Recommended offer: $263k (12.4% below list) — sets the bar for 1% rule.
- Cap rate 5.8% vs local median 3.9% in Yorkville — top-decile yield for the area; either an underpriced asset or a hidden risk that comps aren't pricing in. Stress-test before assuming the spread holds.
Location & tenants
- Location reads 86/100 on livability (#25 in IL, #458 nationally) — a professional / high-income tenant draw. Strengths: crime A+, amenities A+, employment A+; Watch: commute F.
- Yorkville CUSD 115 (suburban): math 34% / reading 42% proficiency, ranked #131 of 620 in IL (top 21%) — families likely to look elsewhere, expect single-tenant / working-renter base with shorter leases; only 17% free/reduced lunch — higher-income household profile.
- Market conditions: 201 active listings in the ZIP; 8 comparable units currently listed for rent nearby; rentals leasing fast (median 5d on market — plan ~1-2 weeks tenant-placement turnaround); high-income renter base; 706 units permitted in Kendall County in 2024 (263 in 5+ unit buildings).
Forward outlook
- Local home prices are declining (-3.0%/yr); year-one equity from $2k of loan paydown is wiped out by about $9k of value loss. Plan a longer hold.
- Kendall County population projected at +20% by 2050 — long-run rental-demand tailwind backs the buy-and-hold thesis.
Negotiation context
- It's been on market 62 days — a 6% lower offer ($282k) is reasonable based on typical stale-listing flexibility.
Questions for the listing agent
- What do current leases actually rent for vs. the listed asking? Can we see a recent rent roll and the last 12 months of T-12 income?
- It's been on market 62 days. Have you received any prior offers? Is the seller open to a 12% concession, seller financing, or rate buy-down credit?
- What does the HOA fee cover, when was the last increase, and are there any pending special assessments or reserve-fund shortfalls?
- Why hasn't it sold? Are there any deal-killer items the seller is aware of (foundation, flood, title, zoning, code violations)?
- Is there a deadline driving the sale (1031 exchange, divorce, estate, relocation)? That informs how much negotiation room exists.
- The area grade is low — what's the realistic commute time and amenity access for the typical tenant pool here? Any planned neighborhood developments (good or bad) we should know about?
- What's the average days-on-market for RENTAL listings here right now (not sales)? A rising rental-DOM trend means longer vacancies and softer asking-rent achievability than the comps imply.
- What's the recent tenant-quality profile in this submarket — average credit score on applications, eviction rate, late-payment / NSF rate, and stable-employment percentage? A property-management company in the area should have these aggregated.
- How much new for-sale + rental construction is in the pipeline within 1–3 miles? Heavy new supply typically softens prices + rents 12–24 months out; constrained supply supports both.
Investment metrics
- 1% rule
- 0.88% ✗
- Cap rate
- 5.76%
- Cash-on-cash
- -1.91%
- DSCR
- 0.92
- GRM
- 9.5
CMA / ARV
- ARV (median comp)
- $307,547
- List price
- $299,900
- Delta
- -2.49%
- Verdict
- FAIR
- Comps
- 20 within 1.0 mi
Show comp detail 7 sales within ~0.75 mi
| Address | Dist | Beds/Ba | Sqft | Sold | Price | $/sf | Match |
|---|---|---|---|---|---|---|---|
| 1121 Blackberry Shore Ln | 0.15mi | 3/2.0 | 2,003 (+2%) | 1mo | $475,000 | $237 | 88 |
| 1111 Blackberry Shore Ln | 0.13mi | 3/2.0 | 1,831 (-7%) | 12mo | $459,000 | $251 | 70 |
| 941 Blackberry Shore Ln | 0.17mi | 3/2.0 | 2,178 (+11%) | 7mo | $450,000 | $207 | 66 |
| 1063 Western Ln | 0.14mi | 3/2.5 | 1,742 (-11%) | 12mo | $380,000 | $218 | 64 |
| 824 Canyon Trl | 0.26mi | 3/2.0 | 1,761 (-10%) | 13mo | $430,000 | $244 | 58 |
| 2401 Alan Dale Ln | 0.61mi | 3/2.5 | 2,063 (+5%) | 7mo | $454,360 | $220 | 57 |
| 607 Yellowstone Ln | 0.54mi | 4/2.5 (+1) | 2,115 (+8%) | 22mo | $429,900 | $203 | 39 |
Match score weights: distance 35% · size 25% · config 20% · recency 20%. Top-matched comps best support the ARV.
Projected returns pro-forma
-3.0% appreciation · 3.0% rent growth · sell at horizon
- IRR
- -19.4%
- Equity multiple
- 0.32×
- Total profit
- $-56,980
- Equity at exit
- $44,716
- IRR
- -12.0%
- Equity multiple
- 0.28×
- Total profit
- $-60,067
- Equity at exit
- $25,930
Cash invested: $83,972 (down + closing). Projections, not guarantees.
Landlord ↔ Tenant lean methodology
- Overall (STATE)
- 43 Moderately Tenant-Leaning
- State Illinois
- 43 Moderately Tenant-Leaning · D+7
- County
- — inherits STATE
- City
- — inherits STATE
ZIP-level market 60560
- Active inventory
- 201
- Price-to-rent
- 9.5×
Monthly cashflow live
- Estimated rent
- $2,628 high interval (Pro) →
- Mortgage (P&I)
- −$1,573
- Tax from tax record
- −$302 /mo · $3,627/yr
- Insurance
- −$125
- HOA
- −$210
- Vacancy / Maint / Mgmt
- −$552
- Net cashflow
- $-134
Break-even live
UW: 25.0% down · 7.5% · 30yr · 1.5% tax · 5.0% vac · 8.0% maint · 8.0% mgmt
Financing live
Cash to close
- Down payment
- $74,975
- Closing costs
- $8,997
- Reserves months
- —
- Total cash needed
- —
Loan-product check · same deal, 3 products live
Conventional
25% down · 7.5% · 30yr
- Down + closing
- —
- Monthly P&I
- —
- Monthly cashflow
- —
- DSCR
- —
- Eligible?
- —
Personal DTI + credit; lowest rate.
DSCR
20% down · 8.5% · 30yr
- Down + closing
- —
- Monthly P&I
- —
- Monthly cashflow
- —
- DSCR
- —
- Eligible?
- —
No personal income docs; deal must DSCR.
Hard money
10% down · 12.0% · 12mo
- Down + closing
- —
- Monthly P&I
- —
- Monthly cashflow
- —
- DSCR
- —
- Eligible?
- —
Short-term bridge; refi at stabilization.
Rent comps 8 comps
| Address | Beds | Baths | Sqft | Rent | $/sqft | DOM | Units | Dist |
|---|---|---|---|---|---|---|---|---|
| 1128 Gillespie Ln Unit 1128 Yorkville, IL | 3.0 | 2.5 | 1696 | $2,600 | $1.53 | 24d | 1 | 0.05mi |
| 1122 Gillespie Ln Yorkville, IL | 3.0 | 2.5 | 1696 | $2,450 | $1.44 | 3d | 1 | 0.09mi |
| 1123 Gillespie Ln Unit 1123 Yorkville, IL | 3.0 | 2.5 | 1696 | $2,400 | $1.42 | 43d | 1 | 0.12mi |
| 906 Gillespie Ln Yorkville, IL | 3.0 | 3.5 | 2616 | $2,750 | $1.05 | 1d | 1 | 0.18mi |
| 1216 Gillespie Ln Yorkville, IL | 3.0 | 2.5 | 1696 | $2,750 | $1.62 | 43d | 1 | 0.40mi |
| 502 Powers Ct Unit B Yorkville, IL | 3.0 | 3.5 | 1560 | $2,399 | $1.54 | 5d | 1 | 1.01mi |
| 502 Powers Ct Unit B Yorkville, IL | 3.0 | 3.5 | 1560 | $1,999 | $1.28 | 1d | 1 | 1.01mi |
| 4409 Klatt St Plano, IL | 3.0 | 2.5 | 1382 | $2,150 | $1.56 | 1d | 1 | 1.46mi |
HOA detail
- Monthly dues
- $210 · $2,520/yr
Listing history 15 events
-
2026-06-18days on market $299,900 Active 62 DOM
-
2026-06-17days on market $299,900 Active 61 DOM
-
2026-06-16days on market $299,900 Active 60 DOM
-
2026-06-15days on market $299,900 Active 59 DOM
-
2026-06-13days on market $299,900 Active 57 DOM
-
2026-06-13days on market $299,900 Active 56 DOM
-
2026-06-09days on market $299,900 Active 53 DOM
-
2026-06-08days on market $299,900 Active 52 DOM
-
2026-06-08days on market $299,900 Active 51 DOM
-
2026-06-04days on market $299,900 Active 48 DOM
-
2026-06-03days on market $299,900 Active 47 DOM
-
2026-06-02statusdays on market $299,900 Active 46 DOM
-
2026-06-01days on market $299,900 Contingent - No Showings 45 DOM
-
2026-05-31days on market $299,900 Contingent - No Showings 44 DOM
-
2026-04-17$312,900 Active 1033-char remark
Show marketing remark (1033 chars)
Welcome to 1033 Gillespie Lane in Yorkville, a beautifully maintained townhouse located in the highly sought after Yorkville School District. From the moment you enter, you will appreciate the bright and open layout designed for both everyday living and entertaining. The main level offers a seamless flow between the kitchen (which has 42" cabinetry, stunning granite countertops and a large kitchen island) and living space, creating a comfortable and inviting atmosphere. Upstairs, you will find three spacious bedrooms, two full bathrooms, and a versatile loft that can easily serve as a home office, additional living area, or flex space to fit your needs. The layout provides both functionality and privacy, making it ideal for a variety of lifestyles. This home also features a convenient second floor laundry area with washer and dryer included, along with a 2 car garage offering added storage and ease. Combining space, comfort, and a desirable location, this home is a great opportunity you will not want to miss.
ⓘ Source: listings_history table (triggers on properties + properties_extension) + one-shot
backfill from property_details.listing_events for pre-trigger history.
Tax reassessment forecast IL · Partial reset (capped growth)
- Current annual tax
- $3,627 · $302/mo
- Projected year-2 tax
- $5,217 · $435/mo
- Expected delta
- +$1,590/yr (+$133/mo · 43.8%)
ⓘ Screening estimate from a state-policy table — verify with the county assessor before closing.
Climate risk First Street
- Flood 1/10 Low FEMA zone X (unshaded) · 0% chance over 30 yrs
- Wildfire 1/10 Low
- Heat 3/10 Moderate 7 d/yr ≥102°F today · 15 d/yr by 30 yrs out
- Wind 2/10 Low 100% chance of damaging wind over 30 yrs
- Air quality 2/10 Low 1 unhealthy d/yr today · 2 by 30 yrs out
Nearby sold comps map
Loading sold comps map…
Walkable amenities ~0.75 mi
Loading nearby amenities…
Taxation est. · year 1
- Rental income
- $31,540
- − Mortgage interest
- −$16,799
- − Property taxes
- −$3,627
- − Insurance
- −$1,500
- − Repairs & maintenance
- −$2,523
- − Management
- −$2,523
- − HOA
- −$2,520
- − Depreciation
- −$8,724
- Taxable loss
- −$6,677
- Est. tax savings @ 24.0%
- +$1,602
- After-tax cash flow
- $0/yr
For passive investors: Depreciation is non-cash, so a rental often shows a tax loss while cash-flowing — sheltering income. Rental losses are passive: they offset passive income freely, and up to $25,000/yr can offset ordinary (W-2) income if you actively participate and your MAGI is under $100k (phasing out to $0 by $150k); unused losses carry forward. On sale, claimed depreciation is recaptured at up to 25%, and gains may owe capital-gains tax (a 1031 exchange can defer both). Figures are a year-1 estimate at your 24.0% rate — not tax advice; consult a CPA.
Condition & rehab AI · 6 photos
This beautifully maintained townhome in Yorkville School District offers a good condition with minor cosmetic updates to enhance its curb appeal and value.
Value-add opportunities
- Both Paint exterior trim — Enhances curb appeal and value.
- Both Clean gutters — Improves drainage and property value.
- Both Landscaping — Enhances curb appeal and value.
- Both Replace light fixtures — Modernizes the space and improves curb appeal.
- Both Add outdoor lighting — Enhances safety and curb appeal.
- Both Install smart home devices — Improves convenience and marketability.
Renovation cost estimate screening
Value-add ROI direction
- Both Paint exterior trim — Enhances curb appeal and value. ↑
- Both Clean gutters — Improves drainage and property value. ↑
- Both Landscaping — Enhances curb appeal and value. ↑
- Both Replace light fixtures — Modernizes the space and improves curb appeal. ↑
- Both Add outdoor lighting — Enhances safety and curb appeal. ↑
- Both Install smart home devices — Improves convenience and marketability. ↑
ⓘ Cost ranges are severity-bucket heuristics (US national rule-of-thumb). Get contractor quotes + a written scope before underwriting a rehab budget.
Schools (NCES district)
- District
- Yorkville CUSD 115
- NCES district ID
- 1743960
- Math proficiency
- 34% ▼ -4.00%
- Reading proficiency
- 42% ▼ -8.00%
- Median HH income
- $84,742
- Composite
- 36.13/100
- National rank
- #4746
- State rank
- #131 of 620 in IL
Livability — Yorkville
- Score
- 86/100
- State rank
- #25
- US rank
- #458
Category grades
Schools grade is shown separately in the Schools card above.
Census & demographics
- Census place
- Yorkville, IL
- County
- Kendall County · 71,842 people
- City population
- 28,795
- Metro
- Chicago-Naperville-Elgin, IL-IN-WI
- Population (ZIP)
- 28,795
- Household income
- $110,326
- Rent vs Own
- Severe rent burden
- 224.0
Population outlook (Kendall County) Hauer SSP2
- Today (2025)
- 138,283 people
- By 2030
- 144,935 · +4.8%
- By 2040
- 156,944 · +13.5%
- By 2050
- 165,424 · +19.6%
- By 2075
- 174,715 · +26.3%
- By 2100
- 168,523 · +21.9%
Race, ethnicity, and origin ACS 2023
- Neighborhood character
- Predominantly White (73%)
- Race & ethnicity
- White 73% Hispanic / Latino 18% Two or more races 11% Black 5% Asian 3%
- Hispanic origin (detail)
- Mexican 17%
- Common ancestry
- Romanian 7% Lithuanian 2% Scotch-Irish 2%
- Foreign-born
- 6% · Canada, China
- Languages at home
- 84% English-only · Spanish 12% Other Indo-European 2%
Political lean MEDSL · Kendall
- 2024 margin
- Toss-up / Even · D 50.0% · R 48.5% · Other 1.6%
- 2008→2024 swing
- -5.7pp toward R · 2008: 7.2pp · 2024: 1.5pp
- All cycles
- 2024: D+1.5 2020: D+5.7 2016: R+1.5 2012: R+4.1 2008: D+7.2
Not yet ingested
- Civics
- —
Market trends
- HPI YoY
- ▼ -122.51%
- Current HPI
- 208.8709
- Rent YoY
- —
- Metro
- Chicago-Naperville-Elgin, IL-IN-WI
- State GDP YoY
- ▲ 1.59%
- F500 in state
- 60
Industry mix (Fortune 500 HQ in IL)
| Industry | F500 HQs | Revenue |
|---|---|---|
| Insurance | 4 | $201B |
|
||
| Consumer Goods | 4 | $87B |
|
||
| Industrial Machinery | 3 | $64B |
|
||
| Healthcare | 2 | $55B |
|
||
| Retail / Pharmacy | 1 | $148B |
|
||
| Agriculture / Food | 1 | $86B |
|
||
Price history
1 event — show timeline
- 2026-04-17 Listed $312,900 MRED as Distributed by MLS Grid
Property tax history
+252.1%/yrLatest (2024): $3,627 · +1221.1% YoY. Source: county tax records.
Cash-flow waterfall
monthlySold comps — $/sqft
last 12 mo · ≤1 miLoading sold comps…