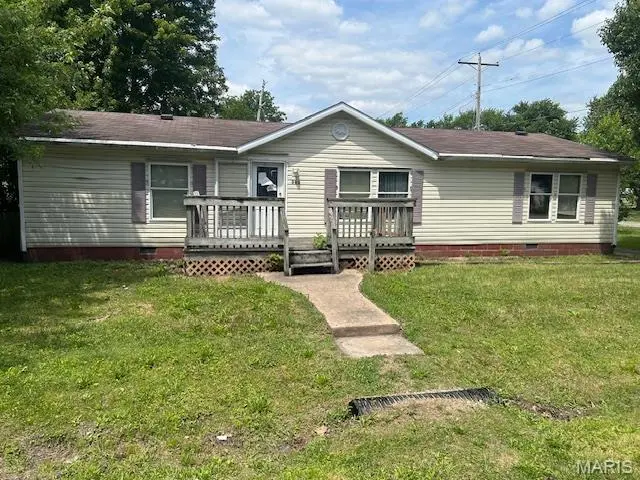
303 S Sherman St · Girard, IL
Flood risk 1/10 · Minimal
- FEMA flood zone
- —
- Chance of flooding over 30 yrs
- 0.0%
- Est. flood insurance / yr
- —
Fire risk 1/10 · Minimal
- Est. fire insurance / yr
- $804 – $1,492
Heat risk 4/10 · Minor
- Hot days now (above 106°F)
- 7 days/yr
- Hot days in 30 yrs
- 20 days/yr
Wind risk 2/10 · Minimal
- Chance of severe wind over 30 yrs
- 2.0%
Air-quality risk 2/10 · Minimal
- Unhealthy air days now
- 1 days/yr
- Unhealthy air days in 30 yrs
- 2 days/yr
Risk factors via First Street. Map © Google.
Why this score? — see what drove the B grade
The composite is a weighted blend of 9 inputs, each scored 0–100. Each bar is that input's sub-score; the figure is the points it added to the 100-point composite (weight × sub-score).
- Cash flow +30.0/30.0
- 1% rule +10.0/10.0
- DSCR +10.0/10.0
- ARV discount +7.5/15.0
- Schools +5.0/10.0
- Livability +3.2/5.0
- Rent growth +2.5/5.0
- Condition / age +2.5/5.0
- Appreciation +0.0/10.0
$30,000
🖨 Deal sheet (PDF) 📄 Offer letter ✓ Due diligence
Listing remarks
Three-bedroom, two-bath home ready for its next owner to make it their own. Property is being sold as-is. Property is lender-owned, and U. S. Bank National Association makes no representations or warranties regarding the condition of the property. U. S. Bank N. A. may have financing options available for potential buyers. For more information, visit: https://www. usbank.com/home-loans/mortgage. html Contact your favorite Realtor today to schedule a showing.
Key facts
- 7,426 sq ft lot
- 2 garage spots
- Built 2001
Property features AI
Exterior
- Parking: Attached or detached 2-car garage
- Utilities: Public water; Public sewer; Electric service by Ameren
- Home design: Residential manufactured home; Single-story
- Construction: Vinyl siding
- Exterior features: Back yard
Interior
- Bedrooms: Three bedrooms on the main level
- Bathrooms: Two full bathrooms on the main level
- Heating & cooling: Forced air heating; Central air conditioning
- Interior features: Crawl space basement; Seven total rooms
Neighborhood map
What this means for you Summary
Snapshot
- This is a 3-bed/2.0-bath single-family listed at $30k.
Deal economics
- At list price, monthly cash flow is $659 ($8k/yr) — positive.
- The deal already cash-flows at list — no discount required.
- Meets the 1% rule at list price ($1k rent vs $30k).
- Recommended offer: $30k (1.5% below list) — sets the bar for market timing.
Location & tenants
- Location reads 63/100 on livability (#787 in IL) — a middle-class / working-renter tenant base. Strengths: cost of living A+, housing A+, crime A; Watch: amenities F, commute F, employment D-.
- Zoned schools: North Mac Elementary (349 students, 0% FRL); North Mac Middle School (math 11% / reading 19%, grade F, #501 of 665 statewide, top 77%, 234 students, 0% FRL); North Mac High School (math 12% / reading 32%, grade F, #319 of 693 statewide, top 50%, 388 students, 0% FRL).
- Market conditions: 13 active listings in the ZIP; 70 units permitted in Macoupin County in 2024 (0 in 5+ unit buildings).
Forward outlook
- Local home prices are declining (-3.0%/yr); year-one equity from $207 of loan paydown is wiped out by about $900 of value loss. Plan a longer hold.
- Macoupin County population projected at -27% by 2050 — secular population decline; favor cash flow + early exit over multi-decade hold.
- At projected returns (-3.0% appreciation + 3.0% rent growth), your $8k cash investment doubles in ~2 years — after that, you're playing with house money.
Negotiation context
- It's been on market 17 days — a 2% lower offer ($30k) is reasonable based on typical stale-listing flexibility.
Questions for the listing agent
- Is there a deadline driving the sale (1031 exchange, divorce, estate, relocation)? That informs how much negotiation room exists.
- Schools are F-rated, which usually means shorter tenancies and higher turnover. Who's the typical renter profile here, and what's been the actual vacancy rate?
- What's the average days-on-market for RENTAL listings here right now (not sales)? A rising rental-DOM trend means longer vacancies and softer asking-rent achievability than the comps imply.
- What's the recent tenant-quality profile in this submarket — average credit score on applications, eviction rate, late-payment / NSF rate, and stable-employment percentage? A property-management company in the area should have these aggregated.
- How much new for-sale + rental construction is in the pipeline within 1–3 miles? Heavy new supply typically softens prices + rents 12–24 months out; constrained supply supports both.
Investment metrics
- 1% rule
- 3.65% ✓
- Cap rate
- 32.64%
- Cash-on-cash
- 94.10%
- DSCR
- 5.19
- GRM
- 2.3
CMA / ARV
- ARV (on-the-fly)
- $85,644
- Comps found
- 12
Show comp detail 12 sales within ~0.75 mi
| Address | Dist | Beds/Ba | Sqft | Sold | Price | $/sf | Match |
|---|---|---|---|---|---|---|---|
| 327 E Madison St | 0.11mi | 3/2.0 | 1,500 (+7%) | 4mo | $16,000 | $11 | 80 |
| 120 N Harrison St | 0.23mi | 4/1.0 (+1) | 1,340 (-5%) | 13mo | $70,000 | $52 | 62 |
| 316 W Center St | 0.40mi | 3/2.0 | 1,300 (-7%) | 8mo | $110,000 | $85 | 62 |
| 619 S 6th St | 0.57mi | 3/2.0 | 1,313 (-6%) | 4mo | $159,000 | $121 | 59 |
| 319 E Center St | 0.15mi | 3/1.0 | 1,280 (-9%) | 19mo | $78,000 | $61 | 58 |
| 230 E Center St | 0.17mi | 3/2.0 | 1,220 (-13%) | 20mo | $65,100 | $53 | 54 |
| 311 W Madison St | 0.36mi | 2/1.0 (-1) | 1,300 (-7%) | 10mo | $135,000 | $104 | 54 |
| 420 S 7th St | 0.56mi | 3/2.0 | 1,232 (-12%) | 3mo | $139,900 | $114 | 51 |
| 202 W Mound St | 0.58mi | 3/1.0 | 1,475 (+5%) | 13mo | $165,000 | $112 | 50 |
| 417 W Franklin St | 0.43mi | 3/2.0 | 1,611 (+15%) | 10mo | $67,000 | $42 | 47 |
| 209 S 5th St | 0.47mi | 3/1.0 | 1,568 (+12%) | 11mo | $23,801 | $15 | 45 |
| 1001 S 6th St | 0.70mi | 2/1.0 (-1) | 1,540 (+10%) | 20mo | $77,650 | $50 | 26 |
Match score weights: distance 35% · size 25% · config 20% · recency 20%. Top-matched comps best support the ARV.
Projected returns pro-forma
-3.0% appreciation · 3.0% rent growth · sell at horizon
- IRR
- 95.0%
- Equity multiple
- 5.42×
- Total profit
- $37,110
- Equity at exit
- $4,473
- IRR
- 97.7%
- Equity multiple
- 11.29×
- Total profit
- $86,405
- Equity at exit
- $2,594
Cash invested: $8,400 (down + closing). Projections, not guarantees.
Landlord ↔ Tenant lean methodology
- Overall (STATE)
- 43 Moderately Tenant-Leaning
- State Illinois
- 43 Moderately Tenant-Leaning · D+7
- County
- — inherits STATE
- City
- — inherits STATE
ZIP-level market 62640
- Home prices YoY
- -17.8%
- Active inventory
- 13
- Price-to-rent
- 2.3×
Monthly cashflow live
- Estimated rent
- $1,096 medium interval (Pro) →
- Mortgage (P&I)
- −$157
- Tax est. 1.5%
- −$38 /mo · $450/yr
- Insurance
- −$12
- HOA
- −$0
- Vacancy / Maint / Mgmt
- −$230
- Net cashflow
- $659
Break-even live
Sensitivity live
| Price | -10% $679 | -5% $669 | +0% $659 | +5% $648 | +10% $638 |
|---|---|---|---|---|---|
| Rent | -10% $572 | -5% $615 | +0% $659 | +5% $702 | +10% $745 |
| Rate | -1.0pp $674 | -0.5pp $666 | base $659 | +0.5pp $651 | +1.0pp $643 |
UW: 25.0% down · 7.5% · 30yr · 1.5% tax · 5.0% vac · 8.0% maint · 8.0% mgmt
Financing live
Cash to close
- Down payment
- $7,500
- Closing costs
- $900
- Reserves months
- —
- Total cash needed
- —
Loan-product check · same deal, 3 products live
Conventional
25% down · 7.5% · 30yr
- Down + closing
- —
- Monthly P&I
- —
- Monthly cashflow
- —
- DSCR
- —
- Eligible?
- —
Personal DTI + credit; lowest rate.
DSCR
20% down · 8.5% · 30yr
- Down + closing
- —
- Monthly P&I
- —
- Monthly cashflow
- —
- DSCR
- —
- Eligible?
- —
No personal income docs; deal must DSCR.
Hard money
10% down · 12.0% · 12mo
- Down + closing
- —
- Monthly P&I
- —
- Monthly cashflow
- —
- DSCR
- —
- Eligible?
- —
Short-term bridge; refi at stabilization.
Listing history 13 events
-
2026-06-21days on market $30,000 Active 17 DOM
-
2026-06-21days on market $30,000 Active 16 DOM
-
2026-06-18days on market $30,000 Active 14 DOM
-
2026-06-17days on market $30,000 Active 13 DOM
-
2026-06-16days on market $30,000 Active 12 DOM
-
2026-06-15days on market $30,000 Active 11 DOM
-
2026-06-13days on market $30,000 Active 9 DOM
-
2026-06-12days on market $30,000 Active 8 DOM
-
2026-06-09days on market $30,000 Active 5 DOM
-
2026-06-08days on market $30,000 Active 4 DOM
-
2026-06-07days on market $30,000 Active 3 DOM
-
2026-06-07remarks 462-char remark
-
2026-06-07$30,000 Active 2 DOM
ⓘ Source: listings_history table (triggers on properties + properties_extension) + one-shot
backfill from property_details.listing_events for pre-trigger history.
Climate risk First Street
- Flood 1/10 Low 0% chance over 30 yrs
- Wildfire 1/10 Low
- Heat 4/10 Moderate 7 d/yr ≥106°F today · 20 d/yr by 30 yrs out
- Wind 2/10 Low 2% chance of damaging wind over 30 yrs
- Air quality 2/10 Low 1 unhealthy d/yr today · 2 by 30 yrs out
Nearby sold comps map
Loading sold comps map…
Walkable amenities ~0.75 mi
Loading nearby amenities…
Taxation est. · year 1
- Rental income
- $13,155
- − Mortgage interest
- −$1,680
- − Property taxes
- −$450
- − Insurance
- −$150
- − Repairs & maintenance
- −$1,052
- − Management
- −$1,052
- − Depreciation
- −$873
- Taxable income
- $7,897
- Est. tax owed @ 24.0%
- −$1,895
- After-tax cash flow
- $6,009/yr
For passive investors: Depreciation is non-cash, so a rental often shows a tax loss while cash-flowing — sheltering income. Rental losses are passive: they offset passive income freely, and up to $25,000/yr can offset ordinary (W-2) income if you actively participate and your MAGI is under $100k (phasing out to $0 by $150k); unused losses carry forward. On sale, claimed depreciation is recaptured at up to 25%, and gains may owe capital-gains tax (a 1031 exchange can defer both). Figures are a year-1 estimate at your 24.0% rate — not tax advice; consult a CPA.
Schools (NCES district)
No district data.
Livability — Girard
- Score
- 63/100
- State rank
- #787
- US rank
- #15695
Category grades
Schools grade is shown separately in the Schools card above.
Census & demographics
- Census place
- Girard, IL
- Population (ZIP)
- 3,342
Population outlook (Macoupin County) Hauer SSP2
- Today (2025)
- 42,867 people
- By 2030
- 40,796 · -4.8%
- By 2040
- 36,135 · -15.7%
- By 2050
- 31,469 · -26.6%
- By 2075
- 22,102 · -48.4%
- By 2100
- 15,380 · -64.1%
Race, ethnicity, and origin ACS 2023
- Neighborhood character
- Predominantly White (94%)
- Race & ethnicity
- White 94% Two or more races 5% Hispanic / Latino 1%
- Common ancestry
- Lithuanian 4% Romanian 3% Iranian 3%
- Foreign-born
- 1%
- Languages at home
- 98% English-only · Spanish 1%
Political lean MEDSL · Macoupin
- 2024 margin
- Solid R (+39.2) · D 29.4% · R 68.7% · Other 1.9%
- 2008→2024 swing
- -49.0pp toward R · 2008: 9.8pp · 2024: -39.2pp
- All cycles
- 2024: R+39.2 2020: R+36.5 2016: R+35.0 2012: R+7.0 2008: D+9.8
Not yet ingested
- Civics
- —
Market trends
- HPI YoY
- ▼ -39.96%
- Current HPI
- 185.0228
- Rent YoY
- —
- Metro
- —
- State GDP YoY
- ▲ 1.59%
- F500 in state
- 60
Industry mix (Fortune 500 HQ in IL)
| Industry | F500 HQs | Revenue |
|---|---|---|
| Insurance | 4 | $201B |
|
||
| Consumer Goods | 4 | $87B |
|
||
| Industrial Machinery | 3 | $64B |
|
||
| Healthcare | 2 | $55B |
|
||
| Retail / Pharmacy | 1 | $148B |
|
||
| Agriculture / Food | 1 | $86B |
|
||
Price history
-53.8% since first listed2 events — show timeline
- 2026-06-04 Listed $30,000 MARIS as Distributed by MLS Grid
- 2005-02-09 Sold (Public Records) $65,000 Public Records
Property tax history
+8.0%/yrLatest (2024): $2,663 · +4.4% YoY. Source: county tax records.
Cash-flow waterfall
monthlySold comps — $/sqft
last 12 mo · ≤1 miLoading sold comps…