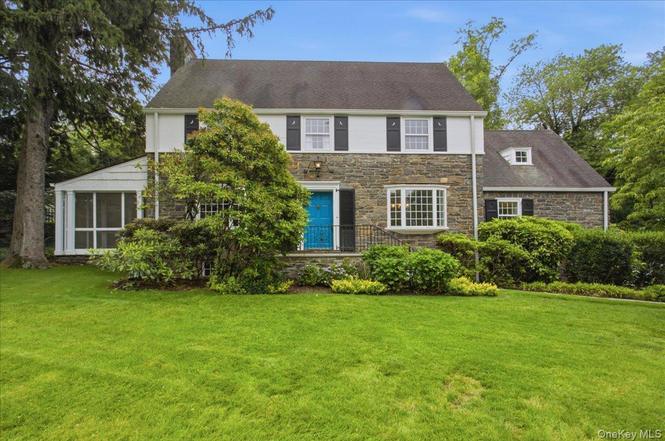
531 Weaver St · New Rochelle, NY
Flood risk 1/10 · Minimal
- FEMA flood zone
- X (unshaded)
- Chance of flooding over 30 yrs
- 0.0%
- Est. flood insurance / yr
- $473 – $860
Fire risk 1/10 · Minimal
- Est. fire insurance / yr
- $691 – $1,283
Heat risk 6/10 · Moderate
- Hot days now (above 98°F)
- 7 days/yr
- Hot days in 30 yrs
- 16 days/yr
Wind risk 6/10 · Moderate
- Chance of severe wind over 30 yrs
- 27.0%
Air-quality risk 5/10 · Moderate
- Unhealthy air days now
- 6 days/yr
- Unhealthy air days in 30 yrs
- 8 days/yr
Risk factors via First Street. Map © Google.
Why this score? — see what drove the C- grade
The composite is a weighted blend of 9 inputs, each scored 0–100. Each bar is that input's sub-score; the figure is the points it added to the 100-point composite (weight × sub-score).
- ARV discount +15.0/15.0
- Cash flow +12.1/30.0
- Schools +7.1/10.0
- 1% rule +3.7/10.0
- DSCR +3.6/10.0
- Livability +3.5/5.0
- Rent growth +2.5/5.0
- Condition / age +2.5/5.0
- Appreciation +0.0/10.0
$1,495,000
🖨 Deal sheet (PDF) 📄 Offer letter ✓ Due diligence
Listing remarks MLS
Classic Ch Colonial. Well Appointed Dripping In Beauty. Mint, Church Key Moldings And Other Fabulous Details, With The Charms Of Yesteryear. Large Sized Bedrms. Newer Eik, Bay Windows, Great Closet And Storage Space Set Back In A Lovely Garden Setting, Screen Rm, New Roof, 2 Car Gar. Close To All
Key facts
- Lush property
- 0.28 acre lot
- 2 garage spots
Tags
Property features AI
Exterior
- Parking: Driveway; 2 parking spaces; 2-car garage
- Security: Security system
- Utilities: Electric service by Con-Edison; Public sewer; Electricity available; Natural gas available
- Home design: Single family residence
- Construction: Frame construction; Full unfinished basement with storage space
- Exterior features: Frame construction; Not waterfront
Interior
- Kitchen: Cooktop
- Bedrooms: 8 total rooms (bedrooms and living spaces combined)
- Bathrooms: 3 full bathrooms; 1 half bathroom
- Heating & cooling: Hot water heating (natural gas); Central air conditioning; One fireplace
- Interior features: Eat-in kitchen; Full attic
Neighborhood map
What this means for you Summary
Snapshot
- This is a 4-bed/3.5-bath single-family listed at $1.50M.
Deal economics
- At list price, monthly cash flow is $-317 ($-4k/yr) — negative.
- To cash-flow at today's rent, offer at most $1.44M (3.7% below list).
- To meet the 1% rule (rent ≥ 1% of price), the offer needs to be $1.31M (12.6% below list).
- Recommended offer: $1.31M (12.6% below list) — sets the bar for 1% rule.
- Cap rate 6.0% vs local median 4.5% in New Rochelle — top-decile yield for the area; either an underpriced asset or a hidden risk that comps aren't pricing in. Stress-test before assuming the spread holds.
Location & tenants
- Location reads 69/100 on livability (#487 in NY) — a middle-class / working-renter tenant base. Strengths: employment A+, crime A, amenities B+; Watch: housing D+, commute F, cost of living F.
- Mamaroneck Union Free School District (suburban): math 74% / reading 81% proficiency, ranked #47 of 590 in NY (top 8%) — strong family-tenant draw, lease renewals of 3-5y typical; only 12% free/reduced lunch — higher-income household profile.
- Zoned schools: Murray Avenue School (math 88% / reading 90%, grade A+, #61 of 2,108 statewide, top 3%, 703 students, 2% FRL); Hommocks School (math 65% / reading 79%, grade A, #76 of 729 statewide, top 11%, 1,258 students, 20% FRL); Mamaroneck High School (math 95% / reading 91%, grade A+, #147 of 1,100 statewide, top 14%, 1,660 students, 23% FRL) — zoned schools at 15% FRL track the district average.
- Market conditions: 139 active listings in the ZIP; 4 comparable units currently listed for rent nearby; rentals leasing fast (median 7d on market — plan ~1-2 weeks tenant-placement turnaround); 954 units permitted in Westchester County in 2024 (649 in 5+ unit buildings).
Forward outlook
- Local home prices are declining (-3.0%/yr); year-one equity from $10k of loan paydown is wiped out by about $45k of value loss. Plan a longer hold.
- Westchester County population projected at +10% by 2050 — modest demand growth; plan on rents tracking national, not racing it.
Negotiation context
- Only 4 days on market — expect competitive offers; lowballing is unlikely to land.
- 2 sale attempts since 26y ago; this cycle's ask is 99% above the opening price — seller raised mid-cycle; expect resistance to lowballs.
- Current owner paid $750k; list at $1.50M implies a 99% gain — meaningful room to come down on a strong offer.
Risks & watch-outs
- Watch-outs: built in 1929 — expect roof / HVAC / electrical / plumbing capex.
- Climate carrying-cost: major wind risk, 27% chance of damaging wind over 30y; extreme-heat days projected 7→16/yr by 2055 (HVAC capex compounding) — expect insurance premiums to compound above CPI over the hold.
Questions for the listing agent
- What do current leases actually rent for vs. the listed asking? Can we see a recent rent roll and the last 12 months of T-12 income?
- Built in 1929 — when were the roof, HVAC, electrical panel, plumbing, and water heater last replaced?
- Is there a deadline driving the sale (1031 exchange, divorce, estate, relocation)? That informs how much negotiation room exists.
- What's the average days-on-market for RENTAL listings here right now (not sales)? A rising rental-DOM trend means longer vacancies and softer asking-rent achievability than the comps imply.
- What's the recent tenant-quality profile in this submarket — average credit score on applications, eviction rate, late-payment / NSF rate, and stable-employment percentage? A property-management company in the area should have these aggregated.
- How much new for-sale + rental construction is in the pipeline within 1–3 miles? Heavy new supply typically softens prices + rents 12–24 months out; constrained supply supports both.
Investment metrics
- 1% rule
- 0.87% ✗
- Cap rate
- 6.04%
- Cash-on-cash
- -0.91%
- DSCR
- 0.96
- GRM
- 9.5
CMA / ARV
- ARV (on-the-fly)
- $1,960,000
- Comps found
- 12
Show comp detail 12 sales within ~0.75 mi
| Address | Dist | Beds/Ba | Sqft | Sold | Price | $/sf | Match |
|---|---|---|---|---|---|---|---|
| 27 Villa Rd | 0.31mi | 4/4.5 | 2,810 (+0%) | 7mo | $1,980,000 | $705 | 75 |
| 2 Springdale Rd | 0.62mi | 5/3.0 (+1) | 2,744 (-2%) | 1mo | $1,955,000 | $712 | 60 |
| 39 Larchwood Rd | 0.57mi | 5/3.0 (+1) | 2,884 (+3%) | 9mo | $1,580,000 | $548 | 54 |
| 1 Meadowood Path | 0.57mi | 4/3.5 | 2,577 (-8%) | 8mo | $1,237,500 | $480 | 53 |
| 34 Dante St | 0.64mi | 5/3.5 (+1) | 2,938 (+5%) | 8mo | $1,851,000 | $630 | 50 |
| 566 Forest Ave | 0.65mi | 3/3.0 (-1) | 2,709 (-3%) | 9mo | $1,655,000 | $611 | 50 |
| 35 Byron Ln | 0.58mi | 3/3.5 (-1) | 2,471 (-12%) | 1mo | $1,930,000 | $781 | 48 |
| 1 Highridge Rd | 0.73mi | 5/3.0 (+1) | 2,634 (-6%) | 3mo | $2,001,000 | $760 | 46 |
| 223 Rockingstone Ave | 0.60mi | 5/3.5 (+1) | 3,070 (+10%) | 9mo | $2,150,000 | $700 | 44 |
| 96 Highridge Rd | 0.60mi | 4/3.0 | 2,445 (-13%) | 9mo | $1,320,000 | $540 | 41 |
| 14 Maple Hill Dr | 0.69mi | 4/2.5 | 2,380 (-15%) | 0mo | $2,405,000 | $1,011 | 39 |
| 461 Pinebrook Blvd | 0.62mi | 3/2.0 (-1) | 3,172 (+13%) | 3mo | $920,000 | $290 | 35 |
Match score weights: distance 35% · size 25% · config 20% · recency 20%. Top-matched comps best support the ARV.
Projected returns pro-forma
-3.0% appreciation · 3.0% rent growth · sell at horizon
- IRR
- -17.8%
- Equity multiple
- 0.37×
- Total profit
- $-262,050
- Equity at exit
- $222,909
- IRR
- -9.8%
- Equity multiple
- 0.40×
- Total profit
- $-252,616
- Equity at exit
- $129,260
Cash invested: $418,600 (down + closing). Projections, not guarantees.
Landlord ↔ Tenant lean methodology
- Overall (STATE)
- 15 Strongly Tenant-Friendly
- State New York
- 15 Strongly Tenant-Friendly · D+10
- County
- — inherits STATE
- City
- — inherits STATE
ZIP-level market 10538
- Active inventory
- 139
- Price-to-rent
- 9.5×
Monthly cashflow live
- Estimated rent
- $13,059 medium interval (Pro) →
- Mortgage (P&I)
- −$7,840
- Tax from tax record
- −$2,171 /mo · $26,051/yr
- Insurance
- −$623
- HOA
- −$0
- Vacancy / Maint / Mgmt
- −$2,742
- Net cashflow
- $-317
Break-even live
Sensitivity live
| Price | -10% $529 | -5% $106 | +0% $-317 | +5% $-740 | +10% $-1,163 |
|---|---|---|---|---|---|
| Rent | -10% $-1,349 | -5% $-833 | +0% $-317 | +5% $199 | +10% $715 |
| Rate | -1.0pp $436 | -0.5pp $63 | base $-317 | +0.5pp $-704 | +1.0pp $-1,098 |
UW: 25.0% down · 7.5% · 30yr · 1.5% tax · 5.0% vac · 8.0% maint · 8.0% mgmt
Financing live
Cash to close
- Down payment
- $373,750
- Closing costs
- $44,850
- Reserves months
- —
- Total cash needed
- —
Loan-product check · same deal, 3 products live
Conventional
25% down · 7.5% · 30yr
- Down + closing
- —
- Monthly P&I
- —
- Monthly cashflow
- —
- DSCR
- —
- Eligible?
- —
Personal DTI + credit; lowest rate.
DSCR
20% down · 8.5% · 30yr
- Down + closing
- —
- Monthly P&I
- —
- Monthly cashflow
- —
- DSCR
- —
- Eligible?
- —
No personal income docs; deal must DSCR.
Hard money
10% down · 12.0% · 12mo
- Down + closing
- —
- Monthly P&I
- —
- Monthly cashflow
- —
- DSCR
- —
- Eligible?
- —
Short-term bridge; refi at stabilization.
Rent comps 4 comps
| Address | Beds | Baths | Sqft | Rent | $/sqft | DOM | Units | Dist |
|---|---|---|---|---|---|---|---|---|
| 19 Bonnie Way Larchmont, NY | 4.0 | 3.0 | 2700 | $14,000 | $5.19 | 14d | 1 | 0.15mi |
| 6 Hidden Green Ln Larchmont, NY | 4.0 | 3.5 | 3844 | $12,000 | $3.12 | 0d | 1 | 0.55mi |
| 49 N Chatsworth Ave Larchmont, NY | 4.0 | 3.5 | 2402 | $9,950 | $4.14 | 4d | 1 | 0.97mi |
| 75 Lord Kitchener Rd New Rochelle, NY | 4.0 | 4.5 | 3032 | $10,000 | $3.30 | 6d | 1 | 1.42mi |
Listing history 4 events
-
2026-06-21days on market $1,495,000 Coming Soon 4 DOM
-
2026-06-18remarks 699-char remark
-
2026-06-17remarks 169-char remark
-
2026-06-17$1,495,000 Coming Soon 1 DOM
ⓘ Source: listings_history table (triggers on properties + properties_extension) + one-shot
backfill from property_details.listing_events for pre-trigger history.
Tax reassessment forecast NY · Partial reset (capped growth)
- Current annual tax
- $26,051 · $2,171/mo
- Projected year-2 tax
- $26,051 · $2,171/mo
- Expected delta
- $0/yr ($0/mo · 0.0%)
ⓘ Screening estimate from a state-policy table — verify with the county assessor before closing.
Climate risk First Street
- Flood 1/10 Low FEMA zone X (unshaded) · 0% chance over 30 yrs
- Wildfire 1/10 Low
- Heat 6/10 Major 7 d/yr ≥98°F today · 16 d/yr by 30 yrs out
- Wind 6/10 Major 27% chance of damaging wind over 30 yrs
- Air quality 5/10 Major 6 unhealthy d/yr today · 8 by 30 yrs out
Nearby sold comps map
Loading sold comps map…
Walkable amenities ~0.75 mi
Loading nearby amenities…
Taxation est. · year 1
- Rental income
- $156,714
- − Mortgage interest
- −$83,743
- − Property taxes
- −$26,051
- − Insurance
- −$7,475
- − Repairs & maintenance
- −$12,537
- − Management
- −$12,537
- − Depreciation
- −$43,491
- Taxable loss
- −$29,121
- Est. tax savings @ 24.0%
- +$6,989
- After-tax cash flow
- $3,187/yr
For passive investors: Depreciation is non-cash, so a rental often shows a tax loss while cash-flowing — sheltering income. Rental losses are passive: they offset passive income freely, and up to $25,000/yr can offset ordinary (W-2) income if you actively participate and your MAGI is under $100k (phasing out to $0 by $150k); unused losses carry forward. On sale, claimed depreciation is recaptured at up to 25%, and gains may owe capital-gains tax (a 1031 exchange can defer both). Figures are a year-1 estimate at your 24.0% rate — not tax advice; consult a CPA.
Schools (NCES district)
- District
- Mamaroneck Union Free School District
- NCES district ID
- 3618240
- Math proficiency
- 74% ▼ -4.00%
- Reading proficiency
- 81% ▲ 9.00%
- Median HH income
- $111,011
- Composite
- 71.4/100
- National rank
- #228
- State rank
- #47 of 590 in NY
Livability — New Rochelle
- Score
- 69/100
- State rank
- #487
- US rank
- #8572
Category grades
Schools grade is shown separately in the Schools card above.
Census & demographics
- City population
- 63,657
- Population (ZIP)
- 17,709
Population outlook (Westchester County) Hauer SSP2
- Today (2025)
- 1,028,035 people
- By 2030
- 1,051,636 · +2.3%
- By 2040
- 1,098,520 · +6.9%
- By 2050
- 1,136,044 · +10.5%
- By 2075
- 1,196,925 · +16.4%
- By 2100
- 1,175,147 · +14.3%
Race, ethnicity, and origin ACS 2023
- Neighborhood character
- Predominantly White (78%)
- Race & ethnicity
- White 78% Two or more races 10% Hispanic / Latino 9% Black 4% Asian 4%
- Hispanic origin (detail)
- Puerto Rican 3%
- Common ancestry
- Scotch-Irish 5% Italian 3% Romanian 3%
- Foreign-born
- 16% · Canada, Jamaica, China
- Languages at home
- 83% English-only · Spanish 5% Other Indo-European 4% French/Haitian/Cajun 2%
Political lean MEDSL · Westchester
- 2024 margin
- Strong D (+26.3) · D 63.1% · R 36.9%
- 2008→2024 swing
- -1.3pp toward R · 2008: 27.6pp · 2024: 26.3pp
- All cycles
- 2024: D+26.3 2020: D+36.3 2016: D+32.8 2012: D+22.2 2008: D+27.6
Not yet ingested
- Civics
- —
Market trends
- HPI YoY
- ▼ -535.56%
- Current HPI
- 325.1393
- Rent YoY
- —
- Metro
- —
- State GDP YoY
- ▲ 2.60%
- F500 in state
- 92
Industry mix (Fortune 500 HQ in NY)
| Industry | F500 HQs | Revenue |
|---|---|---|
| Financial Services | 10 | $950B |
|
||
| Consumer Goods | 9 | $162B |
|
||
| Insurance | 4 | $225B |
|
||
| Telecommunications | 2 | $144B |
|
||
| Pharmaceuticals | 2 | $112B |
|
||
| Media / Entertainment | 2 | $69B |
|
||
Price history
+346.3% since first listed13 events — show timeline
- 2026-06-17 Coming Soon $1,495,000 OneKey® MLS as Distributed by MLS Grid
- 2014-01-27 Price Changed $734,500 HGMLS
- 2003-03-11 Sold (Public Records) $750,000 Public Records
- 2003-01-23 Sold (MLS) $750,000 HGMLS
- 2002-11-11 Delisted — HGMLS
- 2002-10-24 Listed $750,000 HGMLS
- 2000-12-07 Sold (Public Records) $614,000 Public Records
- 2000-10-18 Sold (MLS) $614,000 HGMLS
- 2000-07-17 Price Changed $620,000 HGMLS
- 2000-07-17 Delisted — HGMLS
- 2000-05-23 Listed $614,000 HGMLS
- 1996-05-28 Sold (Public Records) $430,000 Public Records
- 1991-02-28 Sold (Public Records) $335,000 Public Records
Property tax history
-0.2%/yrLatest (2025): $26,051 · +4.5% YoY. Source: county tax records.
Cash-flow waterfall
monthlySold comps — $/sqft
last 12 mo · ≤1 miLoading sold comps…