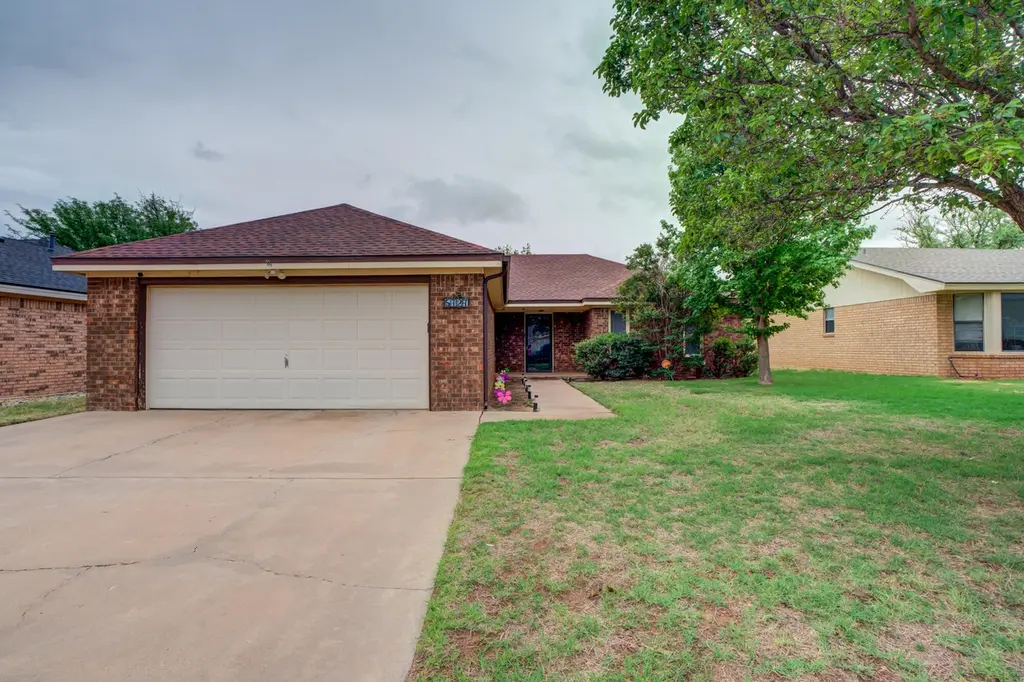
5727 92nd St · Lubbock, TX
Flood risk 1/10 · Minimal
- FEMA flood zone
- X (unshaded)
- Chance of flooding over 30 yrs
- 0.0%
- Est. flood insurance / yr
- $507 – $1,088
Fire risk 1/10 · Minimal
- Est. fire insurance / yr
- $1,222 – $2,270
Heat risk 5/10 · Moderate
- Hot days now (above 99°F)
- 7 days/yr
- Hot days in 30 yrs
- 21 days/yr
Wind risk 2/10 · Minimal
- Chance of severe wind over 30 yrs
- —
Air-quality risk 2/10 · Minimal
- Unhealthy air days now
- 1 days/yr
- Unhealthy air days in 30 yrs
- 1 days/yr
Risk factors via First Street. Map © Google.
Why this score? — see what drove the D- grade
The composite is a weighted blend of 9 inputs, each scored 0–100. Each bar is that input's sub-score; the figure is the points it added to the 100-point composite (weight × sub-score).
- Cash flow +12.1/30.0
- ARV discount +7.5/15.0
- Livability +4.0/5.0
- 1% rule +3.9/10.0
- DSCR +3.6/10.0
- Rent growth +3.2/5.0
- Schools +3.1/10.0
- Condition / age +2.5/5.0
- Appreciation +0.0/10.0
$199,000
🖨 Deal sheet (PDF) 📄 Offer letter ✓ Due diligence
Listing remarks MLS
Well kept 3/2/2 brick home on a quiet cul-de-sac in The Meadows neighborhood. Living room features vaulted ceiling, laminate flooring, fireplace, and built-in bookshelves. Isolated master suite has coffered ceiling, laminate flooring and double vanity sinks in bathroom. Kitchen is light and bright with vaulted ceiling, skylight and has easy care vinyl plank flooring. Nice backyard with covered patio, shade tree, and 10 x 12 Tuff Shed. Walking distance to city park with playground, small lake, tennis courts, and walking paths.
Key facts
- En suite bath
- Built-in bookshelves
- Coffered ceiling
Tags
Property features AI
Finance
- Other: Residential single-family property
Exterior
- Parking: Attached garage with 2 spaces; Driveway and on-street parking
- Security: Smoke detectors; Carbon monoxide detectors
- Utilities: Public water; Public sewer; Electricity connected; Natural gas connected; Natural gas available
- Home design: Single-family residential property
- Construction: Brick construction; Slab foundation; Built in 1,531 above-grade finished area
- Exterior features: Covered front and rear porches with awnings; Porch; Storm door(s); Fenced backyard with wood fencing; Composition roof; Many trees; Paved public-maintained city street frontage
Interior
- Kitchen: Disposal; Dishwasher; Electric cooktop; Oven; Microwave; Pantry
- Flooring: Carpet; Laminate; Vinyl
- Bathrooms: 2 full bathrooms
- Heating & cooling: Central heating (natural gas); Central air conditioning; Ceiling fans
- Interior features: Built-in features and bookcases; Ceiling fans; Double vanity; Pantry; Walk-in closet(s); Blinds and double-pane windows; Gas-starter, wood-burning fireplace in the living room
- Laundry & utility: Dedicated laundry room
Neighborhood map
What this means for you Summary
Snapshot
- This is a 3-bed/2.0-bath single-family listed at $199k.
Deal economics
- At list price, monthly cash flow is $-45 ($-540/yr) — negative.
- To cash-flow at today's rent, offer at most $191k (4.0% below list).
- To meet the 1% rule (rent ≥ 1% of price), the offer needs to be $178k (10.8% below list).
- Recommended offer: $178k (10.8% below list) — sets the bar for 1% rule.
Location & tenants
- Location reads 80/100 on livability (#37 in TX, #1,749 nationally) — a professional / high-income tenant draw. Strengths: commute A+, cost of living A+, housing A+; Watch: employment C-, schools D+, crime F.
- Lubbock ISD (urban): math 36% / reading 39% proficiency, ranked #481 of 826 in TX (top 58%) — families likely to look elsewhere, expect single-tenant / working-renter base with shorter leases; 60% free/reduced lunch — lower-income household profile, screen leases tightly.
- Market conditions: Rents rising (+2.8%/yr); 707 active listings in the ZIP; 28 comparable units currently listed for rent nearby; rentals at typical pace (median 23d on market — plan ~3-4 weeks tenant-placement turnaround); solid renter incomes; 2,219 units permitted in Lubbock County in 2024 (252 in 5+ unit buildings).
Forward outlook
- Local home prices are declining (-3.0%/yr); year-one equity from $1k of loan paydown is wiped out by about $6k of value loss. Plan a longer hold.
- Lubbock County population projected at +39% by 2050 — long-run rental-demand tailwind backs the buy-and-hold thesis.
Negotiation context
- Only 7 days on market — expect competitive offers; lowballing is unlikely to land.
- 3 sale attempts since 9y ago with the ask held roughly flat each time — persistent listings suggest the price (not the market) is what's stuck; bring a comps-based counter.
Risks & watch-outs
- Climate carrying-cost: extreme-heat days projected 7→21/yr by 2055 (HVAC capex compounding) — expect insurance premiums to compound above CPI over the hold.
Questions for the listing agent
- What do current leases actually rent for vs. the listed asking? Can we see a recent rent roll and the last 12 months of T-12 income?
- Is there a deadline driving the sale (1031 exchange, divorce, estate, relocation)? That informs how much negotiation room exists.
- Schools are D-rated, which usually means shorter tenancies and higher turnover. Who's the typical renter profile here, and what's been the actual vacancy rate?
- Crime grade is F in this area — have there been break-ins, vandalism, or insurance claims at this property in the last 3 years? What carrier currently insures it and at what premium?
- The area grade is low — what's the realistic commute time and amenity access for the typical tenant pool here? Any planned neighborhood developments (good or bad) we should know about?
- What's the average days-on-market for RENTAL listings here right now (not sales)? A rising rental-DOM trend means longer vacancies and softer asking-rent achievability than the comps imply.
- What's the recent tenant-quality profile in this submarket — average credit score on applications, eviction rate, late-payment / NSF rate, and stable-employment percentage? A property-management company in the area should have these aggregated.
- How much new for-sale + rental construction is in the pipeline within 1–3 miles? Heavy new supply typically softens prices + rents 12–24 months out; constrained supply supports both.
Investment metrics
- 1% rule
- 0.89% ✗
- Cap rate
- 6.02%
- Cash-on-cash
- -0.97%
- DSCR
- 0.96
- GRM
- 9.3
CMA / ARV
No comps found within radius.
Projected returns pro-forma
-3.0% appreciation · 2.75% rent growth · sell at horizon
- IRR
- -18.1%
- Equity multiple
- 0.36×
- Total profit
- $-35,488
- Equity at exit
- $29,672
- IRR
- -10.8%
- Equity multiple
- 0.35×
- Total profit
- $-36,124
- Equity at exit
- $17,206
Cash invested: $55,720 (down + closing). Projections, not guarantees.
Landlord ↔ Tenant lean methodology
- Overall (STATE)
- 87 Strongly Landlord-Friendly
- State Texas
- 87 Strongly Landlord-Friendly · R+5
- County
- — inherits STATE
- City
- — inherits STATE
ZIP-level market 79424
- Rents YoY
- 2.8%
- Active inventory
- 707
- Price-to-rent
- 9.3×
Monthly cashflow live
- Estimated rent
- $1,775 high interval (Pro) →
- Mortgage (P&I)
- −$1,044
- Tax from tax record
- −$321 /mo · $3,850/yr
- Insurance
- −$83
- HOA
- −$0
- Vacancy / Maint / Mgmt
- −$373
- Net cashflow
- $-45
Break-even live
Sensitivity live
| Price | -10% $68 | -5% $11 | +0% $-45 | +5% $-101 | +10% $-158 |
|---|---|---|---|---|---|
| Rent | -10% $-185 | -5% $-115 | +0% $-45 | +5% $25 | +10% $95 |
| Rate | -1.0pp $55 | -0.5pp $6 | base $-45 | +0.5pp $-97 | +1.0pp $-149 |
UW: 25.0% down · 7.5% · 30yr · 1.5% tax · 5.0% vac · 8.0% maint · 8.0% mgmt
Financing live
Cash to close
- Down payment
- $49,750
- Closing costs
- $5,970
- Reserves months
- —
- Total cash needed
- —
Loan-product check · same deal, 3 products live
Conventional
25% down · 7.5% · 30yr
- Down + closing
- —
- Monthly P&I
- —
- Monthly cashflow
- —
- DSCR
- —
- Eligible?
- —
Personal DTI + credit; lowest rate.
DSCR
20% down · 8.5% · 30yr
- Down + closing
- —
- Monthly P&I
- —
- Monthly cashflow
- —
- DSCR
- —
- Eligible?
- —
No personal income docs; deal must DSCR.
Hard money
10% down · 12.0% · 12mo
- Down + closing
- —
- Monthly P&I
- —
- Monthly cashflow
- —
- DSCR
- —
- Eligible?
- —
Short-term bridge; refi at stabilization.
Rent comps 28 comps
| Address | Beds | Baths | Sqft | Rent | $/sqft | DOM | Units | Dist |
|---|---|---|---|---|---|---|---|---|
| 5731 90th St Lubbock, TX | 3.0 | 2.0 | 1504 | $1,650 | $1.10 | 22d | 1 | 0.10mi |
| 5560 93rd St Lubbock, TX | 3.0 | 2.0 | 1370 | $1,395 | $1.02 | 22d | 1 | 0.23mi |
| 5545 93rd St Lubbock, TX | 3.0 | 2.0 | 1370 | $1,450 | $1.06 | 45d | 1 | 0.28mi |
| 5706 87th Pl Lubbock, TX | 3.0 | 2.0 | 1544 | $1,550 | $1.00 | 14d | 1 | 0.30mi |
| 5513 95th St Lubbock, TX | 3.0 | 2.0 | 1785 | $1,575 | $0.88 | 22d | 1 | 0.42mi |
| 9806 Genoa Ave Lubbock, TX | 4.0 | 2.0 | 1763 | $2,050 | $1.16 | 45d | 1 | 0.46mi |
| 5523 101st St Lubbock, TX | 3.0 | 2.0 | 1901 | $2,100 | $1.10 | 22d | 1 | 0.62mi |
| 5703 80th St Lubbock, TX | 3.0 | 2.0 | 2133 | $2,295 | $1.08 | 45d | 1 | 0.80mi |
| 9701 Abbeville Ave Lubbock, TX | 3.0 | 2.0 | 1817 | $1,750 | $0.96 | 22d | 1 | 0.85mi |
| 5216 94th St Lubbock, TX | 3.0 | 2.0 | 1557 | $1,900 | $1.22 | 22d | 1 | 0.86mi |
| 9616 Kline Ave Lubbock, TX | 3.0 | 2.0 | 2198 | $2,150 | $0.98 | 45d | 1 | 0.91mi |
| 5806 78th St Lubbock, TX | 3.0 | 2.0 | 1985 | $1,800 | $0.91 | 45d | 1 | 0.93mi |
| 7911 Albany Ave Unit B Lubbock, TX | 2.0 | 2.0 | 1441 | $1,350 | $0.94 | 14d | 1 | 1.07mi |
| 7911 Albany Ave Unit A Lubbock, TX | 3.0 | 2.0 | 1441 | $1,350 | $0.94 | 22d | 1 | 1.07mi |
| 10502 Beaufort Ave Lubbock, TX | 3.0 | 2.0 | 1760 | $2,399 | $1.36 | 45d | 1 | 1.08mi |
| 5507 108th St Lubbock, TX | 3.0 | 2.0 | 1587 | $1,550 | $0.98 | 22d | 1 | 1.08mi |
| 10506 Beaufort Ave Lubbock, TX | 3.0 | 2.0 | 1760 | $2,399 | $1.36 | 45d | 1 | 1.09mi |
| 10510 Bangor Ave Lubbock, TX | 4.0 | 2.0 | 2152 | $2,650 | $1.23 | 15d | 1 | 1.15mi |
| 5534 111th St Lubbock, TX | 3.0 | 2.0 | 1415 | $1,800 | $1.27 | 15d | 1 | 1.18mi |
| 6024 74th St Lubbock, TX | 4.0 | 2.0 | 1997 | $1,999 | $1.00 | 45d | 1 | 1.25mi |
| 5415 73rd St Lubbock, TX | 3.0 | 2.0 | 1725 | $1,849 | $1.07 | 22d | 1 | 1.28mi |
| 6553 89th St Lubbock, TX | 3.0 | 2.0 | 1564 | $1,575 | $1.01 | 22d | 1 | 1.32mi |
| 6550 85th St Lubbock, TX | 3.0 | 2.0 | 1711 | $1,700 | $0.99 | 22d | 1 | 1.37mi |
| 10903 Norwich Ave Lubbock, TX | 3.0–4.0 | 2.0–3.0 | 1613 | $2,099 | $1.30 | 14d | 2 | 1.44mi |
| 5240 114th St Lubbock, TX | 1.0–2.0 | 1.0–2.0 | 948 | $1,384 | $1.46 | 14d | 7 | 1.45mi |
| 6717 89th St Lubbock, TX | 3.0 | 2.0 | 1991 | $1,725 | $0.87 | 22d | 1 | 1.45mi |
| 6904 Freeport Ave Lubbock, TX | 3.0 | 2.0 | 1820 | $2,150 | $1.18 | 45d | 1 | 1.47mi |
| 5715 69th St Lubbock, TX | 3.0 | 2.0 | 1796 | $1,725 | $0.96 | 45d | 1 | 1.48mi |
Listing history 10 events
-
2026-06-17status $199,000 Pending 7 DOM
-
2026-06-17days on market $199,000 Active 7 DOM
-
2026-06-16days on market $199,000 Active 6 DOM
-
2026-06-15status $199,000 Active 5 DOM
-
2026-06-13statusdays on market $199,000 Pending 5 DOM
-
2026-06-10days on market $199,000 Active 4 DOM
-
2026-06-09days on market $199,000 Active 3 DOM
-
2026-06-08days on market $199,000 Active 2 DOM
-
2026-06-07remarks 699-char remark
-
2026-06-07$199,000 Active 1 DOM
ⓘ Source: listings_history table (triggers on properties + properties_extension) + one-shot
backfill from property_details.listing_events for pre-trigger history.
Tax reassessment forecast TX · Resets to sale price
- Current annual tax
- $3,850 · $321/mo
- Projected year-2 tax
- $3,850 · $321/mo
- Expected delta
- $0/yr ($0/mo · 0.0%)
ⓘ Screening estimate from a state-policy table — verify with the county assessor before closing.
Climate risk First Street
- Flood 1/10 Low FEMA zone X (unshaded) · 0% chance over 30 yrs
- Wildfire 1/10 Low
- Heat 5/10 Major 7 d/yr ≥99°F today · 21 d/yr by 30 yrs out
- Wind 2/10 Low
- Air quality 2/10 Low 1 unhealthy d/yr today · 1 by 30 yrs out
Nearby sold comps map
Loading sold comps map…
Walkable amenities ~0.75 mi
Loading nearby amenities…
Taxation est. · year 1
- Rental income
- $21,301
- − Mortgage interest
- −$11,147
- − Property taxes
- −$3,850
- − Insurance
- −$995
- − Repairs & maintenance
- −$1,704
- − Management
- −$1,704
- − Depreciation
- −$5,789
- Taxable loss
- −$3,888
- Est. tax savings @ 24.0%
- +$933
- After-tax cash flow
- $393/yr
For passive investors: Depreciation is non-cash, so a rental often shows a tax loss while cash-flowing — sheltering income. Rental losses are passive: they offset passive income freely, and up to $25,000/yr can offset ordinary (W-2) income if you actively participate and your MAGI is under $100k (phasing out to $0 by $150k); unused losses carry forward. On sale, claimed depreciation is recaptured at up to 25%, and gains may owe capital-gains tax (a 1031 exchange can defer both). Figures are a year-1 estimate at your 24.0% rate — not tax advice; consult a CPA.
Schools (NCES district)
- District
- Lubbock ISD
- NCES district ID
- 4828500
- Math proficiency
- 36% ▼ -8.00%
- Reading proficiency
- 39% ▼ -1.00%
- Median HH income
- $39,820
- Composite
- 31.44/100
- National rank
- #5984
- State rank
- #481 of 826 in TX
Livability — Lubbock
- Score
- 80/100
- State rank
- #37
- US rank
- #1749
Category grades
Schools grade is shown separately in the Schools card above.
Census & demographics
- Census place
- Lubbock, TX
- County
- Lubbock County · 293,542 people
- City population
- 283,030
- Metro
- Lubbock, TX
- Population (ZIP)
- 53,478
- Household income
- $97,231
- Rent vs Own
- Severe rent burden
- 1958.0
Population outlook (Lubbock County) Hauer SSP2
- Today (2025)
- 345,960 people
- By 2030
- 371,449 · +7.4%
- By 2040
- 424,539 · +22.7%
- By 2050
- 481,150 · +39.1%
- By 2075
- 633,467 · +83.1%
- By 2100
- 746,853 · +115.9%
Race, ethnicity, and origin ACS 2023
- Neighborhood character
- Predominantly White (71%)
- Race & ethnicity
- White 71% Hispanic / Latino 21% Two or more races 12% Asian 3% Black 2%
- Hispanic origin (detail)
- Mexican 17%
- Common ancestry
- Slovak 2% Italian 2% Lithuanian 1%
- Foreign-born
- 6% · Canada, China
- Languages at home
- 88% English-only · Spanish 8% Chinese 1% Tagalog/Filipino 1%
Political lean MEDSL · Lubbock
- 2024 margin
- Solid R (+39.5) · D 29.7% · R 69.2% · Other 1.0%
- 2008→2024 swing
- -2.8pp toward R · 2008: -36.7pp · 2024: -39.5pp
- All cycles
- 2024: R+39.5 2020: R+32.2 2016: R+38.4 2012: R+40.9 2008: R+36.7
Not yet ingested
- Civics
- —
Market trends
- HPI YoY
- ▼ -146.64%
- Current HPI
- 213.2155
- Rent YoY
- ▲ 2.75%
- Metro
- Lubbock, TX
- State GDP YoY
- ▲ 3.95%
- F500 in state
- 110
Industry mix (Fortune 500 HQ in TX)
| Industry | F500 HQs | Revenue |
|---|---|---|
| Energy | 16 | $1,198B |
|
||
| Technology | 5 | $198B |
|
||
| Engineering / Construction | 4 | $72B |
|
||
| Energy Services | 3 | $60B |
|
||
| Utilities | 3 | $41B |
|
||
| Healthcare | 2 | $330B |
|
||
Price history
+59.2% since first listed10 events — show timeline
- 2026-06-06 Listed $199,000 LARMLS
- 2020-05-27 Sold (Public Records) — Public Records
- 2020-05-27 Sold (MLS) — LARMLS
- 2020-04-06 Listed $152,600 LARMLS
- 2017-03-27 Sold (Public Records) — Public Records
- 2017-03-24 Sold (MLS) — LARMLS
- 2017-02-24 Listed $125,000 LARMLS
- 2008-03-24 Sold (Public Records) — Public Records
- 2006-08-28 Sold (Public Records) — Public Records
- 2002-06-21 Sold (Public Records) — Public Records
Property tax history
+3.9%/yrLatest (2025): $3,850 · +1.6% YoY. Source: county tax records.
Cash-flow waterfall
monthlySold comps — $/sqft
last 12 mo · ≤1 miLoading sold comps…