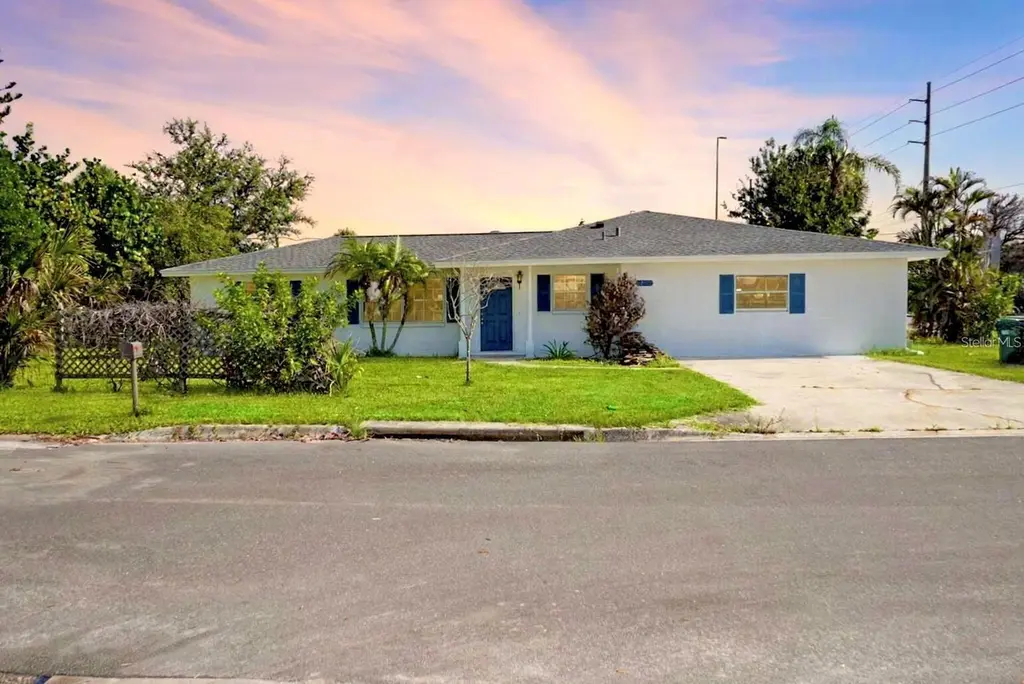
1796 Florence Ave · Englewood, FL
Flood risk 9/10 · Severe
- FEMA flood zone
- AE
- Chance of flooding over 30 yrs
- 0.99%
- Est. flood insurance / yr
- $1,737 – $8,500
Fire risk 3/10 · Minor
- Est. fire insurance / yr
- $947 – $1,759
Heat risk 10/10 · Severe
- Hot days now (above 107°F)
- 7 days/yr
- Hot days in 30 yrs
- 30 days/yr
Wind risk 10/10 · Severe
- Chance of severe wind over 30 yrs
- 99.0%
Air-quality risk 2/10 · Minimal
- Unhealthy air days now
- 1 days/yr
- Unhealthy air days in 30 yrs
- 1 days/yr
Risk factors via First Street. Map © Google.
Why this score? — see what drove the C+ grade
The composite is a weighted blend of 9 inputs, each scored 0–100. Each bar is that input's sub-score; the figure is the points it added to the 100-point composite (weight × sub-score).
- Cash flow +24.5/30.0
- DSCR +7.9/10.0
- ARV discount +7.5/15.0
- 1% rule +5.6/10.0
- Rent growth +4.8/5.0
- Schools +4.6/10.0
- Livability +3.7/5.0
- Condition / age +2.5/5.0
- Appreciation +0.0/10.0
$299,000
🖨 Deal sheet 📄 Offer letter ✓ Due diligence
Listing remarks
Double Lot! Double Lot! Double Lot! This tastefully renovated 3-bedroom, 2-bathroom 2160 sq ft home boasts many features. New roof, new A/C, newly remodeled kitchen and bath and did we mention the DOUBLE LOT? Quick access to all that beautiful Englewood has to offer, 5 minutes to Englewood beach, boat launches, golf courses, top notch restaurants, schools and hospitals. Room for your RV, boat or any toy you can think of. This property is perfect for a primary home, long term rental or vacation rental. It’s just a short drive to Venice, North Port and Port Charlotte. This move-in ready home blends modern comfort with coastal charm. Check it out before it’s gone! AT SELLER'S
Key facts
- Double lot
- New a/c
- Newly remodeled bath
Tags
Property features AI
Finance
- Other: Property type: Residential — Single Family Residence; Zoning: RSF5; Living area reported as 2,160 sq ft (public records); total building area 3,000 sq ft; Lot described as 1/4 to less than 1/2 acre; Directions: Drive east on East Dearborn St/CR 777. Right to Pine St. Right to Florence Ave. Property is on the right.
- HOA & community: No HOA association indicated; Pets allowed
Exterior
- Parking: Driveway access (asphalt road)
- Utilities: Public water; Public sewer; Cable connected
- Home design: Single family residence; One story; Faces west
- Construction: Block construction; Shingle roof; Slab foundation; Built on a 0.43-acre lot (approx. 85 x 105)
- Exterior features: French doors; Private mailbox; Oversized lot; Flood zone
Interior
- Kitchen: Built-in oven; Range; Range hood; Microwave; Refrigerator; Freezer; Dishwasher; Disposal; Exhaust fan
- Bedrooms: 3 bedrooms
- Flooring: Ceramic tile; Tile flooring
- Bathrooms: 2 full bathrooms
- Heating & cooling: Heat pump heating; Central air conditioning
- Interior features: Ceiling fans; Open floorplan; Walk-in closets; Dining area (l-shaped)
- Laundry & utility: No laundry features listed
Neighborhood map
What this means for you Summary
Snapshot
- This is a 3-bed/2.0-bath single-family listed at $299k.
Deal economics
- At list price, monthly cash flow is $185 ($2k/yr) — positive.
- The deal already cash-flows at list — no discount required.
- Meets the 1% rule at list price ($3k rent vs $299k).
- Recommended offer: $263k (12.0% below list) — sets the bar for market timing.
- Cap rate 8.7% vs local median 3.8% in Englewood — top-decile yield for the area; either an underpriced asset or a hidden risk that comps aren't pricing in. Stress-test before assuming the spread holds.
Location & tenants
- Location reads 73/100 on livability (#321 in FL) — a middle-class / working-renter tenant base. Strengths: housing A+, cost of living A, health & safety A; Watch: employment C-, amenities F, commute F.
- Charlotte (suburban): math 54% / reading 54% proficiency, ranked #22 of 73 in FL (top 30%) — acceptable for families but not a draw, mixed tenant base, ~2y average lease.
- Market conditions: Rents rising fast (+9.0%/yr); 717 active listings in the ZIP; 3 comparable units currently listed for rent nearby; rentals at typical pace (median 21d on market — plan ~3-4 weeks tenant-placement turnaround); solid renter incomes; 4,585 units permitted in Charlotte County in 2024 (703 in 5+ unit buildings).
- At $3,158/mo this rent would consume 50% of the median local household income ($76k/yr) (locally 290% of renters already pay >50% of income on rent) — very limited rent-growth headroom before tenants either downsize or default.
Forward outlook
- Local home prices are declining (-3.0%/yr); year-one equity from $2k of loan paydown is wiped out by about $9k of value loss. Plan a longer hold.
- Charlotte County population projected at +24% by 2050 — long-run rental-demand tailwind backs the buy-and-hold thesis.
- At projected returns (-3.0% appreciation + 8.0% rent growth), your $84k cash investment doubles in ~10 years — after that, you're playing with house money.
Negotiation context
- It's been on market 153 days — a 12% lower offer ($263k) is reasonable based on typical stale-listing flexibility.
- 5 sale attempts since 15y ago; this cycle's ask is 14138% above the opening price — seller raised mid-cycle; expect resistance to lowballs.
- Current owner paid $69k; list at $299k implies a 335% gain — meaningful room to come down on a strong offer.
Risks & watch-outs
- Watch-outs: flood insurance adds $427/mo.
- Climate carrying-cost: in FEMA flood zone AE (mandatory federal flood insurance); severe wind risk, 99% chance of damaging wind over 30y; extreme-heat days projected 7→30/yr by 2055 (HVAC capex compounding) — expect insurance premiums to compound above CPI over the hold.
Questions for the listing agent
- It's been on market 153 days. Have you received any prior offers? Is the seller open to a 12% concession, seller financing, or rate buy-down credit?
- Built in 1974 — when were the roof, HVAC, electrical panel, plumbing, and water heater last replaced?
- What's the actual annual flood-insurance premium (NFIP or private), and is the property in a SFHA with mandatory coverage?
- Why hasn't it sold? Are there any deal-killer items the seller is aware of (foundation, flood, title, zoning, code violations)?
- Is there a deadline driving the sale (1031 exchange, divorce, estate, relocation)? That informs how much negotiation room exists.
- Schools are A-rated — typically a magnet for longer-tenancy family renters. What's the average tenant stay here, and is there a school-zone premium baked into asking?
- What's the average days-on-market for RENTAL listings here right now (not sales)? A rising rental-DOM trend means longer vacancies and softer asking-rent achievability than the comps imply.
- What's the recent tenant-quality profile in this submarket — average credit score on applications, eviction rate, late-payment / NSF rate, and stable-employment percentage? A property-management company in the area should have these aggregated.
- How much new for-sale + rental construction is in the pipeline within 1–3 miles? Heavy new supply typically softens prices + rents 12–24 months out; constrained supply supports both.
Investment metrics
- 1% rule
- 1.06% ✓
- Cap rate
- 8.75%
- Cash-on-cash
- 8.77%
- DSCR
- 1.39
- GRM
- 7.9
CMA / ARV
- ARV (on-the-fly)
- $829,440
- Comps found
- 2
Show comp detail 2 sales within ~0.75 mi
| Address | Dist | Beds/Ba | Sqft | Sold | Price | $/sf | Match |
|---|---|---|---|---|---|---|---|
| 1420 Lemon Bay Drive Dr | 0.64mi | 2/2.0 (-1) | 2,197 (+2%) | 16mo | $575,000 | $262 | 49 |
| 1444 Lemon Bay Dr | 0.65mi | 3/2.0 | 2,410 (+12%) | 16mo | $925,000 | $384 | 37 |
Match score weights: distance 35% · size 25% · config 20% · recency 20%. Top-matched comps best support the ARV.
Projected returns pro-forma
-3.0% appreciation · 8.0% rent growth · sell at horizon
- IRR
- -6.0%
- Equity multiple
- 0.76×
- Total profit
- $-19,776
- Equity at exit
- $44,582
- IRR
- 9.3%
- Equity multiple
- 1.89×
- Total profit
- $74,716
- Equity at exit
- $25,852
Cash invested: $83,720 (down + closing). Projections, not guarantees.
Landlord ↔ Tenant lean methodology
- Overall (STATE)
- 87 Strongly Landlord-Friendly
- State Florida
- 87 Strongly Landlord-Friendly · R+3
- County
- — inherits STATE
- City
- — inherits STATE
ZIP-level market 34223
- Home prices YoY
- -34.2%
- Rents YoY
- 9.0%
- Active inventory
- 717
- Price-to-rent
- 7.9×
Monthly cashflow live
- Estimated rent
- $3,158 medium interval (Pro) →
- Mortgage (P&I)
- −$1,568
- Tax from tax record
- −$190 /mo · $2,285/yr
- Insurance
- −$125
- Flood insurance flood zone
- −$427 /mo · $5,118/yr
- HOA
- −$0
- Vacancy / Maint / Mgmt
- −$663
- Net cashflow
- $185
Break-even live
UW: 25.0% down · 7.5% · 30yr · 1.5% tax · 5.0% vac · 8.0% maint · 8.0% mgmt
Financing live
Cash to close
- Down payment
- $74,750
- Closing costs
- $8,970
- Reserves months
- —
- Total cash needed
- —
Loan-product check · same deal, 3 products live
Conventional
25% down · 7.5% · 30yr
- Down + closing
- —
- Monthly P&I
- —
- Monthly cashflow
- —
- DSCR
- —
- Eligible?
- —
Personal DTI + credit; lowest rate.
DSCR
20% down · 8.5% · 30yr
- Down + closing
- —
- Monthly P&I
- —
- Monthly cashflow
- —
- DSCR
- —
- Eligible?
- —
No personal income docs; deal must DSCR.
Hard money
10% down · 12.0% · 12mo
- Down + closing
- —
- Monthly P&I
- —
- Monthly cashflow
- —
- DSCR
- —
- Eligible?
- —
Short-term bridge; refi at stabilization.
Rent comps 3 comps
| Address | Beds | Baths | Sqft | Rent | $/sqft | DOM | Units | Dist |
|---|---|---|---|---|---|---|---|---|
| 1501 Helene Ave Englewood, FL | 3.0 | 2.0 | 1608 | $3,200 | $1.99 | 13d | 1 | 0.30mi |
| 1081 Humboldt St Englewood, FL | 3.0 | 2.0 | 1838 | $2,400 | $1.31 | 21d | 1 | 0.65mi |
| 1375 Beach Rd #311 Englewood, FL | 3.0 | 2.0 | 1686 | $4,950 | $2.94 | 21d | 1 | 0.86mi |
Listing history 27 events
-
2026-06-18days on market $299,000 Active 153 DOM
-
2026-06-17days on market $299,000 Active 152 DOM
-
2026-06-16days on market $299,000 Active 151 DOM
-
2026-06-15days on market $299,000 Active 150 DOM
-
2026-06-14days on market $299,000 Active 148 DOM
-
2026-06-13days on market $299,000 Active 147 DOM
-
2026-06-10days on market $299,000 Active 145 DOM
-
2026-06-09days on market $299,000 Active 144 DOM
-
2026-06-08days on market $299,000 Active 143 DOM
-
2026-06-05days on market $299,000 Active 139 DOM
-
2026-06-03days on market $299,000 Active 138 DOM
-
2026-06-02days on market $299,000 Active 137 DOM
-
2026-06-01days on market $299,000 Active 136 DOM
-
2026-05-31days on market $299,000 Active 135 DOM
-
2026-05-30days on market $299,000 Active 134 DOM
-
2026-05-22$2,100
-
2026-04-10price $299,000
-
2026-01-16$209,000 Active
-
2026-01-12historical
-
2025-11-10$350,000 Active
-
2015-02-17historical
-
2014-10-06price $130,000
-
2014-08-17$140,000 Active
-
2011-12-29soldstatus $68,800
-
2011-12-20soldstatus $68,800
-
2011-01-10$65,000
-
1991-05-01soldstatus $72,500
ⓘ Source: listings_history table (triggers on properties + properties_extension) + one-shot
backfill from property_details.listing_events for pre-trigger history.
Tax reassessment forecast FL · Resets to sale price
- Current annual tax
- $2,285 · $190/mo
- Projected year-2 tax
- $2,482 · $207/mo
- Expected delta
- +$197/yr (+$16/mo · 8.6%)
ⓘ Screening estimate from a state-policy table — verify with the county assessor before closing.
Climate risk First Street
- Flood 9/10 Extreme FEMA zone AE · 99% chance over 30 yrs
- Wildfire 3/10 Moderate
- Heat 10/10 Extreme 7 d/yr ≥107°F today · 30 d/yr by 30 yrs out
- Wind 10/10 Extreme 99% chance of damaging wind over 30 yrs
- Air quality 2/10 Low 1 unhealthy d/yr today · 1 by 30 yrs out
Nearby sold comps map
Loading sold comps map…
Walkable amenities ~0.75 mi
Loading nearby amenities…
Taxation est. · year 1
- Rental income
- $37,893
- − Mortgage interest
- −$16,749
- − Property taxes
- −$2,285
- − Insurance
- −$6,614
- − Repairs & maintenance
- −$3,031
- − Management
- −$3,031
- − Depreciation
- −$8,698
- Taxable loss
- −$2,515
- Est. tax savings @ 24.0%
- +$604
- After-tax cash flow
- $2,825/yr
For passive investors: Depreciation is non-cash, so a rental often shows a tax loss while cash-flowing — sheltering income. Rental losses are passive: they offset passive income freely, and up to $25,000/yr can offset ordinary (W-2) income if you actively participate and your MAGI is under $100k (phasing out to $0 by $150k); unused losses carry forward. On sale, claimed depreciation is recaptured at up to 25%, and gains may owe capital-gains tax (a 1031 exchange can defer both). Figures are a year-1 estimate at your 24.0% rate — not tax advice; consult a CPA.
Schools (NCES district)
- District
- Charlotte
- NCES district ID
- 1200240
- Math proficiency
- 54% ▼ -6.00%
- Reading proficiency
- 54% ▼ -1.00%
- Median HH income
- $44,864
- Composite
- 45.62/100
- National rank
- #2586
- State rank
- #22 of 73 in FL
Livability — Englewood
- Score
- 73/100
- State rank
- #321
- US rank
- #5655
Category grades
Schools grade is shown separately in the Schools card above.
Census & demographics
- Census place
- Englewood, FL
- County
- Sarasota County · 448,376 people
- City population
- 35,420
- Metro
- North Port-Sarasota-Bradenton, FL
- Population (ZIP)
- 19,884
- Household income
- $76,016
- Rent vs Own
- Severe rent burden
- 290.0
Population outlook (Charlotte County) Hauer SSP2
- Today (2025)
- 198,646 people
- By 2030
- 210,507 · +6.0%
- By 2040
- 230,857 · +16.2%
- By 2050
- 247,148 · +24.4%
- By 2075
- 281,777 · +41.8%
- By 2100
- 293,609 · +47.8%
Race, ethnicity, and origin ACS 2023
- Neighborhood character
- Predominantly White (94%)
- Race & ethnicity
- White 94% Two or more races 3% Hispanic / Latino 3% Asian 1%
- Common ancestry
- Romanian 7% Lithuanian 4% Iranian 2%
- Foreign-born
- 9% · Canada
- Languages at home
- 94% English-only · German/W. Germanic 2% Spanish 1% Other Indo-European 1%
Political lean MEDSL · Charlotte
- 2024 margin
- Solid R (+34.0) · D 32.7% · R 66.7%
- 2008→2024 swing
- -26.7pp toward R · 2008: -7.2pp · 2024: -34.0pp
- All cycles
- 2024: R+34.0 2020: R+26.6 2016: R+27.8 2012: R+14.3 2008: R+7.2
Not yet ingested
- Civics
- —
Market trends
- HPI YoY
- ▼ -146.26%
- Current HPI
- 281.0529
- Rent YoY
- ▲ 9.02%
- Metro
- North Port-Sarasota-Bradenton, FL
- State GDP YoY
- ▲ 3.28%
- F500 in state
- 36
Industry mix (Fortune 500 HQ in FL)
| Industry | F500 HQs | Revenue |
|---|---|---|
| Industrial Technology | 2 | $29B |
|
||
| Insurance | 2 | $17B |
|
||
| Retail | 1 | $60B |
|
||
| Technology Distribution | 1 | $58B |
|
||
| Homebuilding | 1 | $35B |
|
||
| Technology Manufacturing | 1 | $35B |
|
||
Price history
-97.1% since first listed12 events — show timeline
- 2026-05-22 Listed for Rent $2,100 TURBOTENANT
- 2026-04-10 Price Changed $299,000 Stellar MLS as Distributed by MLS Grid
- 2026-01-16 Listed $209,000 Stellar MLS as Distributed by MLS Grid
- 2026-01-12 Listing Removed — Stellar MLS as Distributed by MLS Grid
- 2025-11-10 Listed $350,000 Stellar MLS as Distributed by MLS Grid
- 2015-02-17 Listing Removed — Stellar MLS as Distributed by MLS Grid
- 2014-10-06 Price Changed $130,000 Stellar MLS as Distributed by MLS Grid
- 2014-08-17 Listed $140,000 Stellar MLS as Distributed by MLS Grid
- 2011-12-29 Sold (Public Records) $68,800 Public Records
- 2011-12-20 Sold (MLS) $68,800 Stellar MLS as Distributed by MLS Grid
- 2011-01-10 Listed $65,000 Stellar MLS as Distributed by MLS Grid
- 1991-05-01 Sold (Public Records) $72,500 Public Records
Property tax history
+0.8%/yrLatest (2025): $2,285 · -57.7% YoY. Source: county tax records.
Cash-flow waterfall
monthlySold comps — $/sqft
last 12 mo · ≤1 miLoading sold comps…