 🏷️ Likely Rental
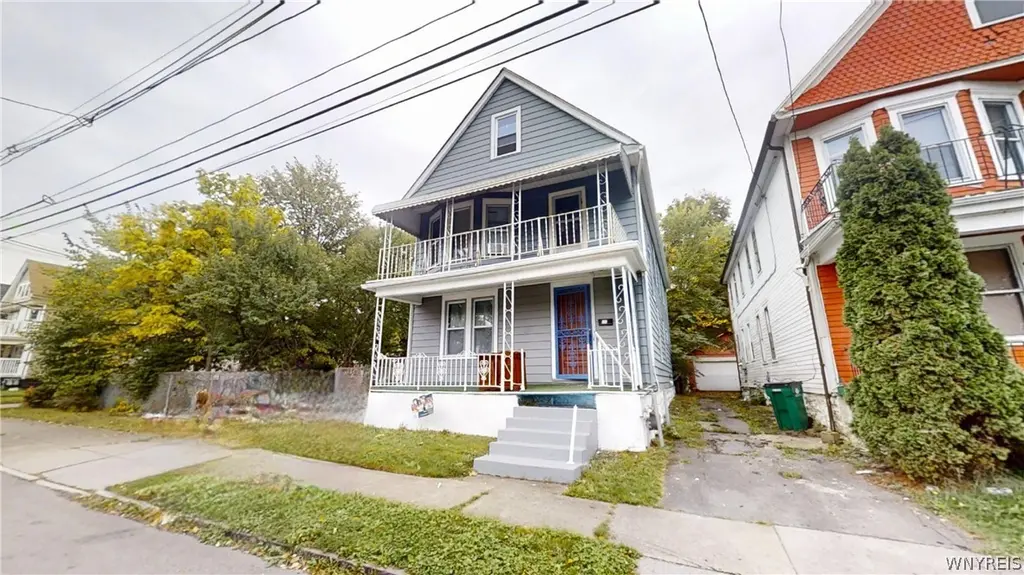
477 Riley St · Buffalo, NY
Flood risk 1/10 · Minimal
- FEMA flood zone
- X (unshaded)
- Chance of flooding over 30 yrs
- 0.0%
- Est. flood insurance / yr
- $473 – $860
Fire risk 1/10 · Minimal
- Est. fire insurance / yr
- $691 – $1,283
Heat risk 2/10 · Minimal
- Hot days now (above 93°F)
- 7 days/yr
- Hot days in 30 yrs
- 14 days/yr
Wind risk 1/10 · Minimal
- Chance of severe wind over 30 yrs
- —
Air-quality risk 3/10 · Minor
- Unhealthy air days now
- 2 days/yr
- Unhealthy air days in 30 yrs
- 3 days/yr
Risk factors via First Street. Map © Google.
Why this score? — see what drove the C grade
The composite is a weighted blend of 9 inputs, each scored 0–100. Each bar is that input's sub-score; the figure is the points it added to the 100-point composite (weight × sub-score).
- Cash flow +19.7/30.0
- ARV discount +15.0/15.0
- DSCR +6.2/10.0
- 1% rule +3.9/10.0
- Livability +3.9/5.0
- Schools +3.3/10.0
- Rent growth +2.5/5.0
- Condition / age +2.5/5.0
- Appreciation +0.0/10.0
$189,999
🖨 Deal sheet 📄 Offer letter ✓ Due diligence
Multi-family units
County records classify this as Multi-Family (2-4 Unit). Listing-text estimate: 1 unit. estimate disagrees with records
Listing remarks
Welcome to 477 Riley. This 2/2 double in Buffalo is a fantastic investment property or owner occupied house hack opportunity. This house sits on a quiet street and on a HUGE double lot. Ample parking, including a 2 car garage. Home being sold as is - upper tenant is fantastic and willing to stay. Offers reviewed as they come in. Showings start immediately.
Key facts
- Ample parking
- Double lot
- 3,465 sq ft lot
Tags
Property features AI
Finance
- Financial info: Owner pays water; Rent includes water; Operating expense details: see remarks
Exterior
- Parking: Attached garage; Two-car garage
- Utilities: Electricity connected; Public water connected; Sewer connected; High-speed internet available
- Home design: Two-story building; Existing construction
- Construction: Wood siding exterior; Asphalt roof; Block foundation; Built previously (existing)
- Exterior features: Rectangular residential lot; City street frontage; Lot dimensions approximately 33 x 105
Interior
- Kitchen: Gas water heater (appliance/service noted)
- Bedrooms: Two-unit property (unit count: 2)
- Flooring: Hardwood; Vinyl; Varied flooring
- Bathrooms: Two full bathrooms (total)
- Heating & cooling: Gas heating; Forced-air heating
- Interior features: Hardwood flooring in parts of the home; Vinyl and varied flooring throughout; Full basement
- Laundry & utility: Separate utilities: two separate gas meters and two separate electric meters
Neighborhood map
What this means for you Summary
Snapshot
- This is a 4-bed/2.0-bath multifamily listed at $190k.
Deal economics
- At list price, monthly cash flow is $224 ($3k/yr) — positive.
- The deal already cash-flows at list — no discount required.
- To meet the 1% rule (rent ≥ 1% of price), the offer needs to be $169k (10.9% below list).
- Recommended offer: $169k (10.9% below list) — sets the bar for 1% rule.
Location & tenants
- Location reads 77/100 on livability (#195 in NY, #3,011 nationally) — a middle-class / working-renter tenant base. Strengths: commute A+, housing A+, health & safety A+; Watch: crime F, employment D-.
- Buffalo City School District (urban): math 41% / reading 40% proficiency, ranked #535 of 590 in NY (top 91%) — families likely to look elsewhere, expect single-tenant / working-renter base with shorter leases; 75% free/reduced lunch — lower-income household profile, screen leases tightly.
- Market conditions: 54 active listings in the ZIP; 9 comparable units currently listed for rent nearby; rentals lingering (median 44d on market — plan ~5-8 weeks vacancy on turnover, expect pricing pressure); 56% of comp listings sitting > 30 days — soft ceiling on asking rent; 1,244 units permitted in Erie County in 2024 (563 in 5+ unit buildings).
- This rent runs 42% of the median local income ($48k/yr) — at the standard rent-burdened threshold; future hikes will face affordability resistance.
Forward outlook
- Local home prices are declining (-3.0%/yr); year-one equity from $1k of loan paydown is wiped out by about $6k of value loss. Plan a longer hold.
Negotiation context
- It's been on market 44 days — a 3% lower offer ($184k) is reasonable based on typical stale-listing flexibility.
- 3 sale attempts since 8y ago with the ask held roughly flat each time — persistent listings suggest the price (not the market) is what's stuck; bring a comps-based counter.
- Current owner paid $60k; list at $190k implies a 217% gain — meaningful room to come down on a strong offer.
Risks & watch-outs
- Watch-outs: built in 1900 — expect roof / HVAC / electrical / plumbing capex.
Questions for the listing agent
- It's been on market 44 days. Have you received any prior offers? Is the seller open to a 11% concession, seller financing, or rate buy-down credit?
- Built in 1900 — when were the roof, HVAC, electrical panel, plumbing, and water heater last replaced?
- Is there a deadline driving the sale (1031 exchange, divorce, estate, relocation)? That informs how much negotiation room exists.
- Crime grade is F in this area — have there been break-ins, vandalism, or insurance claims at this property in the last 3 years? What carrier currently insures it and at what premium?
- What's the average days-on-market for RENTAL listings here right now (not sales)? A rising rental-DOM trend means longer vacancies and softer asking-rent achievability than the comps imply.
- What's the recent tenant-quality profile in this submarket — average credit score on applications, eviction rate, late-payment / NSF rate, and stable-employment percentage? A property-management company in the area should have these aggregated.
- How much new apartment / multifamily construction is in the pipeline within 1–3 miles? Heavy new supply (>2% of stock underway) typically softens rents 12–24 months out; light construction supports rent growth.
Investment metrics
- 1% rule
- 0.89% ✗
- Cap rate
- 7.71%
- Cash-on-cash
- 5.05%
- DSCR
- 1.22
- GRM
- 9.4
CMA / ARV
- ARV (median comp)
- $280,195
- List price
- $189,999
- Delta
- -32.19%
- Verdict
- UNDERPRICED
- Comps
- 20 within 1.0 mi
Show comp detail 12 sales within ~0.75 mi
| Address | Dist | Beds/Ba | Sqft | Sold | Price | $/sf | Match |
|---|---|---|---|---|---|---|---|
| 494 Riley St | 0.03mi | 4/2.0 | 2,145 (-7%) | 2mo | $175,000 | $82 | 85 |
| 502 Glenwood Ave | 0.25mi | 5/2.0 (+1) | 2,294 (-0%) | 7mo | $20,500 | $9 | 77 |
| 421 E Utica St | 0.15mi | 5/2.0 (+1) | 2,377 (+3%) | 10mo | $210,000 | $88 | 74 |
| 469 Woodlawn Ave | 0.31mi | 4/2.0 | 2,120 (-8%) | 6mo | $250,000 | $118 | 67 |
| 53 Pershing Ave | 0.53mi | 5/2.0 (+1) | 2,360 (+2%) | 11mo | $149,000 | $63 | 57 |
| 511 Dodge St | 0.26mi | 5/3.0 (+1) | 2,564 (+11%) | 8mo | $80,000 | $31 | 53 |
| 24 Winslow Ave | 0.34mi | 5/2.0 (+1) | 2,024 (-12%) | 7mo | $220,000 | $109 | 53 |
| 361 E North St Unit S | 0.60mi | 5/2.5 (+1) | 2,544 (+10%) | 3mo | $172,500 | $68 | 45 |
| 352 Guilford St | 0.56mi | 5/2.0 (+1) | 2,088 (-9%) | 14mo | $120,000 | $57 | 41 |
| 37 Pershing Ave | 0.56mi | 5/3.0 (+1) | 2,641 (+15%) | 1mo | $85,000 | $32 | 39 |
| 244 Purdy St | 0.68mi | 4/2.0 | 2,026 (-12%) | 12mo | $145,000 | $72 | 38 |
| 108 Urban St | 0.68mi | 5/2.0 (+1) | 2,100 (-9%) | 13mo | $150,000 | $71 | 38 |
Match score weights: distance 35% · size 25% · config 20% · recency 20%. Top-matched comps best support the ARV.
Projected returns pro-forma
-3.0% appreciation · 3.0% rent growth · sell at horizon
- IRR
- -8.5%
- Equity multiple
- 0.69×
- Total profit
- $-16,637
- Equity at exit
- $28,329
- IRR
- 0.9%
- Equity multiple
- 1.07×
- Total profit
- $3,466
- Equity at exit
- $16,428
Cash invested: $53,200 (down + closing). Projections, not guarantees.
Landlord ↔ Tenant lean methodology
- Overall (STATE)
- 15 Strongly Tenant-Friendly
- State New York
- 15 Strongly Tenant-Friendly · D+10
- County
- — inherits STATE
- City
- — inherits STATE
ZIP-level market 14208
- Home prices YoY
- -3.4%
- Active inventory
- 54
- Price-to-rent
- 9.4×
Monthly cashflow live
- Estimated rent
- $1,693 high interval (Pro) →
- Mortgage (P&I)
- −$996
- Tax from tax record
- −$39 /mo · $462/yr
- Insurance
- −$79
- HOA
- −$0
- Vacancy / Maint / Mgmt
- −$356
- Net cashflow
- $224
Break-even live
UW: 25.0% down · 7.5% · 30yr · 1.5% tax · 5.0% vac · 8.0% maint · 8.0% mgmt
Financing live
Cash to close
- Down payment
- $47,500
- Closing costs
- $5,700
- Reserves months
- —
- Total cash needed
- —
Loan-product check · same deal, 3 products live
Conventional
25% down · 7.5% · 30yr
- Down + closing
- —
- Monthly P&I
- —
- Monthly cashflow
- —
- DSCR
- —
- Eligible?
- —
Personal DTI + credit; lowest rate.
DSCR
20% down · 8.5% · 30yr
- Down + closing
- —
- Monthly P&I
- —
- Monthly cashflow
- —
- DSCR
- —
- Eligible?
- —
No personal income docs; deal must DSCR.
Hard money
10% down · 12.0% · 12mo
- Down + closing
- —
- Monthly P&I
- —
- Monthly cashflow
- —
- DSCR
- —
- Eligible?
- —
Short-term bridge; refi at stabilization.
Rent comps 9 comps
| Address | Beds | Baths | Sqft | Rent | $/sqft | DOM | Units | Dist |
|---|---|---|---|---|---|---|---|---|
| 28 Lonsdale Rd Buffalo, NY | 3.0 | 1.0 | 2735 | $1,725 | $0.63 | 43d | 1 | 0.51mi |
| 82 Butler Ave Unit 2 Buffalo, NY | 3.0 | 1.0 | 2752 | $1,300 | $0.47 | 43d | 1 | 0.51mi |
| 73 Inter Park Ave Buffalo, NY | 3.0 | 1.0 | 2080 | $1,300 | $0.62 | 14d | 1 | 0.58mi |
| 563 Humboldt Pkwy Buffalo, NY | 3.0 | 1.0 | 2004 | $1,200 | $0.60 | 23d | 1 | 0.76mi |
| 518 Wilson St Buffalo, NY | 5.0 | 1.5 | 1848 | $1,500 | $0.81 | 23d | 1 | 0.77mi |
| 79 Walden Ave Buffalo, NY | 3.0 | 1.0 | 2528 | $1,250 | $0.49 | 43d | 1 | 0.84mi |
| 98 E Delavan Ave Buffalo, NY | 4.0 | 2.0 | 3105 | $2,000 | $0.64 | 43d | 1 | 0.97mi |
| 491 Emslie St Buffalo, NY | 3.0 | 1.0 | 2488 | $1,200 | $0.48 | 14d | 1 | 1.33mi |
| 91 W Humboldt Pkwy Buffalo, NY | 4.0 | 2.0 | 3017 | $3,400 | $1.13 | 43d | 1 | 1.42mi |
Listing history 21 events
-
2026-06-18days on market $189,999 Active 44 DOM
-
2026-06-17days on market $189,999 Active 43 DOM
-
2026-06-16days on market $189,999 Active 42 DOM
-
2026-06-15days on market $189,999 Active 41 DOM
-
2026-06-13days on market $189,999 Active 39 DOM
-
2026-06-13days on market $189,999 Active 38 DOM
-
2026-06-10days on market $189,999 Active 36 DOM
-
2026-06-09days on market $189,999 Active 35 DOM
-
2026-06-08pricedays on market $189,999 Active 34 DOM
-
2026-06-07days on market $194,900 Active 33 DOM
-
2026-06-03days on market $194,900 Active 29 DOM
-
2026-06-02days on market $194,900 Active 28 DOM
-
2026-06-01days on market $194,900 Active 27 DOM
-
2026-05-31days on market $194,900 Active 26 DOM
-
2026-05-04$199,900 Active 358-char remark
-
2026-04-30historical
-
2025-09-30$189,900 Active
-
2019-09-12soldstatus $60,000 Closed Sale or Rented
-
2019-09-12soldstatus $60,000
-
2018-12-19status Under Contract- Do Not Show
-
2018-12-19$60,000 Active
ⓘ Source: listings_history table (triggers on properties + properties_extension) + one-shot
backfill from property_details.listing_events for pre-trigger history.
Tax reassessment forecast NY · Partial reset (capped growth)
- Current annual tax
- $462 · $39/mo
- Projected year-2 tax
- $1,837 · $153/mo
- Expected delta
- +$1,374/yr (+$115/mo · 297.3%)
ⓘ Screening estimate from a state-policy table — verify with the county assessor before closing.
Climate risk First Street
- Flood 1/10 Low FEMA zone X (unshaded) · 0% chance over 30 yrs
- Wildfire 1/10 Low
- Heat 2/10 Low 7 d/yr ≥93°F today · 14 d/yr by 30 yrs out
- Wind 1/10 Low
- Air quality 3/10 Moderate 2 unhealthy d/yr today · 3 by 30 yrs out
Nearby sold comps map
Loading sold comps map…
Walkable amenities ~0.75 mi
Loading nearby amenities…
Taxation est. · year 1
- Rental income
- $20,321
- − Mortgage interest
- −$10,643
- − Property taxes
- −$462
- − Insurance
- −$950
- − Repairs & maintenance
- −$1,626
- − Management
- −$1,626
- − Depreciation
- −$5,527
- Taxable loss
- −$513
- Est. tax savings @ 24.0%
- +$123
- After-tax cash flow
- $2,808/yr
For passive investors: Depreciation is non-cash, so a rental often shows a tax loss while cash-flowing — sheltering income. Rental losses are passive: they offset passive income freely, and up to $25,000/yr can offset ordinary (W-2) income if you actively participate and your MAGI is under $100k (phasing out to $0 by $150k); unused losses carry forward. On sale, claimed depreciation is recaptured at up to 25%, and gains may owe capital-gains tax (a 1031 exchange can defer both). Figures are a year-1 estimate at your 24.0% rate — not tax advice; consult a CPA.
Schools (NCES district)
- District
- Buffalo City School District
- NCES district ID
- 3605850
- Math proficiency
- 41% ▲ 11.00%
- Reading proficiency
- 40% ▲ 7.00%
- Median HH income
- $31,665
- Composite
- 33.17/100
- National rank
- #5544
- State rank
- #535 of 590 in NY
Livability — Buffalo
- Score
- 77/100
- State rank
- #195
- US rank
- #3011
Category grades
Schools grade is shown separately in the Schools card above.
Census & demographics
- Census place
- Buffalo, NY
- County
- Erie County · 714,559 people
- City population
- 440,021
- Metro
- Buffalo-Cheektowaga, NY
- Population (ZIP)
- 12,572
- Household income
- $48,476
- Rent vs Own
- Severe rent burden
- 723.0
Population outlook (Erie County) Hauer SSP2
- Today (2025)
- 933,037 people
- By 2030
- 935,181 · +0.2%
- By 2040
- 928,531 · -0.5%
- By 2050
- 905,725 · -2.9%
- By 2075
- 834,037 · -10.6%
- By 2100
- 708,033 · -24.1%
Race, ethnicity, and origin ACS 2023
- Neighborhood character
- Predominantly Black (72%)
- Race & ethnicity
- Black 72% White 15% Asian 6% Two or more races 4% Hispanic / Latino 3%
- Common ancestry
- Romanian 2% Italian 1% Hispanic 0%
- Foreign-born
- 7% · Canada, South Korea, Philippines
- Languages at home
- 89% English-only · Other Indo-European 3% Spanish 2% French/Haitian/Cajun 1%
Political lean MEDSL · Erie
- 2024 margin
- Lean D (+9.7) · D 54.8% · R 45.2%
- 2008→2024 swing
- -7.9pp toward R · 2008: 17.5pp · 2024: 9.7pp
- All cycles
- 2024: D+9.7 2020: D+14.7 2016: D+4.8 2012: D+15.6 2008: D+17.5
Not yet ingested
- Civics
- —
Market trends
- HPI YoY
- ▼ -16.37%
- Current HPI
- 459.2084
- Rent YoY
- —
- Metro
- Buffalo-Cheektowaga, NY
- State GDP YoY
- ▲ 2.60%
- F500 in state
- 92
Industry mix (Fortune 500 HQ in NY)
| Industry | F500 HQs | Revenue |
|---|---|---|
| Financial Services | 10 | $950B |
|
||
| Consumer Goods | 9 | $162B |
|
||
| Insurance | 4 | $225B |
|
||
| Telecommunications | 2 | $144B |
|
||
| Pharmaceuticals | 2 | $112B |
|
||
| Media / Entertainment | 2 | $69B |
|
||
Price history
+216.7% since first listed9 events — show timeline
- 2026-06-08 Price Changed $189,999 WNYREIS
- 2026-05-21 Price Changed $194,900 WNYREIS
- 2026-05-04 Listed $199,900 WNYREIS
- 2026-04-30 Listing Removed — WNYREIS
- 2025-09-30 Listed $189,900 WNYREIS
- 2019-09-12 Sold (Public Records) $60,000 Public Records
- 2019-09-12 Sold (MLS) $60,000 WNYREIS
- 2018-12-19 Pending — WNYREIS
- 2018-12-19 Listed $60,000 WNYREIS
Property tax history
+17.8%/yrLatest (2025): $462 · +111.5% YoY. Source: county tax records.
Cash-flow waterfall
monthlySold comps — $/sqft
last 12 mo · ≤1 miLoading sold comps…