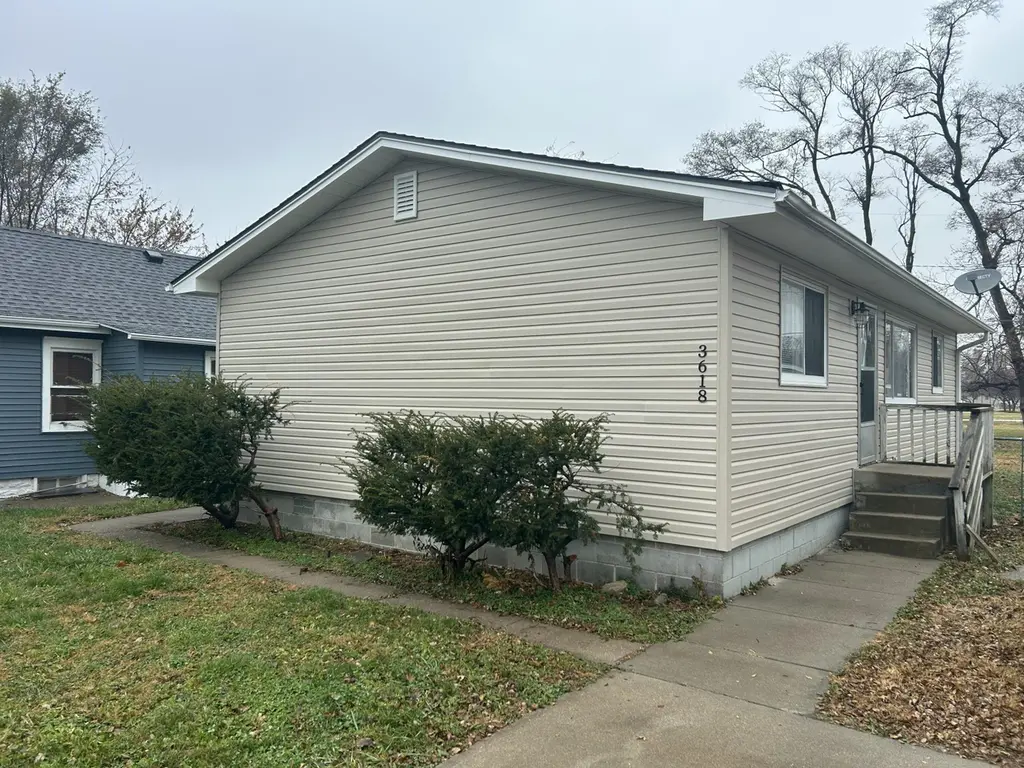
3618 2nd Ave · Council Bluffs, IA
Flood risk 1/10 · Minimal
- FEMA flood zone
- X
- Chance of flooding over 30 yrs
- 0.0%
- Est. flood insurance / yr
- $507 – $1,088
Fire risk 3/10 · Minor
- Est. fire insurance / yr
- $902 – $1,676
Heat risk 3/10 · Minor
- Hot days now (above 104°F)
- 7 days/yr
- Hot days in 30 yrs
- 15 days/yr
Wind risk 2/10 · Minimal
- Chance of severe wind over 30 yrs
- —
Air-quality risk 2/10 · Minimal
- Unhealthy air days now
- 1 days/yr
- Unhealthy air days in 30 yrs
- 1 days/yr
Risk factors via First Street. Map © Google.
Why this score? — see what drove the D grade
The composite is a weighted blend of 9 inputs, each scored 0–100. Each bar is that input's sub-score; the figure is the points it added to the 100-point composite (weight × sub-score).
- Cash flow +12.3/30.0
- ARV discount +11.6/15.0
- Schools +4.5/10.0
- DSCR +3.6/10.0
- Livability +3.5/5.0
- 1% rule +3.3/10.0
- Rent growth +2.6/5.0
- Condition / age +2.5/5.0
- Appreciation +0.0/10.0
$149,900
🖨 Deal sheet 📄 Offer letter ✓ Due diligence
Listing remarks
Nicely updated 3 bedroom 2 bath home conveniently located with quick access to downtown Omaha and and west Broadway. Property features newer LVT flooring, fresh paint and new vinyl siding on the exterior. Nice floor plan featuring in-suite bath for the primary bedroom with the other two bedrooms on the other side of the home. Combo lock box. Please call the agent(s) for the code
Key facts
- In-suite bath
- Fresh paint
- New vinyl siding
Tags
Neighborhood map
What this means for you Summary
Snapshot
- This is a 2-bed/1.0-bath single-family listed at $150k.
Deal economics
- At list price, monthly cash flow is $-28 ($-339/yr) — negative.
- To cash-flow at today's rent, offer at most $145k (3.3% below list).
- To meet the 1% rule (rent ≥ 1% of price), the offer needs to be $124k (17.1% below list).
- Recommended offer: $124k (17.1% below list) — sets the bar for 1% rule.
- Cap rate 6.1% vs local median 3.3% in Council Bluffs — top-decile yield for the area; either an underpriced asset or a hidden risk that comps aren't pricing in. Stress-test before assuming the spread holds.
Location & tenants
- Location reads 70/100 on livability (#368 in IA) — a middle-class / working-renter tenant base. Strengths: cost of living A+, housing A+, health & safety B+; Watch: employment C-, amenities D, crime D-.
- Council Bluffs Community School District (urban): math 52% / reading 55% proficiency, ranked #272 of 289 in IA (top 94%) — acceptable for families but not a draw, mixed tenant base, ~2y average lease.
- Zoned schools: Franklin Elementary School (math 54% / reading 54%, grade C, #488 of 616 statewide, top 80%, 497 students, 64% FRL); Woodrow Wilson Middle School (math 54% / reading 51%, grade C+, #209 of 246 statewide, top 85%, 900 students, 75% FRL); Thomas Jefferson High School (math 40% / reading 53%, grade D-, #321 of 336 statewide, top 96%, 1,243 students, 65% FRL) — zoned schools average 68% FRL vs 51% district-wide (17 pts higher); higher-poverty schools than district average — tighter screening recommended.
- Market conditions: Rents flat; 140 active listings in the ZIP; 39 comparable units currently listed for rent nearby; rentals at typical pace (median 22d on market — plan ~3-4 weeks tenant-placement turnaround); 679 units permitted in Pottawattamie County in 2024 (566 in 5+ unit buildings).
Forward outlook
- Local home prices are declining (-3.0%/yr); year-one equity from $1k of loan paydown is wiped out by about $4k of value loss. Plan a longer hold.
- Pottawattamie County population projected to shrink 7% by 2050 — rents likely to lag national; underwrite the cash flow, not the appreciation.
Negotiation context
- Only 5 days on market — expect competitive offers; lowballing is unlikely to land.
- 4 sale attempts since 3y ago with the ask held roughly flat each time — persistent listings suggest the price (not the market) is what's stuck; bring a comps-based counter.
- Current owner paid $66k; list at $150k implies a 127% gain — meaningful room to come down on a strong offer.
Questions for the listing agent
- What do current leases actually rent for vs. the listed asking? Can we see a recent rent roll and the last 12 months of T-12 income?
- Is there a deadline driving the sale (1031 exchange, divorce, estate, relocation)? That informs how much negotiation room exists.
- Crime grade is D in this area — have there been break-ins, vandalism, or insurance claims at this property in the last 3 years? What carrier currently insures it and at what premium?
- The area grade is low — what's the realistic commute time and amenity access for the typical tenant pool here? Any planned neighborhood developments (good or bad) we should know about?
- What's the average days-on-market for RENTAL listings here right now (not sales)? A rising rental-DOM trend means longer vacancies and softer asking-rent achievability than the comps imply.
- What's the recent tenant-quality profile in this submarket — average credit score on applications, eviction rate, late-payment / NSF rate, and stable-employment percentage? A property-management company in the area should have these aggregated.
- How much new for-sale + rental construction is in the pipeline within 1–3 miles? Heavy new supply typically softens prices + rents 12–24 months out; constrained supply supports both.
Investment metrics
- 1% rule
- 0.83% ✗
- Cap rate
- 6.07%
- Cash-on-cash
- -0.81%
- DSCR
- 0.96
- GRM
- 10.1
CMA / ARV
- ARV (on-the-fly)
- $165,120
- Comps found
- 12
Show comp detail 12 sales within ~0.75 mi
| Address | Dist | Beds/Ba | Sqft | Sold | Price | $/sf | Match |
|---|---|---|---|---|---|---|---|
| 3511 Ave A | 0.26mi | 2/1.0 | 1,048 (+9%) | 3mo | $171,000 | $163 | 70 |
| 3431 5th Ave | 0.35mi | 2/1.0 | 886 (-8%) | 1mo | $169,000 | $191 | 70 |
| 3405 3rd Ave | 0.35mi | 3/1.0 (+1) | 864 (-10%) | 1mo | $145,000 | $168 | 62 |
| 3233 2nd Ave | 0.47mi | 3/1.0 (+1) | 1,016 (+6%) | 4mo | $165,000 | $162 | 60 |
| 3546 8th Ave | 0.38mi | 3/1.0 (+1) | 875 (-9%) | 3mo | $190,000 | $217 | 60 |
| 3508 C Ave | 0.37mi | 2/1.0 | 832 (-13%) | 4mo | $143,000 | $172 | 57 |
| 3312 Avenue C | 0.53mi | 2/1.0 | 864 (-10%) | 3mo | $144,400 | $167 | 56 |
| 3215 5th Ave | 0.54mi | 2/1.0 | 868 (-10%) | 4mo | $155,000 | $179 | 56 |
| 3227 2nd Ave | 0.48mi | 2/1.0 | 1,084 (+13%) | 1mo | $103,000 | $95 | 56 |
| 3101 8th Ave | 0.73mi | 3/1.0 (+1) | 875 (-9%) | 0mo | $144,000 | $165 | 46 |
| 501 N 39th St | 0.51mi | 3/1.0 (+1) | 825 (-14%) | 3mo | $160,000 | $194 | 45 |
| 104 N 31st St | 0.65mi | 3/1.0 (+1) | 1,092 (+14%) | 4mo | $217,900 | $200 | 39 |
Match score weights: distance 35% · size 25% · config 20% · recency 20%. Top-matched comps best support the ARV.
Projected returns pro-forma
-3.0% appreciation · 0.56% rent growth · sell at horizon
- IRR
- -20.3%
- Equity multiple
- 0.31×
- Total profit
- $-29,063
- Equity at exit
- $22,351
- IRR
- -19.7%
- Equity multiple
- 0.06×
- Total profit
- $-39,249
- Equity at exit
- $12,961
Cash invested: $41,972 (down + closing). Projections, not guarantees.
Landlord ↔ Tenant lean methodology
- Overall (STATE)
- 83 Strongly Landlord-Friendly
- State Iowa
- 83 Strongly Landlord-Friendly · R+6
- County
- — inherits STATE
- City
- — inherits STATE
ZIP-level market 51501
- Rents YoY
- 0.6%
- Active inventory
- 140
- Price-to-rent
- 10.1×
Monthly cashflow live
- Estimated rent
- $1,243 high interval (Pro) →
- Mortgage (P&I)
- −$786
- Tax from tax record
- −$161 /mo · $1,936/yr
- Insurance
- −$62
- HOA
- −$0
- Vacancy / Maint / Mgmt
- −$261
- Net cashflow
- $-28
Break-even live
UW: 25.0% down · 7.5% · 30yr · 1.5% tax · 5.0% vac · 8.0% maint · 8.0% mgmt
Financing live
Cash to close
- Down payment
- $37,475
- Closing costs
- $4,497
- Reserves months
- —
- Total cash needed
- —
Loan-product check · same deal, 3 products live
Conventional
25% down · 7.5% · 30yr
- Down + closing
- —
- Monthly P&I
- —
- Monthly cashflow
- —
- DSCR
- —
- Eligible?
- —
Personal DTI + credit; lowest rate.
DSCR
20% down · 8.5% · 30yr
- Down + closing
- —
- Monthly P&I
- —
- Monthly cashflow
- —
- DSCR
- —
- Eligible?
- —
No personal income docs; deal must DSCR.
Hard money
10% down · 12.0% · 12mo
- Down + closing
- —
- Monthly P&I
- —
- Monthly cashflow
- —
- DSCR
- —
- Eligible?
- —
Short-term bridge; refi at stabilization.
Rent comps 39 comps
| Address | Beds | Baths | Sqft | Rent | $/sqft | DOM | Units | Dist |
|---|---|---|---|---|---|---|---|---|
| 3726 3rd Ave Apt E Council Bluffs, IA | 2.0 | 1.0 | 748 | $895 | $1.20 | 44d | 1 | 0.15mi |
| 20 S 41st St Council Bluffs, IA | 2.0 | 1.0–2.0 | 709 | $1,640 | $2.31 | 2d | 14 | 0.50mi |
| 4141 Rivers Edge Pkwy Council Bluffs, IA | 2.0 | 1.0–2.0 | 808 | $1,900 | $2.35 | 2d | 8 | 0.50mi |
| 3611 Avenue G Unit 1 Council Bluffs, IA | 2.0 | 1.0 | 1080 | $1,050 | $0.97 | 44d | 1 | 0.55mi |
| 4123 Avenue C Council Bluffs, IA | 2.0 | 1.0 | 985 | $1,100 | $1.12 | 44d | 1 | 0.60mi |
| 10 N 31st St Unit A Council Bluffs, IA | 2.0 | 1.0 | 840 | $795 | $0.95 | 44d | 1 | 0.63mi |
| 806 N 34th St Unit 803-2 Council Bluffs, IA | 2.0 | 1.0 | 955 | $1,115 | $1.17 | 24d | 1 | 0.71mi |
| 806 N 34th St Unit 802-6 Council Bluffs, IA | 2.0 | 1.0 | 930 | $1,090 | $1.17 | 24d | 1 | 0.71mi |
| 806 N 34th St Unit 805-17 Council Bluffs, IA | 2.0 | 1.0 | 955 | $1,125 | $1.18 | 24d | 1 | 0.71mi |
| 806 N 34th St Unit 805-4 Council Bluffs, IA | 2.0 | 1.0 | 930 | $1,049 | $1.13 | 24d | 1 | 0.71mi |
| 806 N 34th St Unit 803-14 Council Bluffs, IA | 2.0 | 1.0 | 930 | $1,000 | $1.08 | 21d | 1 | 0.71mi |
| 806 N 34th St Unit 802-2 Council Bluffs, IA | 2.0 | 1.0 | 955 | $1,079 | $1.13 | 24d | 1 | 0.71mi |
| 806 N 34th St Council Bluffs, IA | 2.0 | 1.0 | 942 | $1,062 | $1.13 | 44d | 11 | 0.71mi |
| 806 N 34th St Council Bluffs, IA | 1.0–2.0 | 1.0 | 776 | $1,105 | $1.42 | 2d | 16 | 0.71mi |
| 2717 Avenue A Apt 4 Council Bluffs, IA | 2.0 | 1.0 | 672 | $995 | $1.48 | 44d | 1 | 0.96mi |
| 415 Leavenworth St Omaha, NE | 1.0–2.0 | 1.0–2.0 | 881 | $2,395 | $2.72 | 2d | 38 | 0.99mi |
| 1222 N 31st St Council Bluffs, IA | 2.0–4.0 | 1.0 | 1031 | $1,029 | $1.00 | 2d | 7 | 1.06mi |
| 900 Farnam St Omaha, NE | 1.0–2.0 | 1.0–2.0 | 870 | $1,750 | $2.01 | 2d | 9 | 1.16mi |
| 909 Capitol Ave Omaha, NE | 1.0 | 1.0 | 841 | $1,430 | $1.70 | 2d | 1 | 1.19mi |
| 2523 3rd Ave Unit 8 Council Bluffs, IA | 2.0 | 1.0 | 720 | $750 | $1.04 | 44d | 1 | 1.20mi |
| 2436 3rd Ave Unit 04 Council Bluffs, IA | 2.0 | 1.0 | 768 | $950 | $1.24 | 44d | 1 | 1.31mi |
| 1115 Harney St Unit 301 Omaha, NE | 1.0 | 1.0 | 700 | $1,125 | $1.61 | 24d | 1 | 1.35mi |
| 1115 Harney St Omaha, NE | 1.0 | 1.0 | 712 | $1,195 | $1.68 | 12d | 2 | 1.35mi |
| 1009 Leavenworth St Omaha, NE | 1.0–2.0 | 1.0 | 875 | $1,200 | $1.37 | 3d | 3 | 1.35mi |
| 2404 Avenue B Unit B Council Bluffs, IA | 2.0 | 1.0 | 1014 | $1,585 | $1.56 | 44d | 1 | 1.38mi |
| 424 S 12th St Omaha, NE | 1.0 | 1.0 | 937 | $1,480 | $1.58 | 3d | 4 | 1.39mi |
| 815 Pierce St Omaha, NE | 3.0 | 1.0 | 968 | $1,500 | $1.55 | 14d | 1 | 1.40mi |
| 815 Pierce St Omaha, NE | 3.0 | 1.0 | 968 | $1,500 | $1.55 | 24d | 1 | 1.40mi |
| 815 Pierce St Omaha, NE | 3.0 | 1.0 | 968 | $1,500 | $1.55 | 44d | 1 | 1.40mi |
| 1213 Harney St Apt 201 Omaha, NE | 1.0 | 1.0 | 610 | $1,100 | $1.80 | 21d | 1 | 1.41mi |
| 1213 Harney St Omaha, NE | 2.0 | 1.0 | 722 | $1,300 | $1.80 | 12d | 3 | 1.41mi |
| 1311 S 9th St Omaha, NE | 1.0 | 1.0 | 743 | $1,350 | $1.82 | 2d | 37 | 1.44mi |
| 1213 Jackson St Omaha, NE | 1.0 | 1.0 | 600 | $839 | $1.40 | 14d | 1 | 1.44mi |
| 925 Pierce St Unit 112 Omaha, NE | 2.0 | 2.0 | 1086 | $1,795 | $1.65 | 3d | 1 | 1.46mi |
| 925 Pierce St Unit 123 Omaha, NE | 2.0 | 1.0 | 1056 | $1,895 | $1.79 | 44d | 1 | 1.46mi |
| 925 Pierce St Apt 219 Omaha, NE | 1.0 | 1.0 | 715 | $1,395 | $1.95 | 3d | 1 | 1.46mi |
| 925 Pierce St Unit 223 Omaha, NE | 2.0 | 1.0 | 1056 | $1,600 | $1.52 | 24d | 1 | 1.46mi |
| 913 Forest Ave Unit 913-1 Omaha, NE | 2.0 | 2.0 | 1100 | $1,695 | $1.54 | 14d | 1 | 1.48mi |
| 1117 Nicholas St Omaha, NE | 2.0 | 1.0–2.0 | 848 | $2,195 | $2.59 | 2d | 47 | 1.49mi |
Listing history 10 events
-
2026-03-31status Pending
-
2026-03-26$149,900 Active
-
2026-03-04$159,900 Active
-
2025-12-31price $169,900
-
2025-11-24$179,000 Active
-
2023-12-19historical $1,200
-
2023-12-01price $1,200
-
2023-11-15price $1,300
-
2023-11-02$1,400
-
2015-02-05soldstatus $66,000
ⓘ Source: listings_history table (triggers on properties + properties_extension) + one-shot
backfill from property_details.listing_events for pre-trigger history.
Tax reassessment forecast IA · Partial reset (capped growth)
- Current annual tax
- $1,936 · $161/mo
- Projected year-2 tax
- $2,145 · $179/mo
- Expected delta
- +$209/yr (+$17/mo · 10.8%)
ⓘ Screening estimate from a state-policy table — verify with the county assessor before closing.
Climate risk First Street
- Flood 1/10 Low FEMA zone X · 0% chance over 30 yrs
- Wildfire 3/10 Moderate
- Heat 3/10 Moderate 7 d/yr ≥104°F today · 15 d/yr by 30 yrs out
- Wind 2/10 Low
- Air quality 2/10 Low 1 unhealthy d/yr today · 1 by 30 yrs out
Nearby sold comps map
Loading sold comps map…
Walkable amenities ~0.75 mi
Loading nearby amenities…
Taxation est. · year 1
- Rental income
- $14,911
- − Mortgage interest
- −$8,397
- − Property taxes
- −$1,936
- − Insurance
- −$750
- − Repairs & maintenance
- −$1,193
- − Management
- −$1,193
- − Depreciation
- −$4,361
- Taxable loss
- −$2,917
- Est. tax savings @ 24.0%
- +$700
- After-tax cash flow
- $362/yr
For passive investors: Depreciation is non-cash, so a rental often shows a tax loss while cash-flowing — sheltering income. Rental losses are passive: they offset passive income freely, and up to $25,000/yr can offset ordinary (W-2) income if you actively participate and your MAGI is under $100k (phasing out to $0 by $150k); unused losses carry forward. On sale, claimed depreciation is recaptured at up to 25%, and gains may owe capital-gains tax (a 1031 exchange can defer both). Figures are a year-1 estimate at your 24.0% rate — not tax advice; consult a CPA.
Schools (NCES district)
- District
- Council Bluffs Community School District
- NCES district ID
- 1908220
- Math proficiency
- 52% ▼ -9.00%
- Reading proficiency
- 55% ▼ -1.00%
- Median HH income
- $45,259
- Composite
- 45.23/100
- National rank
- #2665
- State rank
- #272 of 289 in IA
Livability — Council Bluffs
- Score
- 70/100
- State rank
- #368
- US rank
- #7695
Category grades
Schools grade is shown separately in the Schools card above.
Census & demographics
- Census place
- Council Bluffs, IA
- County
- Pottawattamie County · 72,590 people
- City population
- 72,590
- Metro
- Omaha-Council Bluffs, NE-IA
- Population (ZIP)
- 34,618
- Household income
- $59,843
- Rent vs Own
- Severe rent burden
- 1110.0
Population outlook (Pottawattamie County) Hauer SSP2
- Today (2025)
- 93,683 people
- By 2030
- 92,772 · -1.0%
- By 2040
- 89,917 · -4.0%
- By 2050
- 86,994 · -7.1%
- By 2075
- 82,756 · -11.7%
- By 2100
- 79,097 · -15.6%
Race, ethnicity, and origin ACS 2023
- Neighborhood character
- Predominantly White (79%)
- Race & ethnicity
- White 79% Hispanic / Latino 14% Two or more races 8% Asian 2% Black 2%
- Hispanic origin (detail)
- Mexican 13%
- Common ancestry
- Portuguese 2% Romanian 2% Iranian 1%
- Foreign-born
- 6% · Canada, China
- Languages at home
- 90% English-only · Spanish 8% Chinese 1%
Political lean MEDSL · Pottawattamie
- 2024 margin
- R (+20.0) · D 39.3% · R 59.3% · Other 1.4%
- 2008→2024 swing
- -18.1pp toward R · 2008: -1.9pp · 2024: -20.0pp
- All cycles
- 2024: R+20.0 2020: R+16.8 2016: R+21.6 2012: R+5.8 2008: R+1.9
Not yet ingested
- Civics
- —
Market trends
- HPI YoY
- ▼ -187.49%
- Current HPI
- 215.2532
- Rent YoY
- ▲ 0.56%
- Metro
- Omaha-Council Bluffs, NE-IA
- State GDP YoY
- ▲ 2.48%
- F500 in state
- 4
Industry mix (Fortune 500 HQ in IA)
| Industry | F500 HQs | Revenue |
|---|---|---|
| Financial Services | 1 | $16B |
|
||
| Retail / Convenience | 1 | $15B |
|
||
Price history
+127.1% since first listed10 events — show timeline
- 2026-03-31 Pending — SWIAR
- 2026-03-26 Listed $149,900 SWIAR
- 2026-03-04 Listed $159,900 SWIAR
- 2025-12-31 Price Changed $169,900 SWIAR
- 2025-11-24 Listed $179,000 SWIAR
- 2023-12-19 Rental Removed $1,200 APPFOLIO
- 2023-12-01 Price Changed $1,200 APPFOLIO
- 2023-11-15 Price Changed $1,300 APPFOLIO
- 2023-11-02 Listed for Rent $1,400 APPFOLIO
- 2015-02-05 Sold (Public Records) $66,000 Public Records
Property tax history
+1.3%/yrLatest (2025): $1,936 · +1.0% YoY. Source: county tax records.
Cash-flow waterfall
monthlySold comps — $/sqft
last 12 mo · ≤1 miLoading sold comps…