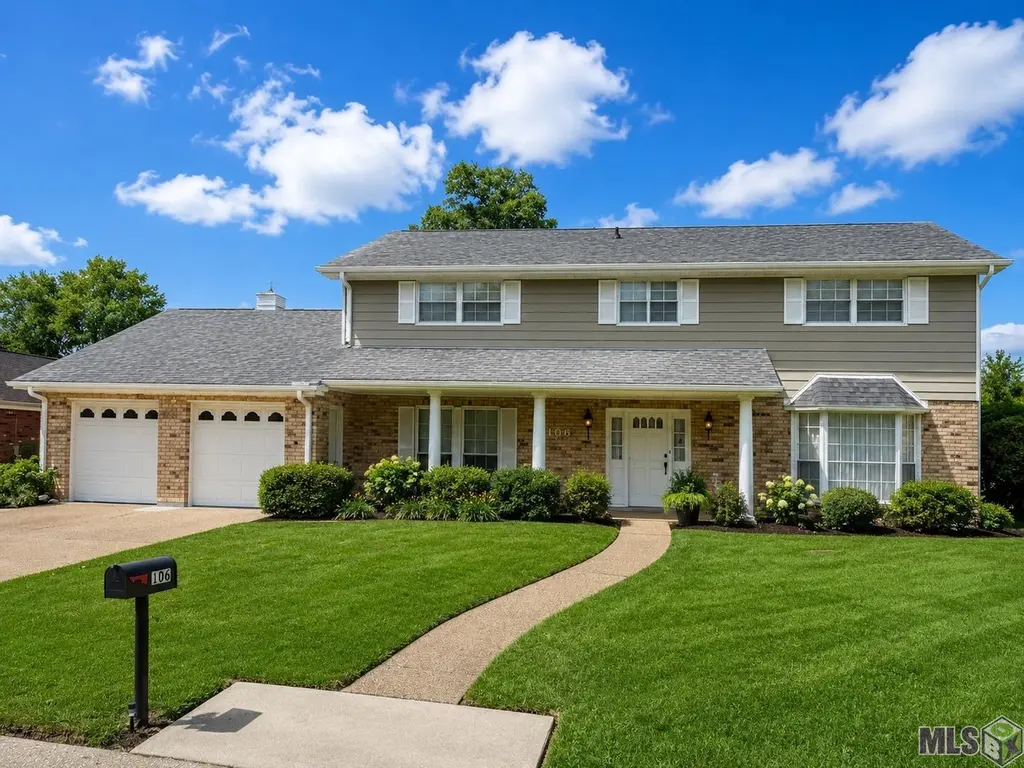
106 Flowerwood Ct · Luling, LA
Flood risk 9/10 · Severe
- FEMA flood zone
- X (shaded)
- Chance of flooding over 30 yrs
- 0.99%
- Est. flood insurance / yr
- $507 – $1,088
Fire risk 1/10 · Minimal
- Est. fire insurance / yr
- $1,269 – $2,357
Heat risk 10/10 · Severe
- Hot days now (above 108°F)
- 7 days/yr
- Hot days in 30 yrs
- 23 days/yr
Wind risk 9/10 · Severe
- Chance of severe wind over 30 yrs
- 99.0%
Air-quality risk 3/10 · Minor
- Unhealthy air days now
- 2 days/yr
- Unhealthy air days in 30 yrs
- 3 days/yr
Risk factors via First Street. Map © Google.
Why this score? — see what drove the C grade
The composite is a weighted blend of 9 inputs, each scored 0–100. Each bar is that input's sub-score; the figure is the points it added to the 100-point composite (weight × sub-score).
- Cash flow +20.4/30.0
- ARV discount +15.0/15.0
- DSCR +6.5/10.0
- 1% rule +4.2/10.0
- Schools +4.0/10.0
- Livability +3.2/5.0
- Rent growth +2.5/5.0
- Condition / age +2.5/5.0
- Appreciation +0.0/10.0
$299,000
🖨 Deal sheet 📄 Offer letter ✓ Due diligence
Listing remarks MLS
WELL TAKEN CARE OF THROUGH THE YEARS and ready for its next chapter! Located in a convenient area of Luling near Mimosa Park Elementary, Lakewood Elementary, and just minutes from Hahnville High School! This spacious one-owner home offers 4 BEDROOMS PLUS AN OFFICE that could easily serve as a 5TH BEDROOM, providing plenty of flexibility for growing families, guests, or working from home. Features include a FULLY FENCED YARD, roof replaced in 2021, and generous living spaces throughout. A wonderful opportunity to update and personalize to your own style -- MAKE THIS HOME YOUR OWN! ****PLEASE NOTE**** Some photos, including the pool and select exterior images, have been virtually enhanced/staged for visualization purposes.
Key facts
- Fully fenced yard
- 0.25 acre lot
- Garage
Tags
Property features AI
Exterior
- Parking: Garage
- Utilities: Public water; Public sewer
- Home design: Single family residence (detached); Residential property
- Construction: Aluminum siding; Brick exterior; Slab foundation; Built with 3628 square feet
- Exterior features: Covered patio; Patio; Chain link fencing
Interior
- Kitchen: Eat-in kitchen
- Flooring: Wood flooring; Carpet flooring
- Bathrooms: 3 full bathrooms
- Heating & cooling: Central heating; Central air conditioning
- Interior features: Eat-in kitchen; Laundry room
- Laundry & utility: Washer; Dryer; Laundry room
Neighborhood map
What this means for you Summary
Snapshot
- This is a 4-bed/3.0-bath single-family listed at $299k.
Deal economics
- At list price, monthly cash flow is $324 ($4k/yr) — positive.
- The deal already cash-flows at list — no discount required.
- To meet the 1% rule (rent ≥ 1% of price), the offer needs to be $274k (8.3% below list).
- Recommended offer: $274k (8.3% below list) — sets the bar for 1% rule.
- Cap rate 7.9% vs local median 4.0% in Luling — top-decile yield for the area; either an underpriced asset or a hidden risk that comps aren't pricing in. Stress-test before assuming the spread holds.
Location & tenants
- Location reads 65/100 on livability (#144 in LA) — a middle-class / working-renter tenant base. Strengths: housing A+, employment A, cost of living A; Watch: amenities F, commute F, health & safety F.
- St. Charles Parish (suburban): math 40% / reading 51% proficiency, ranked #14 of 98 in LA (top 14%) — families likely to look elsewhere, expect single-tenant / working-renter base with shorter leases.
- Market conditions: 151 active listings in the ZIP; 2 comparable units currently listed for rent nearby; solid renter incomes; 74 units permitted in St. Charles Parish in 2024 (0 in 5+ unit buildings).
- This rent runs 43% of the median local income ($77k/yr) — at the standard rent-burdened threshold; future hikes will face affordability resistance.
Forward outlook
- Local home prices are declining (-3.0%/yr); year-one equity from $2k of loan paydown is wiped out by about $9k of value loss. Plan a longer hold.
- St. Charles County population projected to shrink 7% by 2050 — rents likely to lag national; underwrite the cash flow, not the appreciation.
Negotiation context
- It's been on market 15 days — a 2% lower offer ($295k) is reasonable based on typical stale-listing flexibility.
- 2 sale attempts with the ask held roughly flat each time — persistent listings suggest the price (not the market) is what's stuck; bring a comps-based counter.
Risks & watch-outs
- Watch-outs: flood insurance adds $66/mo.
- Climate carrying-cost: severe flood risk; severe wind risk, 99% chance of damaging wind over 30y; extreme-heat days projected 7→23/yr by 2055 (HVAC capex compounding) — expect insurance premiums to compound above CPI over the hold.
Questions for the listing agent
- Built in 1976 — when were the roof, HVAC, electrical panel, plumbing, and water heater last replaced?
- What's the actual annual flood-insurance premium (NFIP or private), and is the property in a SFHA with mandatory coverage?
- Is there a deadline driving the sale (1031 exchange, divorce, estate, relocation)? That informs how much negotiation room exists.
- Schools are B-rated — typically a magnet for longer-tenancy family renters. What's the average tenant stay here, and is there a school-zone premium baked into asking?
- What's the average days-on-market for RENTAL listings here right now (not sales)? A rising rental-DOM trend means longer vacancies and softer asking-rent achievability than the comps imply.
- What's the recent tenant-quality profile in this submarket — average credit score on applications, eviction rate, late-payment / NSF rate, and stable-employment percentage? A property-management company in the area should have these aggregated.
- How much new for-sale + rental construction is in the pipeline within 1–3 miles? Heavy new supply typically softens prices + rents 12–24 months out; constrained supply supports both.
Investment metrics
- 1% rule
- 0.92% ✗
- Cap rate
- 7.86%
- Cash-on-cash
- 5.60%
- DSCR
- 1.25
- GRM
- 9.1
CMA / ARV
- ARV (on-the-fly)
- $454,305
- Comps found
- 12
Show comp detail 12 sales within ~0.75 mi
| Address | Dist | Beds/Ba | Sqft | Sold | Price | $/sf | Match |
|---|---|---|---|---|---|---|---|
| 115 Lake Catherine Dr | 0.45mi | 4/2.5 | 2,888 (-2%) | 2mo | $450,000 | $156 | 73 |
| 330 Saint Nicholas St | 0.37mi | 4/3.0 | 3,152 (+8%) | 3mo | $330,000 | $105 | 68 |
| 320 Monsanto Ave | 0.67mi | 4/3.0 | 2,720 (-7%) | 5mo | $272,000 | $100 | 53 |
| 222 Olivia Dr | 0.51mi | 4/2.0 | 2,636 (-10%) | 4mo | $403,151 | $153 | 52 |
| 206 Olivia Dr | 0.46mi | 4/2.0 | 2,636 (-10%) | 7mo | $406,467 | $154 | 52 |
| 133 Olivia Dr | 0.43mi | 4/2.0 | 2,636 (-10%) | 10mo | $399,630 | $152 | 51 |
| 124 Olivia Dr | 0.39mi | 4/2.0 | 2,636 (-10%) | 13mo | $410,615 | $156 | 51 |
| 306 Olivia Dr | 0.65mi | 4/2.0 | 2,636 (-10%) | 4mo | $408,511 | $155 | 45 |
| 223 Beaupre Dr | 0.66mi | 4/3.0 | 2,657 (-9%) | 10mo | $705,000 | $265 | 45 |
| 308 Sophia Dr | 0.63mi | 5/4.0 (+1) | 3,210 (+10%) | 1mo | $519,567 | $162 | 45 |
| 118 Allison Dr | 0.59mi | 5/4.0 (+1) | 3,105 (+6%) | 11mo | $480,000 | $155 | 45 |
| 320 River Oaks Dr | 0.59mi | 4/3.0 | 2,572 (-12%) | 10mo | $378,000 | $147 | 44 |
Match score weights: distance 35% · size 25% · config 20% · recency 20%. Top-matched comps best support the ARV.
Projected returns pro-forma
-3.0% appreciation · 3.0% rent growth · sell at horizon
- IRR
- -9.1%
- Equity multiple
- 0.67×
- Total profit
- $-27,880
- Equity at exit
- $44,582
- IRR
- 0.3%
- Equity multiple
- 1.02×
- Total profit
- $1,942
- Equity at exit
- $25,852
Cash invested: $83,720 (down + closing). Projections, not guarantees.
Landlord ↔ Tenant lean methodology
- Overall (STATE)
- 90 Strongly Landlord-Friendly
- State Louisiana
- 90 Strongly Landlord-Friendly · R+12
- County
- — inherits STATE
- City
- — inherits STATE
ZIP-level market 70070
- Home prices YoY
- -23.7%
- Active inventory
- 151
- Price-to-rent
- 9.1×
Monthly cashflow live
- Estimated rent
- $2,742 medium interval (Pro) →
- Mortgage (P&I)
- −$1,568
- Tax from tax record
- −$83 /mo · $992/yr
- Insurance
- −$125
- Flood insurance flood zone
- −$66 /mo · $798/yr
- HOA
- −$0
- Vacancy / Maint / Mgmt
- −$576
- Net cashflow
- $324
Break-even live
UW: 25.0% down · 7.5% · 30yr · 1.5% tax · 5.0% vac · 8.0% maint · 8.0% mgmt
Financing live
Cash to close
- Down payment
- $74,750
- Closing costs
- $8,970
- Reserves months
- —
- Total cash needed
- —
Loan-product check · same deal, 3 products live
Conventional
25% down · 7.5% · 30yr
- Down + closing
- —
- Monthly P&I
- —
- Monthly cashflow
- —
- DSCR
- —
- Eligible?
- —
Personal DTI + credit; lowest rate.
DSCR
20% down · 8.5% · 30yr
- Down + closing
- —
- Monthly P&I
- —
- Monthly cashflow
- —
- DSCR
- —
- Eligible?
- —
No personal income docs; deal must DSCR.
Hard money
10% down · 12.0% · 12mo
- Down + closing
- —
- Monthly P&I
- —
- Monthly cashflow
- —
- DSCR
- —
- Eligible?
- —
Short-term bridge; refi at stabilization.
Rent comps 2 comps
| Address | Beds | Baths | Sqft | Rent | $/sqft | DOM | Units | Dist |
|---|---|---|---|---|---|---|---|---|
| 421 Willowdale Blvd Luling, LA | 4.0 | 3.0 | 2805 | $3,000 | $1.07 | 21d | 1 | 0.96mi |
| 115 Savanna Dr Luling, LA | 4.0 | 2.0 | 2233 | $2,700 | $1.21 | 43d | 1 | 1.16mi |
Listing history 12 events
-
2026-06-18days on market $299,000 Active 15 DOM
-
2026-06-17days on market $299,000 Active 14 DOM
-
2026-06-16days on market $299,000 Active 13 DOM
-
2026-06-15days on market $299,000 Active 12 DOM
-
2026-06-13days on market $299,000 Active 10 DOM
-
2026-06-13days on market $299,000 Active 9 DOM
-
2026-06-10days on market $299,000 Active 7 DOM
-
2026-06-09days on market $299,000 Active 6 DOM
-
2026-06-08days on market $299,000 Active 5 DOM
-
2026-06-07days on market $299,000 Active 4 DOM
-
2026-06-05remarks 693-char remark
-
2026-06-05$299,000 Active 1 DOM
ⓘ Source: listings_history table (triggers on properties + properties_extension) + one-shot
backfill from property_details.listing_events for pre-trigger history.
Tax reassessment forecast LA · Resets to sale price
- Current annual tax
- $992 · $83/mo
- Projected year-2 tax
- $1,644 · $137/mo
- Expected delta
- +$652/yr (+$54/mo · 65.8%)
ⓘ Screening estimate from a state-policy table — verify with the county assessor before closing.
Climate risk First Street
- Flood 9/10 Extreme FEMA zone X (shaded) · 99% chance over 30 yrs
- Wildfire 1/10 Low
- Heat 10/10 Extreme 7 d/yr ≥108°F today · 23 d/yr by 30 yrs out
- Wind 9/10 Extreme 99% chance of damaging wind over 30 yrs
- Air quality 3/10 Moderate 2 unhealthy d/yr today · 3 by 30 yrs out
Nearby sold comps map
Loading sold comps map…
Walkable amenities ~0.75 mi
Loading nearby amenities…
Taxation est. · year 1
- Rental income
- $32,904
- − Mortgage interest
- −$16,749
- − Property taxes
- −$992
- − Insurance
- −$2,292
- − Repairs & maintenance
- −$2,632
- − Management
- −$2,632
- − Depreciation
- −$8,698
- Taxable loss
- −$1,092
- Est. tax savings @ 24.0%
- +$262
- After-tax cash flow
- $4,156/yr
For passive investors: Depreciation is non-cash, so a rental often shows a tax loss while cash-flowing — sheltering income. Rental losses are passive: they offset passive income freely, and up to $25,000/yr can offset ordinary (W-2) income if you actively participate and your MAGI is under $100k (phasing out to $0 by $150k); unused losses carry forward. On sale, claimed depreciation is recaptured at up to 25%, and gains may owe capital-gains tax (a 1031 exchange can defer both). Figures are a year-1 estimate at your 24.0% rate — not tax advice; consult a CPA.
Schools (NCES district)
- District
- St. Charles Parish
- NCES district ID
- 2201440
- Math proficiency
- 40% ▼ -38.00%
- Reading proficiency
- 51% ▼ -32.00%
- Median HH income
- $60,261
- Composite
- 40.0/100
- National rank
- #3830
- State rank
- #14 of 98 in LA
Livability — Luling
- Score
- 65/100
- State rank
- #144
- US rank
- #12653
Category grades
Schools grade is shown separately in the Schools card above.
Census & demographics
- Census place
- Luling, LA
- County
- Saint Charles Parish · 27,180 people
- City population
- 13,960
- Metro
- New Orleans-Metairie, LA
- Population (ZIP)
- 13,960
- Household income
- $76,539
- Rent vs Own
- Severe rent burden
- 362.0
Population outlook (St. Charles County) Hauer SSP2
- Today (2025)
- 53,296 people
- By 2030
- 53,030 · -0.5%
- By 2040
- 51,646 · -3.1%
- By 2050
- 49,771 · -6.6%
- By 2075
- 46,993 · -11.8%
- By 2100
- 44,473 · -16.6%
Race, ethnicity, and origin ACS 2023
- Neighborhood character
- Predominantly White (66%)
- Race & ethnicity
- White 66% Black 18% Two or more races 9% Hispanic / Latino 5% Native American 2% Asian 1%
- Hispanic origin (detail)
- Mexican 3%
- Common ancestry
- Lithuanian 18% Italian 2% Slovak 1%
- Foreign-born
- 2% · Canada, China
- Languages at home
- 95% English-only · Spanish 2% Chinese 1% French/Haitian/Cajun 1%
Political lean MEDSL · St. Charles
- 2024 margin
- Solid R (+32.4) · D 33.0% · R 65.4% · Other 1.6%
- 2008→2024 swing
- -1.1pp toward R · 2008: -31.2pp · 2024: -32.4pp
- All cycles
- 2024: R+32.4 2020: R+29.6 2016: R+30.8 2012: R+27.8 2008: R+31.2
Not yet ingested
- Civics
- —
Market trends
- HPI YoY
- ▼ -60.92%
- Current HPI
- 196.2122
- Rent YoY
- —
- Metro
- New Orleans-Metairie, LA
- State GDP YoY
- ▲ 3.29%
- F500 in state
- 10
Industry mix (Fortune 500 HQ in LA)
| Industry | F500 HQs | Revenue |
|---|---|---|
| Telecommunications | 2 | $23B |
|
||
| Utilities | 1 | $12B |
|
||
| Wholesale / Distribution | 1 | $5B |
|
||
| Advertising | 1 | $2B |
|
||
Price history
+0.0% since first listed2 events — show timeline
- 2026-06-03 Listed $299,000 GBRMLS
- 2026-06-03 Listed $299,000 AcadianaMLS
Property tax history
-0.9%/yrLatest (2024): $992 · -8.1% YoY. Source: county tax records.
Cash-flow waterfall
monthlySold comps — $/sqft
last 12 mo · ≤1 miLoading sold comps…