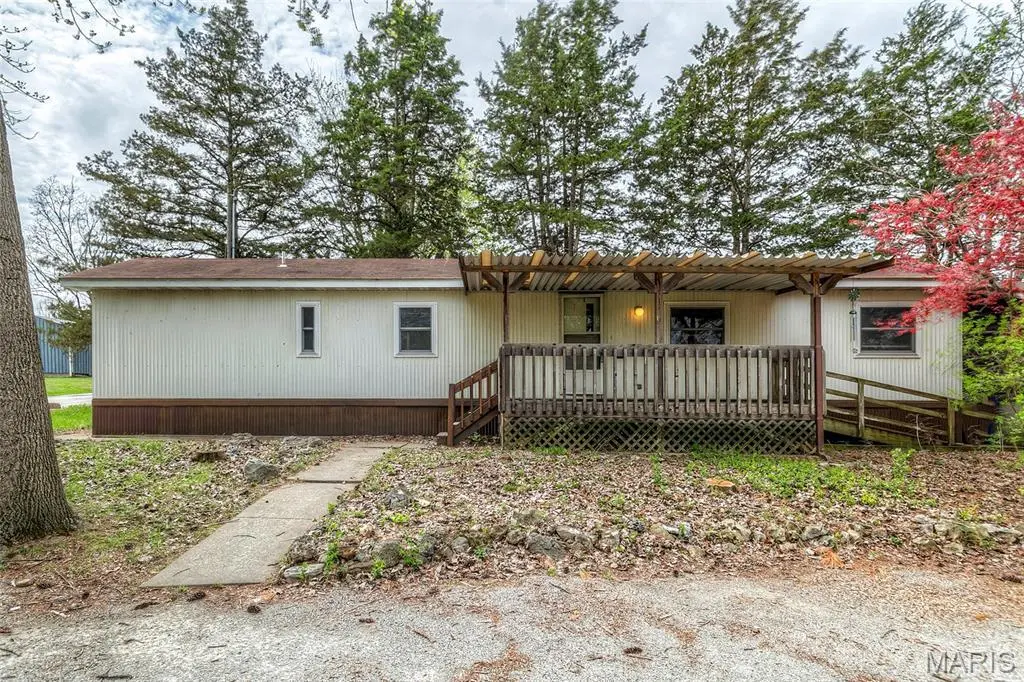
623 Adams St · Moscow Mills, MO
Flood risk No data
- FEMA flood zone
- —
- Chance of flooding over 30 yrs
- —
- Est. flood insurance / yr
- —
Fire risk No data
- Est. fire insurance / yr
- —
Heat risk No data
- Hot days now (above threshold)
- —
- Hot days in 30 yrs
- —
Wind risk No data
- Chance of severe wind over 30 yrs
- —
Air-quality risk No data
- Unhealthy air days now
- —
- Unhealthy air days in 30 yrs
- —
Risk factors via First Street. Map © Google.
Why this score? — see what drove the B- grade
The composite is a weighted blend of 9 inputs, each scored 0–100. Each bar is that input's sub-score; the figure is the points it added to the 100-point composite (weight × sub-score).
- Cash flow +25.9/30.0
- ARV discount +15.0/15.0
- DSCR +8.7/10.0
- 1% rule +5.5/10.0
- Schools +3.8/10.0
- Livability +3.1/5.0
- Rent growth +2.5/5.0
- Condition / age +2.5/5.0
- Appreciation +0.0/10.0
$119,000
🖨 Deal sheet (PDF) 📄 Offer letter ✓ Due diligence
Listing remarks MLS
Entered for comp purposes only.
Key facts
- 0.62 acre lot
- Garage
- Built 1984
Property features AI
Finance
- Other: Living area approximately 840 (public records); Lot size approximately 0.62 acres; Asphalt road access
- Financial info: Lease considered
- HOA & community: Community features include park, restaurant, street lights, and trails
Exterior
- Parking: Circular driveway; Detached garage; Off-street parking; Total parking for 3 vehicles; 1 garage space
- Security: Storm door(s); Panel door(s)
- Utilities: Public water; Public sewer; Electricity connected (single phase)
- Home design: Manufactured home; One level; Private ownership
- Construction: Wood siding; Metal siding; Other siding materials; Shingle roof; Slab foundation; Built as a manufactured/mobile home
- Exterior features: Covered porch; Deck; Private yard; Back yard; Front yard; Corner lot; Many trees; Pie-shaped lot; Private setting; Exterior lighting; Storage
Interior
- Kitchen: Dishwasher; Disposal; Range hood; Electric range; Refrigerator; Pantry; Eat-in kitchen
- Bedrooms: 2 bedrooms (both on the main level)
- Flooring: Carpet; Laminate; Vinyl
- Bathrooms: 1 full bathroom (main level)
- Heating & cooling: Forced air heating; Central air conditioning
- Interior features: Built-in features; Eat-in kitchen; Pantry; Storage; Lighting; Private entrance
- Laundry & utility: Washer and dryer included; Laundry located inside on the main level; Water heater
Neighborhood map
What this means for you Summary
Snapshot
- This is a 2-bed/1.0-bath single-family listed at $119k.
Deal economics
- At list price, monthly cash flow is $292 ($4k/yr) — positive.
- The deal already cash-flows at list — no discount required.
- Meets the 1% rule at list price ($1k rent vs $119k).
- Cap rate 9.2% vs local median 2.6% in Moscow Mills — top-decile yield for the area; either an underpriced asset or a hidden risk that comps aren't pricing in. Stress-test before assuming the spread holds.
Location & tenants
- Location reads 62/100 on livability (#375 in MO) — a middle-class / working-renter tenant base. Strengths: crime A+, cost of living A+, housing A+; Watch: amenities F, commute F, employment F.
- Troy R-III (town): math 40% / reading 47% proficiency, ranked #97 of 324 in MO (top 30%) — families likely to look elsewhere, expect single-tenant / working-renter base with shorter leases.
- Zoned schools: Wm. R. Cappel Elem. (math 39% / reading 41%, grade F, #530 of 1,115 statewide, top 48%, 607 students, 32% FRL); Troy Buchanan High (math 40% / reading 58%, grade D, #145 of 521 statewide, top 28%, 2,188 students, 26% FRL).
- Market conditions: 92 active listings in the ZIP; 2 comparable units currently listed for rent nearby; 149 units permitted in Lincoln County in 2024 (0 in 5+ unit buildings).
Forward outlook
- Local home prices are declining (-3.0%/yr); year-one equity from $823 of loan paydown is wiped out by about $4k of value loss. Plan a longer hold.
- Lincoln County population projected at +6% by 2050 — modest demand growth; plan on rents tracking national, not racing it.
Negotiation context
- Only 6 days on market — expect competitive offers; lowballing is unlikely to land.
- 2 sale attempts since 12y ago with the ask held roughly flat each time — persistent listings suggest the price (not the market) is what's stuck; bring a comps-based counter.
Questions for the listing agent
- Is there a deadline driving the sale (1031 exchange, divorce, estate, relocation)? That informs how much negotiation room exists.
- Schools are D-rated, which usually means shorter tenancies and higher turnover. Who's the typical renter profile here, and what's been the actual vacancy rate?
- What's the average days-on-market for RENTAL listings here right now (not sales)? A rising rental-DOM trend means longer vacancies and softer asking-rent achievability than the comps imply.
- What's the recent tenant-quality profile in this submarket — average credit score on applications, eviction rate, late-payment / NSF rate, and stable-employment percentage? A property-management company in the area should have these aggregated.
- How much new for-sale + rental construction is in the pipeline within 1–3 miles? Heavy new supply typically softens prices + rents 12–24 months out; constrained supply supports both.
Investment metrics
- 1% rule
- 1.05% ✓
- Cap rate
- 9.24%
- Cash-on-cash
- 10.51%
- DSCR
- 1.47
- GRM
- 7.9
CMA / ARV
- ARV (median comp)
- $186,718
- List price
- $119,000
- Delta
- -36.27%
- Verdict
- UNDERPRICED
- Comps
- 5 within 1.0 mi
Projected returns pro-forma
-3.0% appreciation · 3.0% rent growth · sell at horizon
- IRR
- -0.6%
- Equity multiple
- 0.98×
- Total profit
- $-759
- Equity at exit
- $17,743
- IRR
- 9.0%
- Equity multiple
- 1.69×
- Total profit
- $23,030
- Equity at exit
- $10,289
Cash invested: $33,320 (down + closing). Projections, not guarantees.
Landlord ↔ Tenant lean methodology
- Overall (STATE)
- 81 Strongly Landlord-Friendly
- State Missouri
- 81 Strongly Landlord-Friendly · R+10
- County
- — inherits STATE
- City
- — inherits STATE
ZIP-level market 63362
- Home prices YoY
- -31.1%
- Active inventory
- 92
- Price-to-rent
- 7.9×
Monthly cashflow live
- Estimated rent
- $1,251 medium interval (Pro) →
- Mortgage (P&I)
- −$624
- Tax from tax record
- −$23 /mo · $278/yr
- Insurance
- −$50
- HOA
- −$0
- Vacancy / Maint / Mgmt
- −$263
- Net cashflow
- $292
Break-even live
Sensitivity live
| Price | -10% $359 | -5% $325 | +0% $292 | +5% $258 | +10% $224 |
|---|---|---|---|---|---|
| Rent | -10% $193 | -5% $242 | +0% $292 | +5% $341 | +10% $391 |
| Rate | -1.0pp $352 | -0.5pp $322 | base $292 | +0.5pp $261 | +1.0pp $230 |
UW: 25.0% down · 7.5% · 30yr · 1.5% tax · 5.0% vac · 8.0% maint · 8.0% mgmt
Financing live
Cash to close
- Down payment
- $29,750
- Closing costs
- $3,570
- Reserves months
- —
- Total cash needed
- —
Loan-product check · same deal, 3 products live
Conventional
25% down · 7.5% · 30yr
- Down + closing
- —
- Monthly P&I
- —
- Monthly cashflow
- —
- DSCR
- —
- Eligible?
- —
Personal DTI + credit; lowest rate.
DSCR
20% down · 8.5% · 30yr
- Down + closing
- —
- Monthly P&I
- —
- Monthly cashflow
- —
- DSCR
- —
- Eligible?
- —
No personal income docs; deal must DSCR.
Hard money
10% down · 12.0% · 12mo
- Down + closing
- —
- Monthly P&I
- —
- Monthly cashflow
- —
- DSCR
- —
- Eligible?
- —
Short-term bridge; refi at stabilization.
Rent comps 2 comps
| Address | Beds | Baths | Sqft | Rent | $/sqft | DOM | Units | Dist |
|---|---|---|---|---|---|---|---|---|
| 230 Truman Ct Moscow Mills, MO | 3.0 | 1.5 | 1100 | $1,300 | $1.18 | 18d | 1 | 0.38mi |
| 223 Truman Ct Moscow Mills, MO | 3.0 | 1.0 | 1100 | $1,200 | $1.09 | 2d | 1 | 0.40mi |
Listing history 6 events
-
2026-05-14$119,000 Active 871-char remark
-
2026-05-07historical $119,000 871-char remark
-
2023-03-06soldstatus 31-char remark
Show marketing remark (31 chars)
Entered for comp purposes only.
-
2014-02-25soldstatus
-
2014-02-20soldstatus
Show marketing remark (295 chars)
Great Investment Property! Special district zoning allows residential or commercial use. Exceptional condition and ready for you or your tenant. This would make a great rental property while you wait for the commercial value to rise! Location! Location! Location! Excellent detached garage!
-
2014-02-07$44,900
Show marketing remark (295 chars)
Great Investment Property! Special district zoning allows residential or commercial use. Exceptional condition and ready for you or your tenant. This would make a great rental property while you wait for the commercial value to rise! Location! Location! Location! Excellent detached garage!
ⓘ Source: listings_history table (triggers on properties + properties_extension) + one-shot
backfill from property_details.listing_events for pre-trigger history.
Tax reassessment forecast MO · Resets to sale price
- Current annual tax
- $278 · $23/mo
- Projected year-2 tax
- $1,154 · $96/mo
- Expected delta
- +$876/yr (+$73/mo · 315.2%)
ⓘ Screening estimate from a state-policy table — verify with the county assessor before closing.
Nearby sold comps map
Loading sold comps map…
Walkable amenities ~0.75 mi
Loading nearby amenities…
Taxation est. · year 1
- Rental income
- $15,016
- − Mortgage interest
- −$6,666
- − Property taxes
- −$278
- − Insurance
- −$595
- − Repairs & maintenance
- −$1,201
- − Management
- −$1,201
- − Depreciation
- −$3,462
- Taxable income
- $1,613
- Est. tax owed @ 24.0%
- −$387
- After-tax cash flow
- $3,114/yr
For passive investors: Depreciation is non-cash, so a rental often shows a tax loss while cash-flowing — sheltering income. Rental losses are passive: they offset passive income freely, and up to $25,000/yr can offset ordinary (W-2) income if you actively participate and your MAGI is under $100k (phasing out to $0 by $150k); unused losses carry forward. On sale, claimed depreciation is recaptured at up to 25%, and gains may owe capital-gains tax (a 1031 exchange can defer both). Figures are a year-1 estimate at your 24.0% rate — not tax advice; consult a CPA.
Schools (NCES district)
- District
- Troy R-III
- NCES district ID
- 2930450
- Math proficiency
- 40% ▼ -4.00%
- Reading proficiency
- 47% ▼ -1.00%
- Median HH income
- $56,629
- Composite
- 38.01/100
- National rank
- #4288
- State rank
- #97 of 324 in MO
Livability — Moscow Mills
- Score
- 62/100
- State rank
- #375
- US rank
- #16517
Category grades
Schools grade is shown separately in the Schools card above.
Census & demographics
- Census place
- Moscow Mills, MO
- Population (ZIP)
- 9,247
Population outlook (Lincoln County) Hauer SSP2
- Today (2025)
- 58,571 people
- By 2030
- 60,050 · +2.5%
- By 2040
- 61,982 · +5.8%
- By 2050
- 61,790 · +5.5%
- By 2075
- 58,249 · -0.5%
- By 2100
- 48,815 · -16.7%
Race, ethnicity, and origin ACS 2023
- Neighborhood character
- Predominantly White (91%)
- Race & ethnicity
- White 91% Hispanic / Latino 5% Two or more races 4% Black 3%
- Common ancestry
- Romanian 7% Slovak 3% Lithuanian 3%
- Foreign-born
- 1% · Canada
- Languages at home
- 97% English-only · Spanish 2%
Political lean MEDSL · Lincoln
- 2024 margin
- Solid R (+55.9) · D 21.5% · R 77.4% · Other 1.1%
- 2008→2024 swing
- -44.5pp toward R · 2008: -11.4pp · 2024: -55.9pp
- All cycles
- 2024: R+55.9 2020: R+52.5 2016: R+50.5 2012: R+29.1 2008: R+11.4
Not yet ingested
- Civics
- —
Market trends
- HPI YoY
- ▼ -88.35%
- Current HPI
- 195.6311
- Rent YoY
- —
- Metro
- —
- State GDP YoY
- ▲ 1.84%
- F500 in state
- 20
Industry mix (Fortune 500 HQ in MO)
| Industry | F500 HQs | Revenue |
|---|---|---|
| Healthcare | 1 | $163B |
|
||
| Insurance | 1 | $21B |
|
||
| Industrial Technology | 1 | $17B |
|
||
| Retail | 1 | $16B |
|
||
| Industrial Distribution | 1 | $10B |
|
||
| Utilities | 1 | $9B |
|
||
Price history
+165.0% since first listed8 events — show timeline
- 2026-06-03 Sold (MLS) — MARIS as Distributed by MLS Grid
- 2026-05-19 Pending — MARIS as Distributed by MLS Grid
- 2026-05-14 Listed $119,000 MARIS as Distributed by MLS Grid
- 2026-05-07 Coming Soon $119,000 MARIS as Distributed by MLS Grid
- 2023-03-06 Sold (MLS) — MARIS as Distributed by MLS Grid
- 2014-02-25 Sold (Public Records) — Public Records
- 2014-02-20 Sold (MLS) — MARIS as Distributed by MLS Grid
- 2014-02-07 Listed $44,900 MARIS as Distributed by MLS Grid
Property tax history
+10.5%/yrLatest (2017): $278 · +34.3% YoY. Source: county tax records.
Cash-flow waterfall
monthlySold comps — $/sqft
last 12 mo · ≤1 miLoading sold comps…