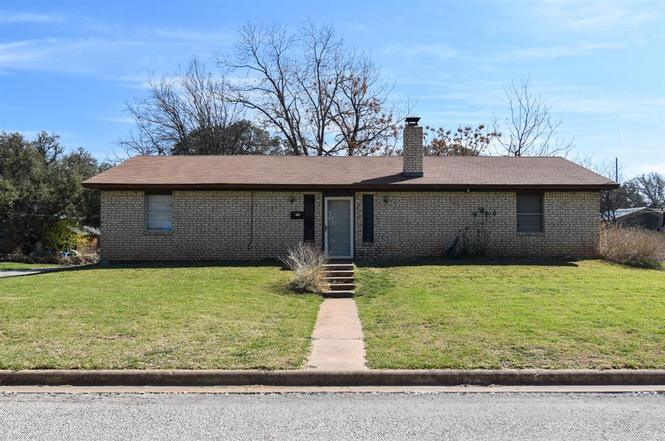
1801 S College St · Brady, TX
Flood risk 1/10 · Minimal
- FEMA flood zone
- X
- Chance of flooding over 30 yrs
- 0.0%
- Est. flood insurance / yr
- $507 – $1,088
Fire risk 5/10 · Moderate
- Est. fire insurance / yr
- $1,222 – $2,270
Heat risk 6/10 · Moderate
- Hot days now (above 105°F)
- 7 days/yr
- Hot days in 30 yrs
- 21 days/yr
Wind risk 6/10 · Moderate
- Chance of severe wind over 30 yrs
- 27.0%
Air-quality risk 1/10 · Minimal
- Unhealthy air days now
- 0 days/yr
- Unhealthy air days in 30 yrs
- 0 days/yr
Risk factors via First Street. Map © Google.
Why this score? — see what drove the D+ grade
The composite is a weighted blend of 9 inputs, each scored 0–100. Each bar is that input's sub-score; the figure is the points it added to the 100-point composite (weight × sub-score).
- ARV discount +13.9/15.0
- Appreciation +8.3/10.0
- Cash flow +7.6/30.0
- Schools +4.0/10.0
- Livability +3.6/5.0
- Rent growth +2.5/5.0
- Condition / age +2.5/5.0
- 1% rule +2.4/10.0
- DSCR +1.7/10.0
$159,900
🖨 Deal sheet 📄 Offer letter ✓ Due diligence
Listing remarks
This charming brick 3 bedroom, 2 bath home sits on an adorable corner lot and offers a warm, inviting layout perfect for everyday living. The living room features a beautiful brick corner fireplace, creating a cozy focal point and a great place to gather. The spacious kitchen offers abundant counter space, making meal prep and entertaining easy. Just off the kitchen, the laundry room includes a convenient folding table, adding extra functionality and organization to your daily routine. Outside, the attached carport provides covered parking and easy access to the home. With its comfortable layout and well-maintained features, this move-in ready home is a wonderful opportunity for families, f
Key facts
- Attached carport
- 9,104 sq ft lot
- 2 parking spots
Tags
Property features AI
Finance
- Other: Listing status: Active Under Contract; Possession at closing/funding
- Financial info: Second mortgage: No; Loan type: Treat as clear
- HOA & community: No association
Exterior
- Parking: Covered carport with 2 covered spaces; Driveway parking
- Security: No security features listed
- Utilities: Electricity connected; Not in a municipal utility district
- Home design: Single-family residence; One story; Property attached: Yes
- Construction: Built in 1978; No additional construction material or foundation details listed
- Exterior features: Lot under 0.5 acre (approx. 0.209 acres); Subdivision: Brackeen; Directions: From the Brady square, go South on Bridge Street, turn right on 17th Street, turn left on College Street; home is on the right
Interior
- Kitchen: Electric range; Kitchen island
- Bedrooms: 3 bedrooms (primary bedroom on level 1, approx. 12 x 12)
- Flooring: No flooring information listed
- Bathrooms: 2 full bathrooms
- Heating & cooling: No heating or cooling information listed; Wood-burning fireplace
- Interior features: High-speed internet available; Kitchen island; One living area; One dining area; Room count of 2
- Laundry & utility: No specific laundry details listed
Neighborhood map
What this means for you Summary
Snapshot
- This is a 3-bed/1.0-bath single-family listed at $160k.
Deal economics
- At list price, monthly cash flow is $-189 ($-2k/yr) — negative.
- To cash-flow at today's rent, offer at most $127k (20.9% below list).
- To meet the 1% rule (rent ≥ 1% of price), the offer needs to be $118k (26.2% below list).
- Recommended offer: $118k (26.2% below list) — sets the bar for 1% rule.
- Cap rate 4.9% vs local median 3.5% in Brady — top-decile yield for the area; either an underpriced asset or a hidden risk that comps aren't pricing in. Stress-test before assuming the spread holds.
Location & tenants
- Location reads 72/100 on livability (#270 in TX) — a middle-class / working-renter tenant base. Strengths: cost of living A+, housing A+, health & safety A+; Watch: employment D, amenities F, commute F.
- Brady ISD (rural): math 50% / reading 46% proficiency, ranked #238 of 826 in TX (top 29%) — families likely to look elsewhere, expect single-tenant / working-renter base with shorter leases.
- Zoned schools: Brady El (math 33% / reading 34%, grade F, #2,174 of 4,322 statewide, top 51%, 476 students, 74% FRL) — zoned schools average 74% FRL vs 52% district-wide (22 pts higher); higher-poverty schools than district average — tighter screening recommended.
- Zoned-school proficiency averages 34% at this address vs 48% district-wide (-14 pts) — the specific schools serving this property underperform the Brady ISD average; the district grade overstates school quality for this exact location.
- Market conditions: 105 active listings in the ZIP; 2 units permitted in McCulloch County in 2024 (0 in 5+ unit buildings).
Forward outlook
- In year one you build about $12k of equity ($1k loan paydown + $10k appreciation (6.5% local appreciation)).
- By year 4, paydown + projected appreciation supports a ~$39k cash-out refi (75% LTV) — recoverable capital for the next deal without selling this one.
Negotiation context
- It's been on market 68 days — a 6% lower offer ($150k) is reasonable based on typical stale-listing flexibility.
Risks & watch-outs
- Climate carrying-cost: major wind risk, 27% chance of damaging wind over 30y; moderate wildfire risk; extreme-heat days projected 7→21/yr by 2055 (HVAC capex compounding) — expect insurance premiums to compound above CPI over the hold.
Questions for the listing agent
- What do current leases actually rent for vs. the listed asking? Can we see a recent rent roll and the last 12 months of T-12 income?
- It's been on market 68 days. Have you received any prior offers? Is the seller open to a 26% concession, seller financing, or rate buy-down credit?
- Built in 1978 — when were the roof, HVAC, electrical panel, plumbing, and water heater last replaced?
- Why hasn't it sold? Are there any deal-killer items the seller is aware of (foundation, flood, title, zoning, code violations)?
- Is there a deadline driving the sale (1031 exchange, divorce, estate, relocation)? That informs how much negotiation room exists.
- Schools are D-rated, which usually means shorter tenancies and higher turnover. Who's the typical renter profile here, and what's been the actual vacancy rate?
- The area grade is low — what's the realistic commute time and amenity access for the typical tenant pool here? Any planned neighborhood developments (good or bad) we should know about?
- What's the average days-on-market for RENTAL listings here right now (not sales)? A rising rental-DOM trend means longer vacancies and softer asking-rent achievability than the comps imply.
- What's the recent tenant-quality profile in this submarket — average credit score on applications, eviction rate, late-payment / NSF rate, and stable-employment percentage? A property-management company in the area should have these aggregated.
- How much new for-sale + rental construction is in the pipeline within 1–3 miles? Heavy new supply typically softens prices + rents 12–24 months out; constrained supply supports both.
Investment metrics
- 1% rule
- 0.74% ✗
- Cap rate
- 4.87%
- Cash-on-cash
- -5.07%
- DSCR
- 0.77
- GRM
- 11.3
CMA / ARV
- ARV (on-the-fly)
- $186,368
- Comps found
- 9
Show comp detail 9 sales within ~0.75 mi
| Address | Dist | Beds/Ba | Sqft | Sold | Price | $/sf | Match |
|---|---|---|---|---|---|---|---|
| 1308 S Cypress | 0.37mi | 3/2.0 | 1,440 (-1%) | 4mo | $185,000 | $128 | 74 |
| 2007 Stanton St | 0.30mi | 3/1.5 | 1,383 (-5%) | 3mo | $159,000 | $115 | 73 |
| 1815 S Oak St | 0.36mi | 3/2.0 | 1,314 (-10%) | 1mo | $179,000 | $136 | 62 |
| 1307 S China St | 0.40mi | 3/2.0 | 1,440 (-1%) | 21mo | $200,000 | $139 | 58 |
| 1904 S Pine | 0.14mi | 3/1.0 | 1,241 (-15%) | 19mo | $85,000 | $68 | 53 |
| 2001 S High | 0.27mi | 3/2.0 | 1,645 (+13%) | 12mo | $184,500 | $112 | 52 |
| 1205 S Cypress | 0.42mi | 2/1.0 (-1) | 1,319 (-9%) | 18mo | $112,000 | $85 | 44 |
| 2019 S China St | 0.53mi | 3/2.0 | 1,363 (-6%) | 23mo | $225,000 | $165 | 41 |
| 2020 Old Calf Creek Rd | 0.66mi | 3/2.0 | 1,654 (+14%) | 2mo | $215,000 | $130 | 41 |
Match score weights: distance 35% · size 25% · config 20% · recency 20%. Top-matched comps best support the ARV.
Projected returns pro-forma
6.53% appreciation · 3.0% rent growth · sell at horizon
- IRR
- 12.6%
- Equity multiple
- 1.88×
- Total profit
- $39,214
- Equity at exit
- $105,900
- IRR
- 13.2%
- Equity multiple
- 3.76×
- Total profit
- $123,651
- Equity at exit
- $196,870
Cash invested: $44,772 (down + closing). Projections, not guarantees.
Landlord ↔ Tenant lean methodology
- Overall (STATE)
- 87 Strongly Landlord-Friendly
- State Texas
- 87 Strongly Landlord-Friendly · R+5
- County
- — inherits STATE
- City
- — inherits STATE
ZIP-level market 76825
- Home prices YoY
- 4.2%
- Active inventory
- 105
- Price-to-rent
- 11.3×
Monthly cashflow live
- Estimated rent
- $1,180 medium interval (Pro) →
- Mortgage (P&I)
- −$839
- Tax from tax record
- −$216 /mo · $2,588/yr
- Insurance
- −$67
- HOA
- −$0
- Vacancy / Maint / Mgmt
- −$248
- Net cashflow
- $-189
Break-even live
UW: 25.0% down · 7.5% · 30yr · 1.5% tax · 5.0% vac · 8.0% maint · 8.0% mgmt
Financing live
Cash to close
- Down payment
- $39,975
- Closing costs
- $4,797
- Reserves months
- —
- Total cash needed
- —
Loan-product check · same deal, 3 products live
Conventional
25% down · 7.5% · 30yr
- Down + closing
- —
- Monthly P&I
- —
- Monthly cashflow
- —
- DSCR
- —
- Eligible?
- —
Personal DTI + credit; lowest rate.
DSCR
20% down · 8.5% · 30yr
- Down + closing
- —
- Monthly P&I
- —
- Monthly cashflow
- —
- DSCR
- —
- Eligible?
- —
No personal income docs; deal must DSCR.
Hard money
10% down · 12.0% · 12mo
- Down + closing
- —
- Monthly P&I
- —
- Monthly cashflow
- —
- DSCR
- —
- Eligible?
- —
Short-term bridge; refi at stabilization.
Listing history 9 events
-
2026-05-12status Pending
-
2026-05-01historical Active Option Contract
-
2026-03-05$159,900 Active
-
1996-04-04soldstatus
-
1988-12-30soldstatus
-
1980-03-07soldstatus
-
1978-04-27soldstatus
-
1977-08-08soldstatus
-
1977-08-08soldstatus
ⓘ Source: listings_history table (triggers on properties + properties_extension) + one-shot
backfill from property_details.listing_events for pre-trigger history.
Tax reassessment forecast TX · Resets to sale price
- Current annual tax
- $2,588 · $216/mo
- Projected year-2 tax
- $2,926 · $244/mo
- Expected delta
- +$338/yr (+$28/mo · 13.1%)
ⓘ Screening estimate from a state-policy table — verify with the county assessor before closing.
Climate risk First Street
- Flood 1/10 Low FEMA zone X · 0% chance over 30 yrs
- Wildfire 5/10 Major
- Heat 6/10 Major 7 d/yr ≥105°F today · 21 d/yr by 30 yrs out
- Wind 6/10 Major 27% chance of damaging wind over 30 yrs
- Air quality 1/10 Low 0 unhealthy d/yr today · 0 by 30 yrs out
Nearby sold comps map
Loading sold comps map…
Walkable amenities ~0.75 mi
Loading nearby amenities…
Taxation est. · year 1
- Rental income
- $14,154
- − Mortgage interest
- −$8,957
- − Property taxes
- −$2,588
- − Insurance
- −$800
- − Repairs & maintenance
- −$1,132
- − Management
- −$1,132
- − Depreciation
- −$4,652
- Taxable loss
- −$5,107
- Est. tax savings @ 24.0%
- +$1,226
- After-tax cash flow
- $-1,043/yr
For passive investors: Depreciation is non-cash, so a rental often shows a tax loss while cash-flowing — sheltering income. Rental losses are passive: they offset passive income freely, and up to $25,000/yr can offset ordinary (W-2) income if you actively participate and your MAGI is under $100k (phasing out to $0 by $150k); unused losses carry forward. On sale, claimed depreciation is recaptured at up to 25%, and gains may owe capital-gains tax (a 1031 exchange can defer both). Figures are a year-1 estimate at your 24.0% rate — not tax advice; consult a CPA.
Schools (NCES district)
- District
- Brady ISD
- NCES district ID
- 4811110
- Math proficiency
- 50% ▼ -2.00%
- Reading proficiency
- 46% ▲ 2.00%
- Median HH income
- $38,179
- Composite
- 40.02/100
- National rank
- #3826
- State rank
- #238 of 826 in TX
Livability — Brady
- Score
- 72/100
- State rank
- #270
- US rank
- #6336
Category grades
Schools grade is shown separately in the Schools card above.
Census & demographics
- Census place
- Brady, TX
- Population (ZIP)
- 6,595
Population outlook (McCulloch County) Hauer SSP2
- Today (2025)
- 8,509 people
- By 2030
- 8,544 · +0.4%
- By 2040
- 8,555 · +0.5%
- By 2050
- 8,486 · -0.3%
- By 2075
- 8,089 · -4.9%
- By 2100
- 6,599 · -22.4%
Race, ethnicity, and origin ACS 2023
- Neighborhood character
- Majority White (60%)
- Race & ethnicity
- White 60% Hispanic / Latino 33% Two or more races 21%
- Hispanic origin (detail)
- Mexican 30%
- Common ancestry
- Italian 8% Lithuanian 3% Portuguese 2%
- Foreign-born
- 6% · Canada, Vietnam
- Languages at home
- 72% English-only · Spanish 27%
Political lean MEDSL · McCulloch
- 2024 margin
- Solid R (+73.4) · D 12.9% · R 86.3%
- 2008→2024 swing
- -22.4pp toward R · 2008: -51.0pp · 2024: -73.4pp
- All cycles
- 2024: R+73.4 2020: R+70.3 2016: R+67.0 2012: R+62.9 2008: R+51.0
Not yet ingested
- Civics
- —
Market trends
- HPI YoY
- ▲ 6.53%
- Current HPI
- 161.5061
- Rent YoY
- —
- Metro
- —
- State GDP YoY
- ▲ 3.95%
- F500 in state
- 110
Industry mix (Fortune 500 HQ in TX)
| Industry | F500 HQs | Revenue |
|---|---|---|
| Energy | 16 | $1,198B |
|
||
| Technology | 5 | $198B |
|
||
| Engineering / Construction | 4 | $72B |
|
||
| Energy Services | 3 | $60B |
|
||
| Utilities | 3 | $41B |
|
||
| Healthcare | 2 | $330B |
|
||
Price history
9 events — show timeline
- 2026-05-12 Pending — NTREIS
- 2026-05-01 Contingent — NTREIS
- 2026-03-05 Listed $159,900 NTREIS
- 1996-04-04 Sold (Public Records) — Public Records
- 1988-12-30 Sold (Public Records) — Public Records
- 1980-03-07 Sold (Public Records) — Public Records
- 1978-04-27 Sold (Public Records) — Public Records
- 1977-08-08 Sold (Public Records) — Public Records
- 1977-08-08 Sold (Public Records) — Public Records
Property tax history
+4.0%/yrLatest (2025): $2,588 · +6.2% YoY. Source: county tax records.
Cash-flow waterfall
monthlySold comps — $/sqft
last 12 mo · ≤1 miLoading sold comps…