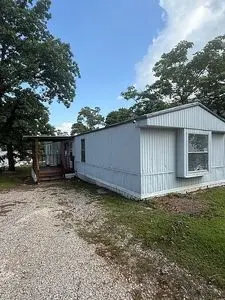
223 Mount Carmel Rd · Hudson, TX
Flood risk 1/10 · Minimal
- FEMA flood zone
- X (unshaded)
- Chance of flooding over 30 yrs
- 0.0%
- Est. flood insurance / yr
- $507 – $1,088
Fire risk 5/10 · Moderate
- Est. fire insurance / yr
- $1,222 – $2,270
Heat risk 8/10 · Major
- Hot days now (above 111°F)
- 7 days/yr
- Hot days in 30 yrs
- 25 days/yr
Wind risk 8/10 · Major
- Chance of severe wind over 30 yrs
- 80.0%
Air-quality risk 1/10 · Minimal
- Unhealthy air days now
- 0 days/yr
- Unhealthy air days in 30 yrs
- 0 days/yr
Risk factors via First Street. Map © Google.
Why this score? — see what drove the D+ grade
The composite is a weighted blend of 9 inputs, each scored 0–100. Each bar is that input's sub-score; the figure is the points it added to the 100-point composite (weight × sub-score).
- Cash flow +15.0/30.0
- ARV discount +7.5/15.0
- 1% rule +5.0/10.0
- DSCR +5.0/10.0
- Schools +4.9/10.0
- Livability +3.2/5.0
- Rent growth +2.5/5.0
- Condition / age +2.5/5.0
- Appreciation +0.0/10.0
$8,000
🖨 Deal sheet 📄 Offer letter ✓ Due diligence
Listing remarks
Located in Meadowbrook Mobile Home Community, this 3-bedroom, 2-bath home is a true diamond in the rough! This home is sold as is priced at just $8,000, it offers a great opportunity to add your personal touch and create a space that truly feels like home. Monthly lot lease is $540, with an additional $20 for trash service and $15 for sewer, plus water based on usage. Pets are welcome (up to 2) with breed and weight restrictions. Inside, you & acirc; & euro; & trade; ll find a large kitchen and dining area with an open view into the living room, perfect for everyday living and entertaining. Natural light flows throughout the home, creating a bright and welcoming atmosphere. The
Key facts
- Soaking tub
- Large walk-in closet
- Ensuite bathroom
Tags
Neighborhood map
What this means for you Summary
Snapshot
- This is a 3-bed/2.0-bath manufactured listed at $8k.
Deal economics
- At list price, monthly cash flow is $973 ($12k/yr) — positive.
- The deal already cash-flows at list — no discount required.
- Meets the 1% rule at list price ($1k rent vs $8k).
- Recommended offer: $8k (1.5% below list) — sets the bar for market timing.
- Cap rate 152.2% vs local median 3.0% in Hudson — top-decile yield for the area; either an underpriced asset or a hidden risk that comps aren't pricing in. Stress-test before assuming the spread holds.
Location & tenants
- Location reads 64/100 on livability (#791 in TX) — a middle-class / working-renter tenant base. Strengths: crime A+, cost of living A+, housing A+; Watch: schools F, amenities F, commute F.
- Hudson ISD (rural): math 63% / reading 54% proficiency, ranked #85 of 826 in TX (top 10%) — acceptable for families but not a draw, mixed tenant base, ~2y average lease.
- Market conditions: 292 active listings in the ZIP; 3 comparable units currently listed for rent nearby; rentals lingering (median 44d on market — plan ~5-8 weeks vacancy on turnover, expect pricing pressure); 100% of comp listings sitting > 30 days — soft ceiling on asking rent; 120 units permitted in Angelina County in 2024 (0 in 5+ unit buildings).
Forward outlook
- Local home prices are declining (-3.0%/yr); year-one equity from $55 of loan paydown is wiped out by about $240 of value loss. Plan a longer hold.
- At projected returns (-3.0% appreciation + 3.0% rent growth), your $2k cash investment doubles in ~1 year — after that, you're playing with house money.
Negotiation context
- It's been on market 15 days — a 2% lower offer ($8k) is reasonable based on typical stale-listing flexibility.
Risks & watch-outs
- Watch-outs: property tax is 2.6% of price.
- Climate carrying-cost: severe wind risk, 80% chance of damaging wind over 30y; moderate wildfire risk; extreme-heat days projected 7→25/yr by 2055 (HVAC capex compounding) — expect insurance premiums to compound above CPI over the hold.
Questions for the listing agent
- Property tax is high relative to price — has the assessment been appealed recently, and will the sale trigger a re-assessment?
- Is there a deadline driving the sale (1031 exchange, divorce, estate, relocation)? That informs how much negotiation room exists.
- Schools are F-rated, which usually means shorter tenancies and higher turnover. Who's the typical renter profile here, and what's been the actual vacancy rate?
- The area grade is low — what's the realistic commute time and amenity access for the typical tenant pool here? Any planned neighborhood developments (good or bad) we should know about?
- What's the average days-on-market for RENTAL listings here right now (not sales)? A rising rental-DOM trend means longer vacancies and softer asking-rent achievability than the comps imply.
- What's the recent tenant-quality profile in this submarket — average credit score on applications, eviction rate, late-payment / NSF rate, and stable-employment percentage? A property-management company in the area should have these aggregated.
- How much new for-sale + rental construction is in the pipeline within 1–3 miles? Heavy new supply typically softens prices + rents 12–24 months out; constrained supply supports both.
Investment metrics
- 1% rule
- 16.38% ✓
- Cap rate
- 152.24%
- Cash-on-cash
- 521.22%
- DSCR
- 24.19
- GRM
- 0.5
CMA / ARV
No comps found within radius.
Projected returns pro-forma
-3.0% appreciation · 3.0% rent growth · sell at horizon
- IRR
- —
- Equity multiple
- 28.10×
- Total profit
- $60,695
- Equity at exit
- $1,193
- IRR
- —
- Equity multiple
- 60.26×
- Total profit
- $132,744
- Equity at exit
- $692
Cash invested: $2,240 (down + closing). Projections, not guarantees.
Landlord ↔ Tenant lean methodology
- Overall (STATE)
- 87 Strongly Landlord-Friendly
- State Texas
- 87 Strongly Landlord-Friendly · R+5
- County
- — inherits STATE
- City
- — inherits STATE
ZIP-level market 75904
- Home prices YoY
- -25.1%
- Active inventory
- 292
- Price-to-rent
- 0.5×
Monthly cashflow live
- Estimated rent
- $1,311 medium interval (Pro) →
- Mortgage (P&I)
- −$42
- Tax from tax record
- −$17 /mo · $206/yr
- Insurance
- −$3
- HOA
- −$0
- Vacancy / Maint / Mgmt
- −$275
- Net cashflow
- $973
Break-even live
UW: 25.0% down · 7.5% · 30yr · 1.5% tax · 5.0% vac · 8.0% maint · 8.0% mgmt
Financing live
Cash to close
- Down payment
- $2,000
- Closing costs
- $240
- Reserves months
- —
- Total cash needed
- —
Loan-product check · same deal, 3 products live
Conventional
25% down · 7.5% · 30yr
- Down + closing
- —
- Monthly P&I
- —
- Monthly cashflow
- —
- DSCR
- —
- Eligible?
- —
Personal DTI + credit; lowest rate.
DSCR
20% down · 8.5% · 30yr
- Down + closing
- —
- Monthly P&I
- —
- Monthly cashflow
- —
- DSCR
- —
- Eligible?
- —
No personal income docs; deal must DSCR.
Hard money
10% down · 12.0% · 12mo
- Down + closing
- —
- Monthly P&I
- —
- Monthly cashflow
- —
- DSCR
- —
- Eligible?
- —
Short-term bridge; refi at stabilization.
Rent comps 3 comps
| Address | Beds | Baths | Sqft | Rent | $/sqft | DOM | Units | Dist |
|---|---|---|---|---|---|---|---|---|
| 861 Mount Carmel Rd Lufkin, TX | 3.0 | 2.0 | 1216 | $1,045 | $0.86 | 43d | 4 | 0.61mi |
| 3011 Ted Trout Dr Lot 11 Lufkin, TX | 3.0 | 2.0 | 1216 | $1,095 | $0.90 | 43d | 1 | 0.74mi |
| 300 S John Redditt Dr Lufkin, TX | 2.0 | 1.0 | 642 | $1,150 | $1.79 | 43d | 4 | 1.33mi |
Listing history 1 events
-
2026-05-12$8,000 Active 1199-char remark
ⓘ Source: listings_history table (triggers on properties + properties_extension) + one-shot
backfill from property_details.listing_events for pre-trigger history.
Tax reassessment forecast TX · Resets to sale price
- Current annual tax
- $206 · $17/mo
- Projected year-2 tax
- $206 · $17/mo
- Expected delta
- $0/yr ($0/mo · 0.0%)
ⓘ Screening estimate from a state-policy table — verify with the county assessor before closing.
Climate risk First Street
- Flood 1/10 Low FEMA zone X (unshaded) · 0% chance over 30 yrs
- Wildfire 5/10 Major
- Heat 8/10 Severe 7 d/yr ≥111°F today · 25 d/yr by 30 yrs out
- Wind 8/10 Severe 80% chance of damaging wind over 30 yrs
- Air quality 1/10 Low 0 unhealthy d/yr today · 0 by 30 yrs out
Nearby sold comps map
Loading sold comps map…
Walkable amenities ~0.75 mi
Loading nearby amenities…
Taxation est. · year 1
- Rental income
- $15,727
- − Mortgage interest
- −$448
- − Property taxes
- −$206
- − Insurance
- −$40
- − Repairs & maintenance
- −$1,258
- − Management
- −$1,258
- − Depreciation
- −$233
- Taxable income
- $12,284
- Est. tax owed @ 24.0%
- −$2,948
- After-tax cash flow
- $8,727/yr
For passive investors: Depreciation is non-cash, so a rental often shows a tax loss while cash-flowing — sheltering income. Rental losses are passive: they offset passive income freely, and up to $25,000/yr can offset ordinary (W-2) income if you actively participate and your MAGI is under $100k (phasing out to $0 by $150k); unused losses carry forward. On sale, claimed depreciation is recaptured at up to 25%, and gains may owe capital-gains tax (a 1031 exchange can defer both). Figures are a year-1 estimate at your 24.0% rate — not tax advice; consult a CPA.
Schools (NCES district)
- District
- Hudson ISD
- NCES district ID
- 4823790
- Math proficiency
- 63% ▼ -3.00%
- Reading proficiency
- 54% ▲ 1.00%
- Median HH income
- $45,047
- Composite
- 49.4/100
- National rank
- #2012
- State rank
- #85 of 826 in TX
Livability — Hudson
- Score
- 64/100
- State rank
- #791
- US rank
- #14441
Category grades
Schools grade is shown separately in the Schools card above.
Census & demographics
- Census place
- Hudson, TX
- County
- Angelina County · 62,696 people
- City population
- 62,696
- Metro
- Lufkin, TX
- Population (ZIP)
- 34,462
- Household income
- $60,205
- Rent vs Own
- Severe rent burden
- 1159.0
Population outlook (Angelina County) Hauer SSP2
- Today (2025)
- 90,174 people
- By 2030
- 90,697 · +0.6%
- By 2040
- 91,291 · +1.2%
- By 2050
- 91,168 · +1.1%
- By 2075
- 88,961 · -1.3%
- By 2100
- 80,590 · -10.6%
Race, ethnicity, and origin ACS 2023
- Neighborhood character
- Diverse neighborhood (Simpson 0.58)
- Race & ethnicity
- White 60% Hispanic / Latino 19% Black 16% Two or more races 12% Native American 2%
- Hispanic origin (detail)
- Mexican 17%
- Common ancestry
- Romanian 2% Slovak 1% Lithuanian 1%
- Foreign-born
- 6% · Canada
- Languages at home
- 86% English-only · Spanish 14%
Political lean MEDSL · Angelina
- 2024 margin
- Solid R (+52.0) · D 23.7% · R 75.7%
- 2008→2024 swing
- -17.0pp toward R · 2008: -35.0pp · 2024: -52.0pp
- All cycles
- 2024: R+52.0 2020: R+46.1 2016: R+47.3 2012: R+43.9 2008: R+35.0
Not yet ingested
- Civics
- —
Market trends
- HPI YoY
- ▼ -71.71%
- Current HPI
- 213.4236
- Rent YoY
- —
- Metro
- Lufkin, TX
- State GDP YoY
- ▲ 3.95%
- F500 in state
- 110
Industry mix (Fortune 500 HQ in TX)
| Industry | F500 HQs | Revenue |
|---|---|---|
| Energy | 16 | $1,198B |
|
||
| Technology | 5 | $198B |
|
||
| Engineering / Construction | 4 | $72B |
|
||
| Energy Services | 3 | $60B |
|
||
| Utilities | 3 | $41B |
|
||
| Healthcare | 2 | $330B |
|
||
Property tax history
-1.6%/yrLatest (2025): $206 · -1.7% YoY. Source: county tax records.
Cash-flow waterfall
monthlySold comps — $/sqft
last 12 mo · ≤1 miLoading sold comps…