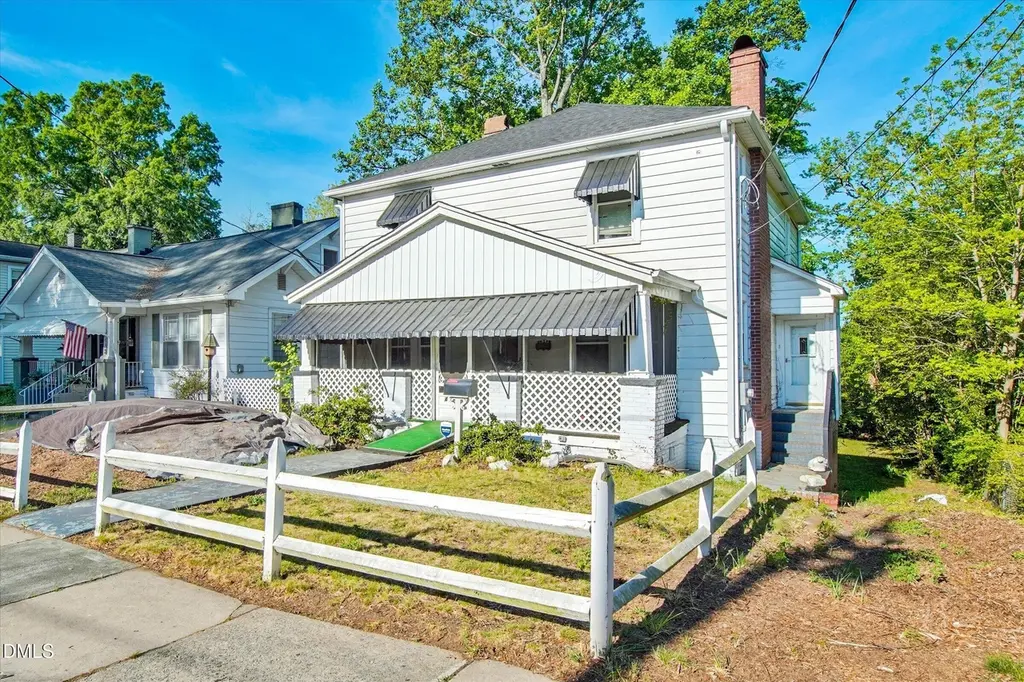
415 N Hyde Park Ave · Durham, NC
Flood risk 1/10 · Minimal
- FEMA flood zone
- X (unshaded)
- Chance of flooding over 30 yrs
- 0.0%
- Est. flood insurance / yr
- $507 – $1,088
Fire risk 1/10 · Minimal
- Est. fire insurance / yr
- $906 – $1,684
Heat risk 6/10 · Moderate
- Hot days now (above 106°F)
- 7 days/yr
- Hot days in 30 yrs
- 16 days/yr
Wind risk 6/10 · Moderate
- Chance of severe wind over 30 yrs
- 27.0%
Air-quality risk 2/10 · Minimal
- Unhealthy air days now
- 1 days/yr
- Unhealthy air days in 30 yrs
- 1 days/yr
Risk factors via First Street. Map © Google.
Why this score? — see what drove the C grade
The composite is a weighted blend of 9 inputs, each scored 0–100. Each bar is that input's sub-score; the figure is the points it added to the 100-point composite (weight × sub-score).
- Cash flow +23.8/30.0
- DSCR +7.7/10.0
- ARV discount +7.5/15.0
- 1% rule +5.7/10.0
- Livability +4.0/5.0
- Schools +3.0/10.0
- Rent growth +2.7/5.0
- Condition / age +2.5/5.0
- Appreciation +0.0/10.0
$299,999
🖨 Deal sheet 📄 Offer letter ✓ Due diligence
Listing remarks
Bring your vision and make this property your own! This spacious 4-bedroom home is full of opportunity, located less than 2 miles from vibrant downtown Durham. Enjoy easy access to top dining, the renowned Durham Performing Arts Center, and the Durham Bulls Athletic Park, along with a variety of unique local attractions. Inside, you'll find a flexible floor plan featuring a first-floor office/den--perfect for remote work or additional living space. The standout feature is the above-grade walkout basement, offering incredible potential for expansion, a guest suite, or even a secondary rental opportunity. Recent updates include a new roof (2023), while outdoor living shines with double decks
Key facts
- 7,405 sq ft lot
- 2 parking spots
- Built 1932
Property features AI
Finance
- Other: Living area reported as 2,955 total (2,097 above grade, 858 below grade)
- HOA & community: No association
Exterior
- Parking: Driveway; 2 parking spaces
- Utilities: Public water; Public sewer
- Home design: Site-built home; Two levels; Fixer condition; R-3 zoning
- Construction: Brick, vinyl siding and wood siding exterior; Shingle roof; Other foundation; Built as site-built structure
- Exterior features: Enclosed deck
Interior
- Kitchen: Dishwasher; Gas range; Refrigerator
- Bedrooms: 4 bedrooms
- Flooring: Carpet; Hardwood; Tile; Vinyl
- Bathrooms: 1 full bathroom; 1 half bathroom
- Heating & cooling: Natural gas heating; Ceiling fans; Wall/window cooling units
- Interior features: Ceiling fans; Eat-in kitchen; Daylight, finished and unfinished basement
- Laundry & utility: Laundry area in kitchen
Neighborhood map
What this means for you Summary
Snapshot
- This is a 3-bed/1.5-bath single-family listed at $300k.
Deal economics
- At list price, monthly cash flow is $576 ($7k/yr) — positive.
- The deal already cash-flows at list — no discount required.
- Meets the 1% rule at list price ($3k rent vs $300k).
- Recommended offer: $291k (3.0% below list) — sets the bar for market timing.
- Cap rate 8.6% vs local median 3.0% in Durham — top-decile yield for the area; either an underpriced asset or a hidden risk that comps aren't pricing in. Stress-test before assuming the spread holds.
Location & tenants
- Location reads 81/100 on livability (#15 in NC, #1,411 nationally) — a professional / high-income tenant draw. Strengths: amenities A+, commute A+, housing A+; Watch: crime F.
- Durham Public Schools (urban): math 29% / reading 39% proficiency, ranked #132 of 178 in NC (top 74%) — families likely to look elsewhere, expect single-tenant / working-renter base with shorter leases.
- Zoned schools: Riverside High (math 49% / reading 42%, grade D-, #347 of 535 statewide, top 65%, 1,812 students, 51% FRL).
- Market conditions: Rents flat; 1103 active listings in the ZIP; 9 comparable units currently listed for rent nearby; rentals at typical pace (median 24d on market — plan ~3-4 weeks tenant-placement turnaround); solid renter incomes; 2,905 units permitted in Durham County in 2024 (955 in 5+ unit buildings).
- This rent runs 43% of the median local income ($89k/yr) — at the standard rent-burdened threshold; future hikes will face affordability resistance.
Forward outlook
- Local home prices are declining (-3.0%/yr); year-one equity from $2k of loan paydown is wiped out by about $9k of value loss. Plan a longer hold.
- Durham County population projected at +44% by 2050 — long-run rental-demand tailwind backs the buy-and-hold thesis.
Negotiation context
- It's been on market 55 days — a 3% lower offer ($291k) is reasonable based on typical stale-listing flexibility.
- 10 sale attempts since 27y ago with the ask held roughly flat each time — persistent listings suggest the price (not the market) is what's stuck; bring a comps-based counter.
- Current owner paid $86k; list at $300k implies a 249% gain — meaningful room to come down on a strong offer.
Risks & watch-outs
- Watch-outs: built in 1932 — expect roof / HVAC / electrical / plumbing capex.
- Climate carrying-cost: major wind risk, 27% chance of damaging wind over 30y; extreme-heat days projected 7→16/yr by 2055 (HVAC capex compounding) — expect insurance premiums to compound above CPI over the hold.
Questions for the listing agent
- It's been on market 55 days. Have you received any prior offers? Is the seller open to a 3% concession, seller financing, or rate buy-down credit?
- Built in 1932 — when were the roof, HVAC, electrical panel, plumbing, and water heater last replaced?
- Is there a deadline driving the sale (1031 exchange, divorce, estate, relocation)? That informs how much negotiation room exists.
- Schools are D-rated, which usually means shorter tenancies and higher turnover. Who's the typical renter profile here, and what's been the actual vacancy rate?
- Crime grade is F in this area — have there been break-ins, vandalism, or insurance claims at this property in the last 3 years? What carrier currently insures it and at what premium?
- What's the average days-on-market for RENTAL listings here right now (not sales)? A rising rental-DOM trend means longer vacancies and softer asking-rent achievability than the comps imply.
- What's the recent tenant-quality profile in this submarket — average credit score on applications, eviction rate, late-payment / NSF rate, and stable-employment percentage? A property-management company in the area should have these aggregated.
- How much new for-sale + rental construction is in the pipeline within 1–3 miles? Heavy new supply typically softens prices + rents 12–24 months out; constrained supply supports both.
Investment metrics
- 1% rule
- 1.07% ✓
- Cap rate
- 8.60%
- Cash-on-cash
- 8.23%
- DSCR
- 1.37
- GRM
- 7.8
CMA / ARV
- ARV (on-the-fly)
- $723,247
- Comps found
- 8
Show comp detail 8 sales within ~0.75 mi
| Address | Dist | Beds/Ba | Sqft | Sold | Price | $/sf | Match |
|---|---|---|---|---|---|---|---|
| 310 N Guthrie Ave | 0.36mi | 4/2.5 (+1) | 2,510 (-4%) | 1mo | $699,000 | $278 | 67 |
| 1006 Franklin St | 0.38mi | 3/3.5 | 2,356 (-10%) | 4mo | $663,000 | $281 | 54 |
| 303 N Guthrie Ave | 0.33mi | 4/3.5 (+1) | 2,436 (-7%) | 13mo | $675,000 | $277 | 50 |
| 1112 Fern St | 0.43mi | 4/3.0 (+1) | 2,546 (-2%) | 20mo | $560,000 | $220 | 48 |
| 2005 Angier Ave | 0.51mi | 4/3.0 (+1) | 2,520 (-4%) | 17mo | $649,000 | $258 | 45 |
| 205 S Briggs Ave | 0.58mi | 4/3.0 (+1) | 2,308 (-12%) | 2mo | $489,000 | $212 | 41 |
| 1210 Hanover St | 0.73mi | 4/3.5 (+1) | 2,601 (-0%) | 23mo | $919,000 | $353 | 33 |
| 1305 N Hyde Park | 0.64mi | 3/2.5 | 2,320 (-11%) | 21mo | $299,999 | $129 | 30 |
Match score weights: distance 35% · size 25% · config 20% · recency 20%. Top-matched comps best support the ARV.
Projected returns pro-forma
-3.0% appreciation · 0.84% rent growth · sell at horizon
- IRR
- -6.2%
- Equity multiple
- 0.78×
- Total profit
- $-18,768
- Equity at exit
- $44,731
- IRR
- 0.7%
- Equity multiple
- 1.05×
- Total profit
- $3,947
- Equity at exit
- $25,938
Cash invested: $84,000 (down + closing). Projections, not guarantees.
Landlord ↔ Tenant lean methodology
- Overall (STATE)
- 85 Strongly Landlord-Friendly
- State North Carolina
- 85 Strongly Landlord-Friendly · R+3
- County
- — inherits STATE
- City
- — inherits STATE
ZIP-level market 27703
- Rents YoY
- 0.8%
- Active inventory
- 1103
- Price-to-rent
- 7.8×
Monthly cashflow live
- Estimated rent
- $3,219 high interval (Pro) →
- Mortgage (P&I)
- −$1,573
- Tax from tax record
- −$269 /mo · $3,224/yr
- Insurance
- −$125
- HOA
- −$0
- Vacancy / Maint / Mgmt
- −$676
- Net cashflow
- $576
Break-even live
UW: 25.0% down · 7.5% · 30yr · 1.5% tax · 5.0% vac · 8.0% maint · 8.0% mgmt
Financing live
Cash to close
- Down payment
- $75,000
- Closing costs
- $9,000
- Reserves months
- —
- Total cash needed
- —
Loan-product check · same deal, 3 products live
Conventional
25% down · 7.5% · 30yr
- Down + closing
- —
- Monthly P&I
- —
- Monthly cashflow
- —
- DSCR
- —
- Eligible?
- —
Personal DTI + credit; lowest rate.
DSCR
20% down · 8.5% · 30yr
- Down + closing
- —
- Monthly P&I
- —
- Monthly cashflow
- —
- DSCR
- —
- Eligible?
- —
No personal income docs; deal must DSCR.
Hard money
10% down · 12.0% · 12mo
- Down + closing
- —
- Monthly P&I
- —
- Monthly cashflow
- —
- DSCR
- —
- Eligible?
- —
Short-term bridge; refi at stabilization.
Rent comps 9 comps
| Address | Beds | Baths | Sqft | Rent | $/sqft | DOM | Units | Dist |
|---|---|---|---|---|---|---|---|---|
| 104 N Hyde Park Ave Durham, NC | 3.0 | 2.5 | 1980 | $3,900 | $1.97 | 23d | 1 | 0.29mi |
| 114 N Guthrie Ave Durham, NC | 4.0 | 3.0 | 1877 | $2,450 | $1.31 | 23d | 1 | 0.40mi |
| 1602 Juniper St Unit B Durham, NC | 4.0 | 3.0 | 1754 | $2,800 | $1.60 | 23d | 1 | 0.76mi |
| 809 Drew St Durham, NC | 3.0 | 2.0 | 2192 | $3,000 | $1.37 | 23d | 1 | 0.80mi |
| 1006 Grant St Durham, NC | 4.0 | 4.0 | 2201 | $3,120 | $1.42 | 23d | 1 | 1.01mi |
| 1008 Grant St Durham, NC | 4.0 | 4.0 | 2201 | $3,120 | $1.42 | 23d | 1 | 1.02mi |
| 211 Hargrove St Unit 1300731P Durham, NC | 3.0 | 3.0 | 2131 | $5,298 | $2.49 | 14d | 1 | 1.29mi |
| 101b Morris St Durham, NC | 2.0 | 2.0 | 1958 | $4,500 | $2.30 | 23d | 1 | 1.32mi |
| 207 Dacian Ave Durham, NC | 4.0 | 3.5 | 2647 | $6,250 | $2.36 | 23d | 1 | 1.45mi |
Listing history 39 events
-
2026-06-18days on market $299,999 Active 55 DOM
-
2026-06-17days on market $299,999 Active 54 DOM
-
2026-06-16days on market $299,999 Active 53 DOM
-
2026-06-15days on market $299,999 Active 52 DOM
-
2026-06-14days on market $299,999 Active 50 DOM
-
2026-06-10days on market $299,999 Active 47 DOM
-
2026-06-09days on market $299,999 Active 46 DOM
-
2026-06-08days on market $299,999 Active 45 DOM
-
2026-06-07days on market $299,999 Active 44 DOM
-
2026-06-05days on market $299,999 Active 41 DOM
-
2026-06-03days on market $299,999 Active 40 DOM
-
2026-06-02days on market $299,999 Active 39 DOM
-
2026-06-01days on market $299,999 Active 38 DOM
-
2026-05-31days on market $299,999 Active 37 DOM
-
2026-05-30days on market $299,999 Active 36 DOM
-
2026-05-21status Active
-
2026-05-10historical Active Under Contract
-
2026-04-25$299,999 Active
-
2026-04-17historical $299,999
-
2025-05-29status Pending
-
2025-05-29historical
-
2025-03-26status Active
-
2025-02-12status Pending
-
2025-01-03price $299,999
-
2025-01-02status Active
-
2024-12-31historical
-
2024-10-16$329,999 Active
-
2024-09-16price $329,999
-
2024-07-09status Active
-
2024-06-17status Active
-
2024-06-07status Pending
-
2024-06-07historical
-
2024-06-07historical
-
2024-05-30$340,000 Active
-
1999-12-21soldstatus $86,000
-
1999-12-15soldstatus $85,000
-
1999-12-15soldstatus $85,000
-
1999-07-22$80,000
-
1999-07-22$80,000
ⓘ Source: listings_history table (triggers on properties + properties_extension) + one-shot
backfill from property_details.listing_events for pre-trigger history.
Tax reassessment forecast NC · Resets to sale price
- Current annual tax
- $3,224 · $269/mo
- Projected year-2 tax
- $3,224 · $269/mo
- Expected delta
- $0/yr ($0/mo · 0.0%)
ⓘ Screening estimate from a state-policy table — verify with the county assessor before closing.
Climate risk First Street
- Flood 1/10 Low FEMA zone X (unshaded) · 0% chance over 30 yrs
- Wildfire 1/10 Low
- Heat 6/10 Major 7 d/yr ≥106°F today · 16 d/yr by 30 yrs out
- Wind 6/10 Major 27% chance of damaging wind over 30 yrs
- Air quality 2/10 Low 1 unhealthy d/yr today · 1 by 30 yrs out
Nearby sold comps map
Loading sold comps map…
Walkable amenities ~0.75 mi
Loading nearby amenities…
Taxation est. · year 1
- Rental income
- $38,632
- − Mortgage interest
- −$16,805
- − Property taxes
- −$3,224
- − Insurance
- −$1,500
- − Repairs & maintenance
- −$3,091
- − Management
- −$3,091
- − Depreciation
- −$8,727
- Taxable income
- $2,195
- Est. tax owed @ 24.0%
- −$527
- After-tax cash flow
- $6,390/yr
For passive investors: Depreciation is non-cash, so a rental often shows a tax loss while cash-flowing — sheltering income. Rental losses are passive: they offset passive income freely, and up to $25,000/yr can offset ordinary (W-2) income if you actively participate and your MAGI is under $100k (phasing out to $0 by $150k); unused losses carry forward. On sale, claimed depreciation is recaptured at up to 25%, and gains may owe capital-gains tax (a 1031 exchange can defer both). Figures are a year-1 estimate at your 24.0% rate — not tax advice; consult a CPA.
Schools (NCES district)
- District
- Durham Public Schools
- NCES district ID
- 3701260
- Math proficiency
- 29% ▼ -3.00%
- Reading proficiency
- 39% ▲ 2.00%
- Median HH income
- $52,143
- Composite
- 29.69/100
- National rank
- #6457
- State rank
- #132 of 178 in NC
Livability — Durham
- Score
- 81/100
- State rank
- #15
- US rank
- #1411
Category grades
Schools grade is shown separately in the Schools card above.
Census & demographics
- Census place
- Durham, NC
- County
- Durham County · 288,747 people
- City population
- 288,747
- Metro
- Durham-Chapel Hill, NC
- Population (ZIP)
- 63,458
- Household income
- $89,317
- Rent vs Own
- Severe rent burden
- 1685.0
Population outlook (Durham County) Hauer SSP2
- Today (2025)
- 368,962 people
- By 2030
- 402,686 · +9.1%
- By 2040
- 468,677 · +27.0%
- By 2050
- 531,727 · +44.1%
- By 2075
- 660,446 · +79.0%
- By 2100
- 739,971 · +100.6%
Race, ethnicity, and origin ACS 2023
- Neighborhood character
- Diverse neighborhood (Simpson 0.70)
- Race & ethnicity
- Black 40% White 32% Hispanic / Latino 20% Two or more races 9% Asian 5%
- Hispanic origin (detail)
- Mexican 11% Puerto Rican 1%
- Common ancestry
- Swiss 2% Romanian 2% Italian 1%
- Foreign-born
- 15% · Canada, Vietnam, China
- Languages at home
- 77% English-only · Spanish 17% Other Asian/Pacific 1% Other Indo-European 1%
Political lean MEDSL · Durham
- 2024 margin
- Solid D (+61.9) · D 80.2% · R 18.2% · Other 1.6%
- 2008→2024 swing
- +10.0pp toward D · 2008: 51.9pp · 2024: 61.9pp
- All cycles
- 2024: D+61.9 2020: D+62.4 2016: D+60.4 2012: D+52.7 2008: D+51.9
Not yet ingested
- Civics
- —
Market trends
- HPI YoY
- ▼ -129.81%
- Current HPI
- 206.7413
- Rent YoY
- ▲ 0.84%
- Metro
- Durham-Chapel Hill, NC
- State GDP YoY
- ▲ 3.28%
- F500 in state
- 26
Industry mix (Fortune 500 HQ in NC)
| Industry | F500 HQs | Revenue |
|---|---|---|
| Financial Services | 2 | $213B |
|
||
| Retail | 2 | $95B |
|
||
| Industrial Conglomerate | 1 | $38B |
|
||
| Metals / Steel | 1 | $35B |
|
||
| Utilities | 1 | $30B |
|
||
| Industrial Machinery | 1 | $19B |
|
||
Price history
+275.0% since first listed24 events — show timeline
- 2026-05-21 Relisted — TMLS
- 2026-05-10 Contingent — TMLS
- 2026-04-25 Listed $299,999 TMLS
- 2026-04-17 Coming Soon $299,999 TMLS
- 2025-05-29 Pending — TMLS
- 2025-05-29 Listing Removed — TMLS
- 2025-03-26 Relisted — TMLS
- 2025-02-12 Pending — TMLS
- 2025-01-03 Price Changed $299,999 TMLS
- 2025-01-02 Relisted — TMLS
- 2024-12-31 Listing Removed — TMLS
- 2024-10-16 Listed $329,999 TMLS
- 2024-09-16 Price Changed $329,999 TMLS
- 2024-07-09 Relisted — TMLS
- 2024-06-17 Relisted — TMLS
- 2024-06-07 Pending — TMLS
- 2024-06-07 Listing Removed — TMLS
- 2024-06-07 Listing Removed — TMLS
- 2024-05-30 Listed $340,000 TMLS
- 1999-12-21 Sold (Public Records) $86,000 Public Records
- 1999-12-15 Sold (MLS) $85,000 AMLSNC
- 1999-12-15 Sold (MLS) $85,000 TMLS
- 1999-07-22 Listed $80,000 AMLSNC
- 1999-07-22 Listed $80,000 TMLS
Property tax history
+5.2%/yrLatest (2025): $3,224 · +49.6% YoY. Source: county tax records.
Cash-flow waterfall
monthlySold comps — $/sqft
last 12 mo · ≤1 miLoading sold comps…