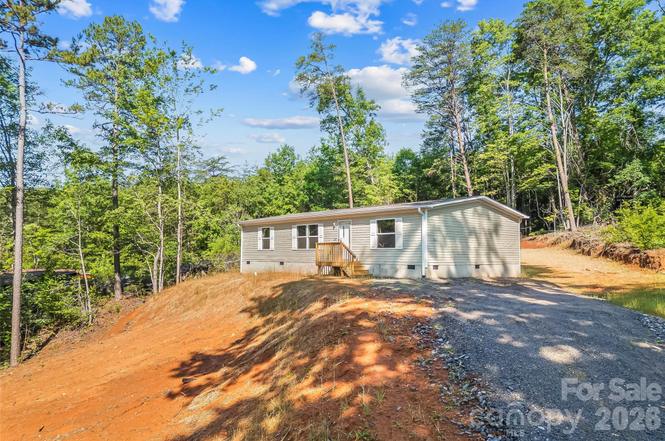
257 Brookwood Dr · Marion, NC
Flood risk 5/10 · Moderate
- FEMA flood zone
- X (unshaded)
- Chance of flooding over 30 yrs
- 0.53%
- Est. flood insurance / yr
- $507 – $1,088
Fire risk 3/10 · Minor
- Est. fire insurance / yr
- $906 – $1,684
Heat risk 5/10 · Moderate
- Hot days now (above 102°F)
- 7 days/yr
- Hot days in 30 yrs
- 19 days/yr
Wind risk 2/10 · Minimal
- Chance of severe wind over 30 yrs
- —
Air-quality risk 3/10 · Minor
- Unhealthy air days now
- 3 days/yr
- Unhealthy air days in 30 yrs
- 4 days/yr
Risk factors via First Street. Map © Google.
Why this score? — see what drove the C- grade
The composite is a weighted blend of 9 inputs, each scored 0–100. Each bar is that input's sub-score; the figure is the points it added to the 100-point composite (weight × sub-score).
- Cash flow +17.6/30.0
- ARV discount +10.1/15.0
- DSCR +5.5/10.0
- 1% rule +4.8/10.0
- Condition / age +4.0/5.0
- Livability +3.6/5.0
- Schools +3.4/10.0
- Rent growth +2.5/5.0
- Appreciation +0.0/10.0
$200,000
🖨 Deal sheet (PDF) 📄 Offer letter ✓ Due diligence
Listing remarks
Brand-new 2026 manufactured home on approximately 0.49 acres in Marion! This move-in ready 3-bedroom, 2-bath home features an open floor plan, spacious kitchen, split-bedroom layout, and modern finishes throughout. Enjoy the peace of country living while being just minutes from downtown Marion, shopping, dining, and convenient access to I-40 for an easy commute to Morganton, Hickory, or Asheville. Don't miss this opportunity to own a never-occupied home without the wait of new construction!
Key facts
- Open floor plan
- Split-bedroom layout
- Spacious kitchen
Tags
Property features AI
Finance
- HOA & community: No HOA
Exterior
- Parking: Driveway
- Utilities: City water; Septic system installed
- Home design: Single family residence (manufactured); One story; Completed development; R-1 zoning
- Construction: Manufactured construction; Shingle/Shake and vinyl exterior with other materials noted; Crawl space foundation; New construction
- Exterior features: Lot approximately 0.49 acres; Concrete, gravel, and paved road access
Interior
- Kitchen: Convection oven, Electric oven, Electric range, Dishwasher
- Bedrooms: 3 bedrooms on the main level
- Bathrooms: 2 full bathrooms on the main level
- Heating & cooling: Central heating; Central air
- Interior features: Central heating; Central air conditioning; Convection oven, Dishwasher, Electric oven, Electric range
- Laundry & utility: Mud room laundry area
Neighborhood map
What this means for you Summary
Snapshot
- This is a 3-bed/2.0-bath single-family listed at $200k. Condition is rated good.
Deal economics
- At list price, monthly cash flow is $158 ($2k/yr) — positive.
- The deal already cash-flows at list — no discount required.
- To meet the 1% rule (rent ≥ 1% of price), the offer needs to be $195k (2.5% below list).
- Recommended offer: $195k (2.5% below list) — sets the bar for 1% rule.
- Cap rate 7.2% vs local median 3.3% in Marion — top-decile yield for the area; either an underpriced asset or a hidden risk that comps aren't pricing in. Stress-test before assuming the spread holds.
Location & tenants
- Location reads 72/100 on livability (#93 in NC) — a middle-class / working-renter tenant base. Strengths: cost of living A+, housing A+, health & safety A+; Watch: crime D+, amenities F, commute F.
- Mcdowell County Schools (rural): math 35% / reading 46% proficiency, ranked #115 of 178 in NC (top 65%) — families likely to look elsewhere, expect single-tenant / working-renter base with shorter leases.
- Zoned schools: Eastfield Global Magnet School (math 37% / reading 37%, grade F, #771 of 1,410 statewide, top 57%, 266 students, 84% FRL); East Mcdowell Middle School (math 27% / reading 40%, grade F, #299 of 475 statewide, top 64%, 468 students, 78% FRL); Mcdowell High School (math 50% / reading 57%, grade C-, #279 of 535 statewide, top 52%, 1,416 students, 60% FRL) — zoned schools average 74% FRL vs 58% district-wide (16 pts higher); higher-poverty schools than district average — tighter screening recommended.
- Market conditions: 266 active listings in the ZIP; 1 comparable units currently listed for rent nearby; 175 units permitted in McDowell County in 2024 (0 in 5+ unit buildings).
Forward outlook
- Local home prices are declining (-3.0%/yr); year-one equity from $1k of loan paydown is wiped out by about $6k of value loss. Plan a longer hold.
- McDowell County population projected at -11% by 2050 — secular population decline; favor cash flow + early exit over multi-decade hold.
Negotiation context
- Only 8 days on market — expect competitive offers; lowballing is unlikely to land.
Risks & watch-outs
- Climate carrying-cost: moderate flood risk; extreme-heat days projected 7→19/yr by 2055 (HVAC capex compounding) — expect insurance premiums to compound above CPI over the hold.
Questions for the listing agent
- Is there a deadline driving the sale (1031 exchange, divorce, estate, relocation)? That informs how much negotiation room exists.
- Schools are D-rated, which usually means shorter tenancies and higher turnover. Who's the typical renter profile here, and what's been the actual vacancy rate?
- Crime grade is D in this area — have there been break-ins, vandalism, or insurance claims at this property in the last 3 years? What carrier currently insures it and at what premium?
- What's the average days-on-market for RENTAL listings here right now (not sales)? A rising rental-DOM trend means longer vacancies and softer asking-rent achievability than the comps imply.
- What's the recent tenant-quality profile in this submarket — average credit score on applications, eviction rate, late-payment / NSF rate, and stable-employment percentage? A property-management company in the area should have these aggregated.
- How much new for-sale + rental construction is in the pipeline within 1–3 miles? Heavy new supply typically softens prices + rents 12–24 months out; constrained supply supports both.
Investment metrics
- 1% rule
- 0.97% ✗
- Cap rate
- 7.24%
- Cash-on-cash
- 3.39%
- DSCR
- 1.15
- GRM
- 8.5
CMA / ARV
- ARV (on-the-fly)
- $212,352
- Comps found
- 5
Show comp detail 5 sales within ~0.75 mi
| Address | Dist | Beds/Ba | Sqft | Sold | Price | $/sf | Match |
|---|---|---|---|---|---|---|---|
| 70 3rd St #87 | 0.63mi | 3/1.0 | 1,158 (-8%) | 5mo | $195,000 | $168 | 48 |
| 35 Haven Ridge Ln S | 0.38mi | 3/2.0 | 1,440 (+14%) | 17mo | $360,000 | $250 | 45 |
| 86 Ridge St | 0.44mi | 2/1.5 (-1) | 1,174 (-7%) | 21mo | $168,000 | $143 | 43 |
| 2305 Rutherford Rd | 0.72mi | 3/1.0 | 1,104 (-13%) | 2mo | $244,000 | $221 | 39 |
| 94 Fifth Em St | 0.71mi | 2/1.0 (-1) | 1,322 (+5%) | 21mo | $212,000 | $160 | 32 |
Match score weights: distance 35% · size 25% · config 20% · recency 20%. Top-matched comps best support the ARV.
Projected returns pro-forma
-3.0% appreciation · 3.0% rent growth · sell at horizon
- IRR
- -10.9%
- Equity multiple
- 0.60×
- Total profit
- $-22,294
- Equity at exit
- $29,821
- IRR
- -1.6%
- Equity multiple
- 0.89×
- Total profit
- $-6,308
- Equity at exit
- $17,292
Cash invested: $56,000 (down + closing). Projections, not guarantees.
Landlord ↔ Tenant lean methodology
- Overall (STATE)
- 85 Strongly Landlord-Friendly
- State North Carolina
- 85 Strongly Landlord-Friendly · R+3
- County
- — inherits STATE
- City
- — inherits STATE
ZIP-level market 28752
- Active inventory
- 266
- Price-to-rent
- 8.5×
Monthly cashflow live
- Estimated rent
- $1,950 medium interval (Pro) →
- Mortgage (P&I)
- −$1,049
- Tax est. 1.5%
- −$250 /mo · $3,000/yr
- Insurance
- −$83
- HOA
- −$0
- Vacancy / Maint / Mgmt
- −$410
- Net cashflow
- $158
Break-even live
Sensitivity live
| Price | -10% $297 | -5% $227 | +0% $158 | +5% $89 | +10% $20 |
|---|---|---|---|---|---|
| Rent | -10% $4 | -5% $81 | +0% $158 | +5% $235 | +10% $312 |
| Rate | -1.0pp $259 | -0.5pp $209 | base $158 | +0.5pp $107 | +1.0pp $54 |
UW: 25.0% down · 7.5% · 30yr · 1.5% tax · 5.0% vac · 8.0% maint · 8.0% mgmt
Financing live
Cash to close
- Down payment
- $50,000
- Closing costs
- $6,000
- Reserves months
- —
- Total cash needed
- —
Loan-product check · same deal, 3 products live
Conventional
25% down · 7.5% · 30yr
- Down + closing
- —
- Monthly P&I
- —
- Monthly cashflow
- —
- DSCR
- —
- Eligible?
- —
Personal DTI + credit; lowest rate.
DSCR
20% down · 8.5% · 30yr
- Down + closing
- —
- Monthly P&I
- —
- Monthly cashflow
- —
- DSCR
- —
- Eligible?
- —
No personal income docs; deal must DSCR.
Hard money
10% down · 12.0% · 12mo
- Down + closing
- —
- Monthly P&I
- —
- Monthly cashflow
- —
- DSCR
- —
- Eligible?
- —
Short-term bridge; refi at stabilization.
Rent comps 1 comps
| Address | Beds | Baths | Sqft | Rent | $/sqft | DOM | Units | Dist |
|---|---|---|---|---|---|---|---|---|
| 555 Baldwin Ave Marion, NC | 3.0 | 2.0 | 1194 | $1,950 | $1.63 | 22d | 1 | 0.82mi |
Listing history 8 events
-
2026-06-19days on market $200,000 Active 8 DOM
-
2026-06-18days on market $200,000 Active 7 DOM
-
2026-06-17days on market $200,000 Active 6 DOM
-
2026-06-16days on market $200,000 Active 5 DOM
-
2026-06-15days on market $200,000 Active 4 DOM
-
2026-06-14days on market $200,000 Active 2 DOM
-
2026-06-13remarks 495-char remark
-
2026-06-13$200,000 Active 1 DOM
ⓘ Source: listings_history table (triggers on properties + properties_extension) + one-shot
backfill from property_details.listing_events for pre-trigger history.
Climate risk First Street
- Flood 5/10 Major FEMA zone X (unshaded) · 53% chance over 30 yrs
- Wildfire 3/10 Moderate
- Heat 5/10 Major 7 d/yr ≥102°F today · 19 d/yr by 30 yrs out
- Wind 2/10 Low
- Air quality 3/10 Moderate 3 unhealthy d/yr today · 4 by 30 yrs out
Nearby sold comps map
Loading sold comps map…
Walkable amenities ~0.75 mi
Loading nearby amenities…
Taxation est. · year 1
- Rental income
- $23,400
- − Mortgage interest
- −$11,203
- − Property taxes
- −$3,000
- − Insurance
- −$1,000
- − Repairs & maintenance
- −$1,872
- − Management
- −$1,872
- − Depreciation
- −$5,818
- Taxable loss
- −$1,365
- Est. tax savings @ 24.0%
- +$328
- After-tax cash flow
- $2,228/yr
For passive investors: Depreciation is non-cash, so a rental often shows a tax loss while cash-flowing — sheltering income. Rental losses are passive: they offset passive income freely, and up to $25,000/yr can offset ordinary (W-2) income if you actively participate and your MAGI is under $100k (phasing out to $0 by $150k); unused losses carry forward. On sale, claimed depreciation is recaptured at up to 25%, and gains may owe capital-gains tax (a 1031 exchange can defer both). Figures are a year-1 estimate at your 24.0% rate — not tax advice; consult a CPA.
Condition & rehab AI · 14 photos
This move-in ready 2026 manufactured home is in good condition with modern finishes and an open floor plan. It offers a good investment opportunity with minimal repairs needed and potential for value increase through painting and landscaping.
Value-add opportunities
- Resale Painting the exterior siding — Fresh paint can enhance the curb appeal and make the home look more inviting to potential buyers.
- Both Landscaping the front yard — A well-maintained front yard can improve both the resale and rental value of the property.
Renovation cost estimate screening
Value-add ROI direction
- Resale Painting the exterior siding — Fresh paint can enhance the curb appeal and make the home look more inviting to potential buyers. ↑
- Both Landscaping the front yard — A well-maintained front yard can improve both the resale and rental value of the property. ↑
ⓘ Cost ranges are severity-bucket heuristics (US national rule-of-thumb). Get contractor quotes + a written scope before underwriting a rehab budget.
Schools (NCES district)
- District
- Mcdowell County Schools
- NCES district ID
- 3702940
- Math proficiency
- 35% ▼ -3.00%
- Reading proficiency
- 46% ▬ 0.00%
- Median HH income
- $36,769
- Composite
- 33.6/100
- National rank
- #5413
- State rank
- #115 of 178 in NC
Livability — Marion
- Score
- 72/100
- State rank
- #93
- US rank
- #6157
Category grades
Schools grade is shown separately in the Schools card above.
Census & demographics
- Census place
- Marion, NC
- City population
- 30,602
- Population (ZIP)
- 30,602
Population outlook (McDowell County) Hauer SSP2
- Today (2025)
- 44,615 people
- By 2030
- 44,002 · -1.4%
- By 2040
- 42,285 · -5.2%
- By 2050
- 39,906 · -10.6%
- By 2075
- 34,396 · -22.9%
- By 2100
- 27,970 · -37.3%
Race, ethnicity, and origin ACS 2023
- Neighborhood character
- Predominantly White (83%)
- Race & ethnicity
- White 83% Hispanic / Latino 9% Two or more races 5% Black 5% Asian 2%
- Hispanic origin (detail)
- Mexican 6%
- Common ancestry
- Serbian 4% Slovak 2% Iranian 1%
- Foreign-born
- 5% · Canada, Vietnam
- Languages at home
- 90% English-only · Spanish 8% German/W. Germanic 1% Vietnamese 1%
Political lean MEDSL · McDowell
- 2024 margin
- Solid R (+49.2) · D 25.1% · R 74.2%
- 2008→2024 swing
- -22.2pp toward R · 2008: -27.0pp · 2024: -49.2pp
- All cycles
- 2024: R+49.2 2020: R+48.0 2016: R+50.5 2012: R+31.9 2008: R+27.0
Not yet ingested
- Civics
- —
Market trends
- HPI YoY
- ▼ -108.41%
- Current HPI
- 182.9225
- Rent YoY
- —
- Metro
- —
- State GDP YoY
- ▲ 3.28%
- F500 in state
- 26
Industry mix (Fortune 500 HQ in NC)
| Industry | F500 HQs | Revenue |
|---|---|---|
| Financial Services | 2 | $213B |
|
||
| Retail | 2 | $95B |
|
||
| Industrial Conglomerate | 1 | $38B |
|
||
| Metals / Steel | 1 | $35B |
|
||
| Utilities | 1 | $30B |
|
||
| Industrial Machinery | 1 | $19B |
|
||
Price history
+0.0% since first listed2 events — show timeline
- 2026-06-12 Listed $200,000 CANOPYMLS as Distributed by MLS Grid
- 2026-06-10 Coming Soon $200,000 CANOPYMLS as Distributed by MLS Grid
Cash-flow waterfall
monthlySold comps — $/sqft
last 12 mo · ≤1 miLoading sold comps…