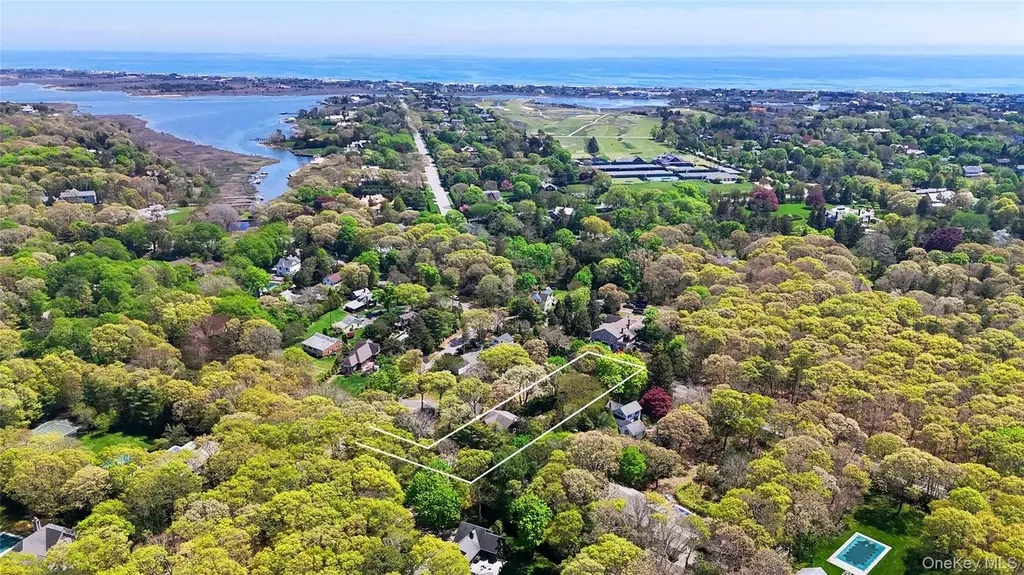
39 Foster Rd Unit A · Quogue, NY
Flood risk 1/10 · Minimal
- FEMA flood zone
- X (unshaded)
- Chance of flooding over 30 yrs
- 0.0%
- Est. flood insurance / yr
- $507 – $1,088
Fire risk 1/10 · Minimal
- Est. fire insurance / yr
- $691 – $1,283
Heat risk 4/10 · Minor
- Hot days now (above 90°F)
- 7 days/yr
- Hot days in 30 yrs
- 20 days/yr
Wind risk 8/10 · Major
- Chance of severe wind over 30 yrs
- 80.0%
Air-quality risk 2/10 · Minimal
- Unhealthy air days now
- 2 days/yr
- Unhealthy air days in 30 yrs
- 2 days/yr
Risk factors via First Street. Map © Google.
Why this score? — see what drove the A- grade
The composite is a weighted blend of 9 inputs, each scored 0–100. Each bar is that input's sub-score; the figure is the points it added to the 100-point composite (weight × sub-score).
- Cash flow +29.6/30.0
- ARV discount +15.0/15.0
- DSCR +10.0/10.0
- 1% rule +8.3/10.0
- Appreciation +7.0/10.0
- Schools +6.6/10.0
- Livability +3.4/5.0
- Rent growth +2.5/5.0
- Condition / age +2.5/5.0
$1,595,000
🖨 Deal sheet 📄 Offer letter ✓ Due diligence
Listing remarks
Located in the Hamptons' coveted Quogue Village! This stunning 4-bedroom 4-full bath home, complete with a 1st floor guest en-suite and elevator, blends coastal charm with modern luxury. Take the stairs or elevator upstairs (or to any floor) you will find the primary en-suite and a well-designed shared bathroom connects the additional upstairs 2 bedrooms. The finished basement is designed for entertainment and relaxation, featuring a versatile game room and theater space for unforgettable movie nights and billiards tournaments. An en-suite bonus room and a well-appointed laundry room complete this level, offering both convenience and additional living space. Dive into endless fun in the exp
Key facts
- Elevator
- Finished basement
- En-suite bonus room
Tags
Property features AI
Finance
- Other: Tax year 2025
- HOA & community: Additional annual fees: $3,979 (taxes)
Exterior
- Parking: No carport; No designated parking features listed
- Utilities: Septic tank; Electricity connected; Propane
- Home design: Single family residence; Living area reported from public records
- Construction: Frame construction
- Exterior features: Frame construction; Not waterfront
Interior
- Kitchen: Cooktop; Gas oven; Gas range; Microwave; Dishwasher; Refrigerator; Stainless steel appliances
- Bedrooms: Includes a bedroom on the first floor
- Flooring: Wood flooring
- Bathrooms: 4 full bathrooms
- Heating & cooling: Forced air heating (propane); Central air conditioning
- Interior features: First-floor bedroom; Elevator; Finished full basement (see remarks); Crawl attic
- Laundry & utility: Washer; Dryer
Neighborhood map
What this means for you Summary
Snapshot
- This is a 4-bed/2.0-bath single-family listed at $1.59M.
Deal economics
- At list price, monthly cash flow is $6k ($69k/yr) — positive.
- The deal already cash-flows at list — no discount required.
- Meets the 1% rule at list price ($21k rent vs $1.59M).
- Recommended offer: $1.55M (3.0% below list) — sets the bar for market timing.
Location & tenants
- Location reads 67/100 on livability (#600 in NY) — a middle-class / working-renter tenant base. Strengths: crime A+, employment A+, health & safety B+; Watch: amenities F, commute F, cost of living F.
- Quogue Union Free School District (suburban): math 70% / reading 80% proficiency, ranked #125 of 755 in NY (top 17%) — strong family-tenant draw, lease renewals of 3-5y typical; only 4% free/reduced lunch — higher-income household profile.
- Zoned schools: Quogue Elementary School (math 87% / reading 92%, grade A+, #45 of 2,108 statewide, top 3%, 84 students, 0% FRL) — zoned schools at 0% FRL track the district average.
- Zoned-school proficiency averages 90% at this address vs 75% district-wide (+14 pts) — the actual schools serving this property are materially stronger than the Quogue Union Free School District average implies; a family-tenant draw the district grade alone would hide.
- Market conditions: 37 active listings in the ZIP; 6 comparable units currently listed for rent nearby; rentals at typical pace (median 25d on market — plan ~3-4 weeks tenant-placement turnaround); 1,366 units permitted in Suffolk County in 2024 (216 in 5+ unit buildings).
Forward outlook
- In year one you build about $75k of equity ($11k loan paydown + $64k appreciation (4.0% local appreciation)).
- Suffolk County population projected to shrink 5% by 2050 — rents likely to lag national; underwrite the cash flow, not the appreciation.
- At projected returns (4.0% appreciation + 3.0% rent growth), your $447k cash investment doubles in ~3 years — after that, you're playing with house money.
- By year 2, paydown + projected appreciation supports a ~$121k cash-out refi (75% LTV) — recoverable capital for the next deal without selling this one.
Negotiation context
- It's been on market 45 days — a 3% lower offer ($1.55M) is reasonable based on typical stale-listing flexibility.
- Current owner paid $1.03M; list at $1.59M implies a 54% gain — meaningful room to come down on a strong offer.
Risks & watch-outs
- Climate carrying-cost: severe wind risk, 80% chance of damaging wind over 30y — expect insurance premiums to compound above CPI over the hold.
Questions for the listing agent
- It's been on market 45 days. Have you received any prior offers? Is the seller open to a 3% concession, seller financing, or rate buy-down credit?
- Is there a deadline driving the sale (1031 exchange, divorce, estate, relocation)? That informs how much negotiation room exists.
- Schools are A-rated — typically a magnet for longer-tenancy family renters. What's the average tenant stay here, and is there a school-zone premium baked into asking?
- What's the average days-on-market for RENTAL listings here right now (not sales)? A rising rental-DOM trend means longer vacancies and softer asking-rent achievability than the comps imply.
- What's the recent tenant-quality profile in this submarket — average credit score on applications, eviction rate, late-payment / NSF rate, and stable-employment percentage? A property-management company in the area should have these aggregated.
- How much new for-sale + rental construction is in the pipeline within 1–3 miles? Heavy new supply typically softens prices + rents 12–24 months out; constrained supply supports both.
Investment metrics
- 1% rule
- 1.33% ✓
- Cap rate
- 10.62%
- Cash-on-cash
- 15.45%
- DSCR
- 1.69
- GRM
- 6.3
CMA / ARV
- ARV (median comp)
- $2,401,256
- List price
- $1,595,000
- Delta
- -33.58%
- Verdict
- UNDERPRICED
- Comps
- 11 within 1.0 mi
Show comp detail 3 sales within ~0.75 mi
| Address | Dist | Beds/Ba | Sqft | Sold | Price | $/sf | Match |
|---|---|---|---|---|---|---|---|
| 58 Old Depot | 0.27mi | 3/2.5 (-1) | 2,156 (+8%) | 3mo | $1,325,000 | $615 | 65 |
| 7 Shinnecock Rd | 0.32mi | 4/3.0 | 2,117 (+6%) | 16mo | $5,750,000 | $2,716 | 57 |
| 20 Foster Rd | 0.28mi | 3/3.0 (-1) | 2,241 (+12%) | 17mo | $1,725,000 | $770 | 43 |
Match score weights: distance 35% · size 25% · config 20% · recency 20%. Top-matched comps best support the ARV.
Projected returns pro-forma
4.01% appreciation · 3.0% rent growth · sell at horizon
- IRR
- 24.2%
- Equity multiple
- 2.45×
- Total profit
- $645,908
- Equity at exit
- $809,867
- IRR
- 24.2%
- Equity multiple
- 4.77×
- Total profit
- $1,683,584
- Equity at exit
- $1,325,544
Cash invested: $446,600 (down + closing). Projections, not guarantees.
Landlord ↔ Tenant lean methodology
- Overall (STATE)
- 15 Strongly Tenant-Friendly
- State New York
- 15 Strongly Tenant-Friendly · D+10
- County
- — inherits STATE
- City
- — inherits STATE
ZIP-level market 11959
- Home prices YoY
- 1.1%
- Active inventory
- 37
- Price-to-rent
- 6.3×
Monthly cashflow live
- Estimated rent
- $21,233 high interval (Pro) →
- Mortgage (P&I)
- −$8,364
- Tax est. 1.5%
- −$1,994 /mo · $23,925/yr
- Insurance
- −$665
- HOA
- −$0
- Vacancy / Maint / Mgmt
- −$4,459
- Net cashflow
- $5,752
Break-even live
UW: 25.0% down · 7.5% · 30yr · 1.5% tax · 5.0% vac · 8.0% maint · 8.0% mgmt
Financing live
Cash to close
- Down payment
- $398,750
- Closing costs
- $47,850
- Reserves months
- —
- Total cash needed
- —
Loan-product check · same deal, 3 products live
Conventional
25% down · 7.5% · 30yr
- Down + closing
- —
- Monthly P&I
- —
- Monthly cashflow
- —
- DSCR
- —
- Eligible?
- —
Personal DTI + credit; lowest rate.
DSCR
20% down · 8.5% · 30yr
- Down + closing
- —
- Monthly P&I
- —
- Monthly cashflow
- —
- DSCR
- —
- Eligible?
- —
No personal income docs; deal must DSCR.
Hard money
10% down · 12.0% · 12mo
- Down + closing
- —
- Monthly P&I
- —
- Monthly cashflow
- —
- DSCR
- —
- Eligible?
- —
Short-term bridge; refi at stabilization.
Rent comps 6 comps
| Address | Beds | Baths | Sqft | Rent | $/sqft | DOM | Units | Dist |
|---|---|---|---|---|---|---|---|---|
| 24 Quogue Riverhead Rd Quogue, NY | 3.0 | 3.0 | 2054 | $15,000 | $7.30 | 24d | 1 | 0.89mi |
| 14 Park Cir Quogue, NY | 3.0 | 2.0 | 1300 | $20,000 | $15.38 | 24d | 1 | 1.02mi |
| 718 Montauk Hwy East Quogue, NY | 5.0 | 2.0 | 2500 | $25,000 | $10.00 | 24d | 1 | 1.25mi |
| 2941 Quogue Riverhead Rd East Quogue, NY | 3.0 | 2.5 | 2044 | $80,000 | $39.14 | 24d | 1 | 1.33mi |
| 22 W End Ave East Quogue, NY | 3.0 | 2.0 | 1368 | $16,000 | $11.70 | 5d | 1 | 1.38mi |
| 20 Dune Ln Westhampton Beach, NY | 4.0 | 3.0 | 2500 | $35,000 | $14.00 | 24d | 1 | 1.41mi |
Listing history 19 events
-
2026-06-18days on market $1,595,000 Active 45 DOM
-
2026-06-17days on market $1,595,000 Active 44 DOM
-
2026-06-16days on market $1,595,000 Active 43 DOM
-
2026-06-15days on market $1,595,000 Active 42 DOM
-
2026-06-13days on market $1,595,000 Active 40 DOM
-
2026-06-13days on market $1,595,000 Active 39 DOM
-
2026-06-09days on market $1,595,000 Active 36 DOM
-
2026-06-08days on market $1,595,000 Active 35 DOM
-
2026-06-07days on market $1,595,000 Active 34 DOM
-
2026-06-04days on market $1,595,000 Active 31 DOM
-
2026-06-03days on market $1,595,000 Active 30 DOM
-
2026-06-02days on market $1,595,000 Active 29 DOM
-
2026-06-01days on market $1,595,000 Active 28 DOM
-
2026-05-31days on market $1,595,000 Active 27 DOM
-
2026-04-29$1,595,000 Active 773-char remark
-
2021-07-02soldstatus $1,035,000
-
2018-07-06soldstatus $960,000
-
2007-10-09soldstatus $999,000
-
2004-02-03soldstatus $300,000
ⓘ Source: listings_history table (triggers on properties + properties_extension) + one-shot
backfill from property_details.listing_events for pre-trigger history.
Climate risk First Street
- Flood 1/10 Low FEMA zone X (unshaded) · 0% chance over 30 yrs
- Wildfire 1/10 Low
- Heat 4/10 Moderate 7 d/yr ≥90°F today · 20 d/yr by 30 yrs out
- Wind 8/10 Severe 80% chance of damaging wind over 30 yrs
- Air quality 2/10 Low 2 unhealthy d/yr today · 2 by 30 yrs out
Nearby sold comps map
Loading sold comps map…
Walkable amenities ~0.75 mi
Loading nearby amenities…
Taxation est. · year 1
- Rental income
- $254,799
- − Mortgage interest
- −$89,345
- − Property taxes
- −$23,925
- − Insurance
- −$7,975
- − Repairs & maintenance
- −$20,384
- − Management
- −$20,384
- − Depreciation
- −$46,400
- Taxable income
- $46,387
- Est. tax owed @ 24.0%
- −$11,133
- After-tax cash flow
- $57,886/yr
For passive investors: Depreciation is non-cash, so a rental often shows a tax loss while cash-flowing — sheltering income. Rental losses are passive: they offset passive income freely, and up to $25,000/yr can offset ordinary (W-2) income if you actively participate and your MAGI is under $100k (phasing out to $0 by $150k); unused losses carry forward. On sale, claimed depreciation is recaptured at up to 25%, and gains may owe capital-gains tax (a 1031 exchange can defer both). Figures are a year-1 estimate at your 24.0% rate — not tax advice; consult a CPA.
Schools (NCES district)
- District
- Quogue Union Free School District
- NCES district ID
- 3624060
- Math proficiency
- 70% ▼ -10.00%
- Reading proficiency
- 80% ▬ 0.00%
- Median HH income
- $66,746
- Composite
- 66.09/100
- National rank
- #960
- State rank
- #125 of 755 in NY
Livability — Quogue
- Score
- 67/100
- State rank
- #600
- US rank
- #10895
Category grades
Schools grade is shown separately in the Schools card above.
Census & demographics
- Census place
- Quogue, NY
- City population
- 576
- Population (ZIP)
- 576
Population outlook (Suffolk County) Hauer SSP2
- Today (2025)
- 1,505,262 people
- By 2030
- 1,498,318 · -0.5%
- By 2040
- 1,471,101 · -2.3%
- By 2050
- 1,424,848 · -5.3%
- By 2075
- 1,337,157 · -11.2%
- By 2100
- 1,217,720 · -19.1%
Race, ethnicity, and origin ACS 2023
- Neighborhood character
- Predominantly White (71%)
- Race & ethnicity
- White 71% Two or more races 23% Hispanic / Latino 23% Black 3%
- Hispanic origin (detail)
- Common ancestry
- Italian 21% Portuguese 7% Scotch-Irish 4%
- Foreign-born
- 18% · Canada
- Languages at home
- 83% English-only · Spanish 17%
Political lean MEDSL · Suffolk
- 2024 margin
- Lean R (+10.0) · D 45.0% · R 55.0%
- 2008→2024 swing
- -16.0pp toward R · 2008: 6.0pp · 2024: -10.0pp
- All cycles
- 2024: R+10.0 2020: R+0.0 2016: R+8.2 2012: D+2.9 2008: D+6.0
Not yet ingested
- Civics
- —
Market trends
- HPI YoY
- ▲ 4.01%
- Current HPI
- 364.8746
- Rent YoY
- —
- Metro
- —
- State GDP YoY
- ▲ 2.60%
- F500 in state
- 92
Industry mix (Fortune 500 HQ in NY)
| Industry | F500 HQs | Revenue |
|---|---|---|
| Financial Services | 10 | $950B |
|
||
| Consumer Goods | 9 | $162B |
|
||
| Insurance | 4 | $225B |
|
||
| Telecommunications | 2 | $144B |
|
||
| Pharmaceuticals | 2 | $112B |
|
||
| Media / Entertainment | 2 | $69B |
|
||
Price history
+431.7% since first listed5 events — show timeline
- 2026-04-29 Listed $1,595,000 OneKey® MLS as Distributed by MLS Grid
- 2021-07-02 Sold (Public Records) $1,035,000 Public Records
- 2018-07-06 Sold (Public Records) $960,000 Public Records
- 2007-10-09 Sold (Public Records) $999,000 Public Records
- 2004-02-03 Sold (Public Records) $300,000 Public Records
Property tax history
+0.1%/yrLatest (2025): $2,091 · +5.8% YoY. Source: county tax records.
Cash-flow waterfall
monthlySold comps — $/sqft
last 12 mo · ≤1 miLoading sold comps…