1124 Atlantis Dr · Collinsburg, PA
Flood risk No data
- FEMA flood zone
- —
- Chance of flooding over 30 yrs
- —
- Est. flood insurance / yr
- —
Fire risk No data
- Est. fire insurance / yr
- —
Heat risk No data
- Hot days now (above threshold)
- —
- Hot days in 30 yrs
- —
Wind risk No data
- Chance of severe wind over 30 yrs
- —
Air-quality risk No data
- Unhealthy air days now
- —
- Unhealthy air days in 30 yrs
- —
Risk factors via First Street. Map © Google.
Why this score? — see what drove the B- grade
The composite is a weighted blend of 9 inputs, each scored 0–100. Each bar is that input's sub-score; the figure is the points it added to the 100-point composite (weight × sub-score).
- Cash flow +30.0/30.0
- 1% rule +10.0/10.0
- DSCR +10.0/10.0
- ARV discount +7.5/15.0
- Schools +3.9/10.0
- Livability +2.9/5.0
- Rent growth +2.5/5.0
- Condition / age +2.5/5.0
- Appreciation +0.0/10.0
$39,900
🖨 Deal sheet (PDF) 📄 Offer letter ✓ Due diligence
Listing remarks MLS
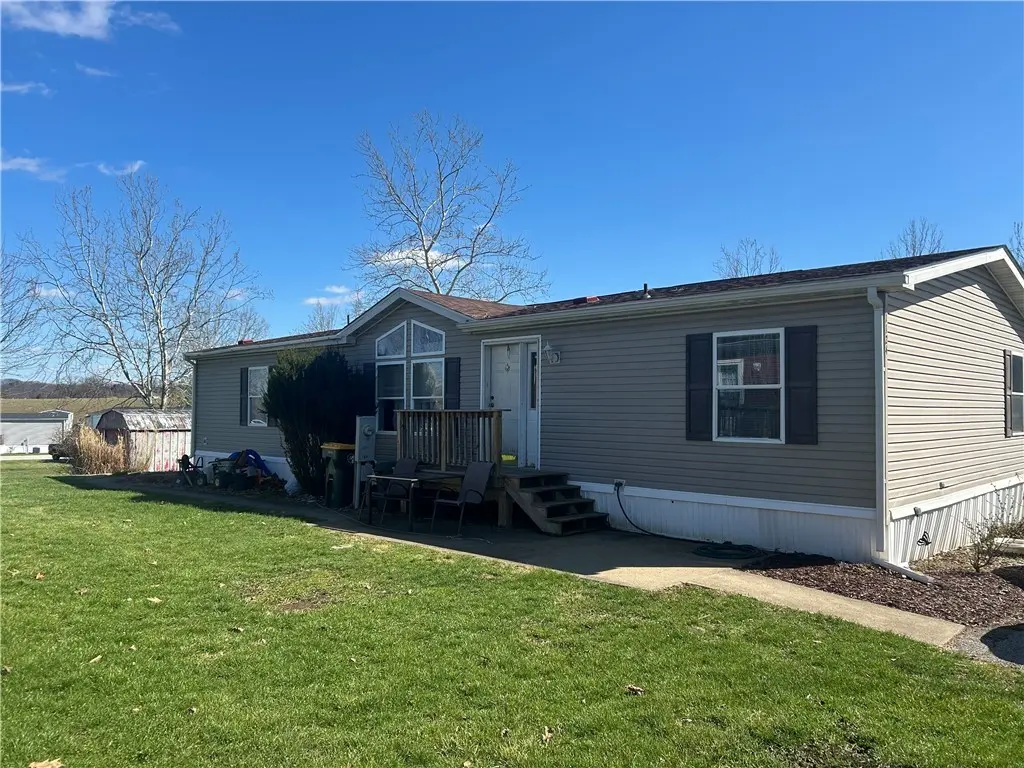
Welcome home to easy, affordable living in West Newton! This charming 4-bedroom, 2-bath mobile home offers the perfect blend of comfort and convenience, making it an ideal choice for anyone looking to simplify without sacrificing location. Step inside to find a functional layout with spacious bedrooms, including a primary suite with its own private bath. A second full bathroom adds extra convenience for guests or family. Whether you're just starting out, downsizing, or looking for a low-maintenance lifestyle, this home checks all the boxes. Situated just minutes from shopping, dining, and everyday essentials in Belle Vernon, you’ll love how close you are to everything you need while still enjoying a peaceful setting. Plus, the monthly lot fee includes trash service—adding even more value and ease to your day-to-day living. Affordable, convenient, and move-in ready—don’t miss your chance to make this one yours!
Key facts
- 4,356 sq ft lot
- 2 parking spots
- Built 1994
Neighborhood map
What this means for you Summary
Snapshot
- This is a 4-bed/2.0-bath manufactured listed at $40k.
Deal economics
- At list price, monthly cash flow is $240 ($3k/yr) — positive.
- The deal already cash-flows at list — no discount required.
- Meets the 1% rule at list price ($1k rent vs $40k).
- Recommended offer: $38k (6.0% below list) — sets the bar for market timing.
Location & tenants
- Location reads 57/100 on livability (#1,619 in PA) — a working-class tenant base; expect higher turnover. Strengths: cost of living A+, employment A; Watch: amenities F, commute F, health & safety F.
- Belle Vernon Area SD (suburban): math 34% / reading 56% proficiency, ranked #267 of 539 in PA (top 50%) — families likely to look elsewhere, expect single-tenant / working-renter base with shorter leases.
- Zoned schools: Rostraver El Sch (math 37% / reading 57%, grade D-, #737 of 1,518 statewide, top 52%, 646 students, 45% FRL); Belle Vernon Area Ms (math 12% / reading 52%, grade F, #362 of 512 statewide, top 71%, 334 students, 46% FRL); Belle Vernon Area Hs (math 57%, 752 students, 36% FRL).
- Market conditions: 22 active listings in the ZIP; 415 units permitted in Westmoreland County in 2024 (10 in 5+ unit buildings).
Forward outlook
- Local home prices are declining (-3.0%/yr); year-one equity from $276 of loan paydown is wiped out by about $1k of value loss. Plan a longer hold.
- Westmoreland County population projected at -19% by 2050 — secular population decline; favor cash flow + early exit over multi-decade hold.
- At projected returns (-3.0% appreciation + 3.0% rent growth), your $11k cash investment doubles in ~5 years — after that, you're playing with house money.
Negotiation context
- It's been on market 82 days — a 6% lower offer ($38k) is reasonable based on typical stale-listing flexibility.
Risks & watch-outs
- Watch-outs: property tax is 4.2% of price; HOA is 36% of rent.
Questions for the listing agent
- It's been on market 82 days. Have you received any prior offers? Is the seller open to a 6% concession, seller financing, or rate buy-down credit?
- Property tax is high relative to price — has the assessment been appealed recently, and will the sale trigger a re-assessment?
- What does the HOA fee cover, when was the last increase, and are there any pending special assessments or reserve-fund shortfalls?
- Why hasn't it sold? Are there any deal-killer items the seller is aware of (foundation, flood, title, zoning, code violations)?
- Is there a deadline driving the sale (1031 exchange, divorce, estate, relocation)? That informs how much negotiation room exists.
- Schools are F-rated, which usually means shorter tenancies and higher turnover. Who's the typical renter profile here, and what's been the actual vacancy rate?
- What's the average days-on-market for RENTAL listings here right now (not sales)? A rising rental-DOM trend means longer vacancies and softer asking-rent achievability than the comps imply.
- What's the recent tenant-quality profile in this submarket — average credit score on applications, eviction rate, late-payment / NSF rate, and stable-employment percentage? A property-management company in the area should have these aggregated.
- How much new for-sale + rental construction is in the pipeline within 1–3 miles? Heavy new supply typically softens prices + rents 12–24 months out; constrained supply supports both.
Investment metrics
- 1% rule
- 3.53% ✓
- Cap rate
- 13.50%
- Cash-on-cash
- 25.73%
- DSCR
- 2.14
- GRM
- 2.4
CMA / ARV
No comps found within radius.
Projected returns pro-forma
-3.0% appreciation · 3.0% rent growth · sell at horizon
- IRR
- 20.0%
- Equity multiple
- 1.82×
- Total profit
- $9,181
- Equity at exit
- $5,949
- IRR
- 28.7%
- Equity multiple
- 3.62×
- Total profit
- $29,219
- Equity at exit
- $3,450
Cash invested: $11,172 (down + closing). Projections, not guarantees.
Landlord ↔ Tenant lean methodology
- Overall (STATE)
- 62 Landlord-Friendly
- State Pennsylvania
- 62 Landlord-Friendly · EVEN
- County
- — inherits STATE
- City
- — inherits STATE
ZIP-level market 15089
- Home prices YoY
- -19.6%
- Active inventory
- 22
- Price-to-rent
- 2.4×
Monthly cashflow live
- Estimated rent
- $1,408 medium interval (Pro) →
- Mortgage (P&I)
- −$209
- Tax from tax record
- −$138 /mo · $1,656/yr
- Insurance
- −$17
- HOA
- −$509
- Vacancy / Maint / Mgmt
- −$296
- Net cashflow
- $240
Break-even live
Sensitivity live
| Price | -10% $262 | -5% $251 | +0% $240 | +5% $228 | +10% $217 |
|---|---|---|---|---|---|
| Rent | -10% $128 | -5% $184 | +0% $240 | +5% $295 | +10% $351 |
| Rate | -1.0pp $260 | -0.5pp $250 | base $240 | +0.5pp $229 | +1.0pp $219 |
UW: 25.0% down · 7.5% · 30yr · 1.5% tax · 5.0% vac · 8.0% maint · 8.0% mgmt
Financing live
Cash to close
- Down payment
- $9,975
- Closing costs
- $1,197
- Reserves months
- —
- Total cash needed
- —
Loan-product check · same deal, 3 products live
Conventional
25% down · 7.5% · 30yr
- Down + closing
- —
- Monthly P&I
- —
- Monthly cashflow
- —
- DSCR
- —
- Eligible?
- —
Personal DTI + credit; lowest rate.
DSCR
20% down · 8.5% · 30yr
- Down + closing
- —
- Monthly P&I
- —
- Monthly cashflow
- —
- DSCR
- —
- Eligible?
- —
No personal income docs; deal must DSCR.
Hard money
10% down · 12.0% · 12mo
- Down + closing
- —
- Monthly P&I
- —
- Monthly cashflow
- —
- DSCR
- —
- Eligible?
- —
Short-term bridge; refi at stabilization.
HOA detail
- Monthly dues
- $509 · $6,108/yr
- Likely covers
- trash
Listing history 14 events
-
2026-06-21days on market $39,900 Active 82 DOM
-
2026-06-18days on market $39,900 Active 79 DOM
-
2026-06-17days on market $39,900 Active 78 DOM
-
2026-06-16days on market $39,900 Active 77 DOM
-
2026-06-15days on market $39,900 Active 76 DOM
-
2026-06-13days on market $39,900 Active 74 DOM
-
2026-06-09days on market $39,900 Active 70 DOM
-
2026-06-08days on market $39,900 Active 69 DOM
-
2026-06-07pricestatusdays on market $39,900 Active 68 DOM
-
2026-06-03days on market $41,900 Contingent 64 DOM
-
2026-06-02days on market $41,900 Contingent 63 DOM
-
2026-06-01days on market $41,900 Contingent 62 DOM
-
2026-05-31days on market $41,900 Contingent 61 DOM
-
2026-03-31$46,900 Active 947-char remark
Show marketing remark (947 chars)
Welcome home to easy, affordable living in West Newton! This charming 4-bedroom, 2-bath mobile home offers the perfect blend of comfort and convenience, making it an ideal choice for anyone looking to simplify without sacrificing location. Step inside to find a functional layout with spacious bedrooms, including a primary suite with its own private bath. A second full bathroom adds extra convenience for guests or family. Whether you're just starting out, downsizing, or looking for a low-maintenance lifestyle, this home checks all the boxes. Situated just minutes from shopping, dining, and everyday essentials in Belle Vernon, you’ll love how close you are to everything you need while still enjoying a peaceful setting. Plus, the monthly lot fee includes trash service—adding even more value and ease to your day-to-day living. Affordable, convenient, and move-in ready—don’t miss your chance to make this one yours!
ⓘ Source: listings_history table (triggers on properties + properties_extension) + one-shot
backfill from property_details.listing_events for pre-trigger history.
Tax reassessment forecast PA · Partial reset (capped growth)
- Current annual tax
- $1,656 · $138/mo
- Projected year-2 tax
- $1,656 · $138/mo
- Expected delta
- $0/yr ($0/mo · 0.0%)
ⓘ Screening estimate from a state-policy table — verify with the county assessor before closing.
Nearby sold comps map
Loading sold comps map…
Walkable amenities ~0.75 mi
Loading nearby amenities…
Taxation est. · year 1
- Rental income
- $16,898
- − Mortgage interest
- −$2,235
- − Property taxes
- −$1,656
- − Insurance
- −$200
- − Repairs & maintenance
- −$1,352
- − Management
- −$1,352
- − HOA
- −$6,108
- − Depreciation
- −$1,161
- Taxable income
- $2,835
- Est. tax owed @ 24.0%
- −$680
- After-tax cash flow
- $2,194/yr
For passive investors: Depreciation is non-cash, so a rental often shows a tax loss while cash-flowing — sheltering income. Rental losses are passive: they offset passive income freely, and up to $25,000/yr can offset ordinary (W-2) income if you actively participate and your MAGI is under $100k (phasing out to $0 by $150k); unused losses carry forward. On sale, claimed depreciation is recaptured at up to 25%, and gains may owe capital-gains tax (a 1031 exchange can defer both). Figures are a year-1 estimate at your 24.0% rate — not tax advice; consult a CPA.
Schools (NCES district)
- District
- Belle Vernon Area SD
- NCES district ID
- 4203210
- Math proficiency
- 34% ▼ -15.00%
- Reading proficiency
- 56% ▼ -13.00%
- Median HH income
- $51,784
- Composite
- 38.72/100
- National rank
- #4134
- State rank
- #267 of 539 in PA
Livability — Collinsburg
- Score
- 57/100
- State rank
- #1619
- US rank
- #22165
Category grades
Schools grade is shown separately in the Schools card above.
Census & demographics
- Census place
- Collinsburg, PA
- Population (ZIP)
- 6,640
Population outlook (Westmoreland County) Hauer SSP2
- Today (2025)
- 342,555 people
- By 2030
- 331,717 · -3.2%
- By 2040
- 304,976 · -11.0%
- By 2050
- 277,444 · -19.0%
- By 2075
- 224,607 · -34.4%
- By 2100
- 171,084 · -50.1%
Race, ethnicity, and origin ACS 2023
- Neighborhood character
- Predominantly White (94%)
- Race & ethnicity
- White 94% Black 4% Two or more races 2%
- Common ancestry
- Romanian 8% Slovak 3% Scotch-Irish 2%
- Foreign-born
- 1% · Canada
- Languages at home
- 97% English-only · Spanish 2% French/Haitian/Cajun 1%
Political lean MEDSL · Westmoreland
- 2024 margin
- Strong R (+28.4) · D 35.4% · R 63.9%
- 2008→2024 swing
- -11.7pp toward R · 2008: -16.7pp · 2024: -28.4pp
- All cycles
- 2024: R+28.4 2020: R+28.3 2016: R+31.3 2012: R+23.7 2008: R+16.7
Not yet ingested
- Civics
- —
Market trends
- HPI YoY
- ▼ -36.79%
- Current HPI
- 150.6723
- Rent YoY
- —
- Metro
- —
- State GDP YoY
- ▲ 1.68%
- F500 in state
- 34
Industry mix (Fortune 500 HQ in PA)
| Industry | F500 HQs | Revenue |
|---|---|---|
| Healthcare | 2 | $309B |
|
||
| Insurance | 2 | $27B |
|
||
| Telecommunications / Media | 1 | $124B |
|
||
| Industrial Distribution | 1 | $22B |
|
||
| Financial Services | 1 | $20B |
|
||
| Chemicals / Materials | 1 | $18B |
|
||
Price history
1 event — show timeline
- 2026-03-31 Listed $46,900 West Penn MLS
Property tax history
+2.3%/yrLatest (2026): $1,656 · +2.1% YoY. Source: county tax records.
Cash-flow waterfall
monthlySold comps — $/sqft
last 12 mo · ≤1 miLoading sold comps…