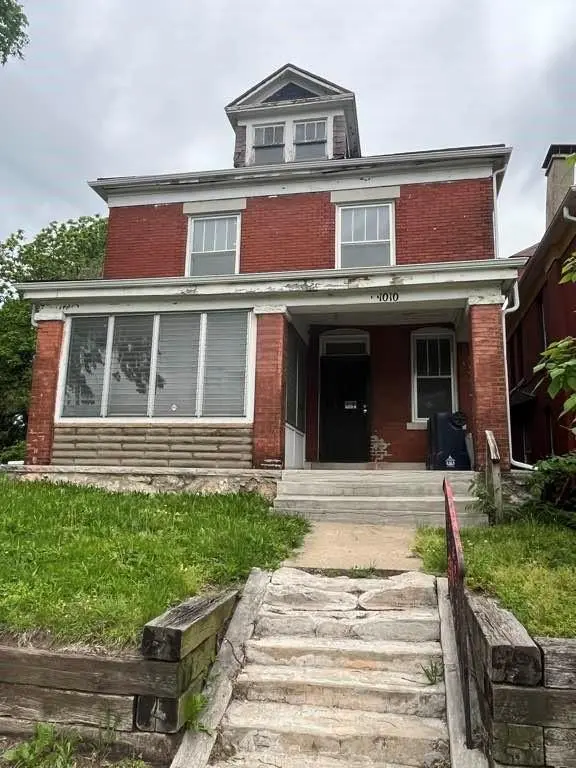
1010 Brooklyn Ave · Kansas City, MO
Flood risk 1/10 · Minimal
- FEMA flood zone
- X (unshaded)
- Chance of flooding over 30 yrs
- 0.0%
- Est. flood insurance / yr
- $473 – $860
Fire risk 1/10 · Minimal
- Est. fire insurance / yr
- $1,054 – $1,958
Heat risk 4/10 · Minor
- Hot days now (above 106°F)
- 7 days/yr
- Hot days in 30 yrs
- 17 days/yr
Wind risk 2/10 · Minimal
- Chance of severe wind over 30 yrs
- —
Air-quality risk 3/10 · Minor
- Unhealthy air days now
- 2 days/yr
- Unhealthy air days in 30 yrs
- 3 days/yr
Risk factors via First Street. Map © Google.
Why this score? — see what drove the B- grade
The composite is a weighted blend of 9 inputs, each scored 0–100. Each bar is that input's sub-score; the figure is the points it added to the 100-point composite (weight × sub-score).
- Cash flow +30.0/30.0
- 1% rule +10.0/10.0
- DSCR +10.0/10.0
- ARV discount +7.5/15.0
- Livability +3.9/5.0
- Rent growth +2.7/5.0
- Condition / age +2.5/5.0
- Schools +1.5/10.0
- Appreciation +1.1/10.0
$64,900
🖨 Deal sheet 📄 Offer letter ✓ Due diligence
Listing remarks MLS
Welcome to 1010 Brooklyn Avenue, a charming opportunity in the heart of Kansas City! This property offers a great blend of character and potential, perfect for homeowners or investors alike. Conveniently located with easy access to major highways, downtown Kansas City, and local amenities, this home sits in an established neighborhood with ongoing growth and revitalization. Inside, you’ll find a functional layout with ample natural light and space to make your own. Whether you're looking to add to your rental portfolio or create your ideal residence. Enjoy a spacious lot with plenty of outdoor potential—ideal for entertaining, gardening, or future enhancements. With its central location and strong upside, 1010 Brooklyn Avenue is a smart investment you won’t want to miss. Schedule your showing today and explore the possibilities!
Key facts
- Open third floor
- Fenced yard
- View of downtown
Tags
Neighborhood map
What this means for you Summary
Snapshot
- This is a 4-bed/2.0-bath single-family listed at $65k.
Deal economics
- At list price, monthly cash flow is $1k ($16k/yr) — positive.
- The deal already cash-flows at list — no discount required.
- Meets the 1% rule at list price ($2k rent vs $65k).
- Recommended offer: $61k (6.0% below list) — sets the bar for market timing.
- Cap rate 31.6% vs local median 3.9% in Kansas City — top-decile yield for the area; either an underpriced asset or a hidden risk that comps aren't pricing in. Stress-test before assuming the spread holds.
Location & tenants
- Location reads 78/100 on livability (#28 in MO, #2,671 nationally) — a middle-class / working-renter tenant base. Strengths: amenities A+, commute A+, cost of living A+; Watch: schools C-, crime F.
- Kansas City 33 (urban): math 12% / reading 24% proficiency, ranked #308 of 324 in MO (top 95%) — low school quality limits family demand, transient renter base, plan for 1-2y turnover; 75% free/reduced lunch — lower-income household profile, screen leases tightly.
- Market conditions: Rents flat; 108 active listings in the ZIP; 5 comparable units currently listed for rent nearby; rentals at typical pace (median 16d on market — plan ~3-4 weeks tenant-placement turnaround); 40% of comp listings sitting > 30 days — soft ceiling on asking rent; lower-income renter base — watch delinquency; 4,002 units permitted in Jackson County in 2024 (2,271 in 5+ unit buildings).
- At $2,313/mo this rent would consume 84% of the median local household income ($33k/yr) (locally 1943% of renters already pay >50% of income on rent) — very limited rent-growth headroom before tenants either downsize or default.
Forward outlook
- Local home prices are declining (-3.0%/yr); year-one equity from $449 of loan paydown is wiped out by about $2k of value loss. Plan a longer hold.
- Jackson County population projected at +4% by 2050 — modest demand growth; plan on rents tracking national, not racing it.
- At projected returns (-3.0% appreciation + 0.9% rent growth), your $18k cash investment doubles in ~2 years — after that, you're playing with house money.
Negotiation context
- It's been on market 77 days — a 6% lower offer ($61k) is reasonable based on typical stale-listing flexibility.
- 3 sale attempts since 22y ago; this cycle's ask has dropped $10k (13%) from the opening price — seller is motivated, your offer sets the floor, not the list.
Risks & watch-outs
- Watch-outs: built in 1900 — expect roof / HVAC / electrical / plumbing capex.
Questions for the listing agent
- It's been on market 77 days. Have you received any prior offers? Is the seller open to a 6% concession, seller financing, or rate buy-down credit?
- Built in 1900 — when were the roof, HVAC, electrical panel, plumbing, and water heater last replaced?
- Why hasn't it sold? Are there any deal-killer items the seller is aware of (foundation, flood, title, zoning, code violations)?
- Is there a deadline driving the sale (1031 exchange, divorce, estate, relocation)? That informs how much negotiation room exists.
- Crime grade is F in this area — have there been break-ins, vandalism, or insurance claims at this property in the last 3 years? What carrier currently insures it and at what premium?
- What's the average days-on-market for RENTAL listings here right now (not sales)? A rising rental-DOM trend means longer vacancies and softer asking-rent achievability than the comps imply.
- What's the recent tenant-quality profile in this submarket — average credit score on applications, eviction rate, late-payment / NSF rate, and stable-employment percentage? A property-management company in the area should have these aggregated.
- How much new for-sale + rental construction is in the pipeline within 1–3 miles? Heavy new supply typically softens prices + rents 12–24 months out; constrained supply supports both.
Investment metrics
- 1% rule
- 3.56% ✓
- Cap rate
- 31.59%
- Cash-on-cash
- 90.36%
- DSCR
- 5.02
- GRM
- 2.3
CMA / ARV
- ARV (median comp)
- $209,823
- List price
- $64,900
- Delta
- -69.07%
- Verdict
- UNDERPRICED
- Comps
- 20 within 1.0 mi
Show comp detail 12 sales within ~0.75 mi
| Address | Dist | Beds/Ba | Sqft | Sold | Price | $/sf | Match |
|---|---|---|---|---|---|---|---|
| 1010 Brooklyn Ave | 0.00mi | 4/2.0 | 2,464 (-8%) | 1mo | $64,900 | $26 | 87 |
| 2515 E 10th St | 0.23mi | 3/2.5 (-1) | 2,755 (+3%) | 5mo | $183,000 | $66 | 72 |
| 1009 Park Ave | 0.09mi | 3/2.5 (-1) | 2,467 (-8%) | 10mo | $199,900 | $81 | 68 |
| 1228 Olive St | 0.24mi | 5/4.5 (+1) | 2,874 (+8%) | 4mo | $365,000 | $127 | 58 |
| 516 Olive St | 0.49mi | 3/2.0 (-1) | 2,367 (-11%) | 2mo | $475,000 | $201 | 52 |
| 917 Benton Blvd | 0.66mi | 5/2.5 (+1) | 2,804 (+5%) | 5mo | $77,000 | $27 | 50 |
| 500 Brooklyn Ave | 0.52mi | 5/3.5 (+1) | 2,440 (-8%) | 3mo | $200,000 | $82 | 48 |
| 2658 E 7th St | 0.48mi | 5/3.0 (+1) | 2,449 (-8%) | 10mo | $225,000 | $92 | 47 |
| 1827 Missouri Ave | 0.57mi | 4/2.0 | 2,360 (-12%) | 17mo | $311,816 | $132 | 40 |
| 400 Montgall St | 0.74mi | 4/3.0 | 2,384 (-11%) | 9mo | $344,000 | $144 | 37 |
| 522 Bellefontaine Ave | 0.65mi | 3/3.5 (-1) | 2,907 (+9%) | 14mo | $299,950 | $103 | 32 |
| 326 Wabash Ave | 0.64mi | 4/3.0 | 2,328 (-13%) | 19mo | $475,000 | $204 | 29 |
Match score weights: distance 35% · size 25% · config 20% · recency 20%. Top-matched comps best support the ARV.
Projected returns pro-forma
-3.0% appreciation · 0.94% rent growth · sell at horizon
- IRR
- 88.7%
- Equity multiple
- 4.96×
- Total profit
- $71,982
- Equity at exit
- $9,677
- IRR
- 91.3%
- Equity multiple
- 9.62×
- Total profit
- $156,580
- Equity at exit
- $5,611
Cash invested: $18,172 (down + closing). Projections, not guarantees.
Landlord ↔ Tenant lean methodology
- Overall (STATE)
- 81 Strongly Landlord-Friendly
- State Missouri
- 81 Strongly Landlord-Friendly · R+10
- County
- — inherits STATE
- City
- — inherits STATE
ZIP-level market 64127
- Home prices YoY
- -2.6%
- Rents YoY
- 0.9%
- Active inventory
- 108
- Price-to-rent
- 2.3×
Monthly cashflow live
- Estimated rent
- $2,313 high interval (Pro) →
- Mortgage (P&I)
- −$340
- Tax from tax record
- −$91 /mo · $1,096/yr
- Insurance
- −$27
- HOA
- −$0
- Vacancy / Maint / Mgmt
- −$486
- Net cashflow
- $1,368
Break-even live
UW: 25.0% down · 7.5% · 30yr · 1.5% tax · 5.0% vac · 8.0% maint · 8.0% mgmt
Financing live
Cash to close
- Down payment
- $16,225
- Closing costs
- $1,947
- Reserves months
- —
- Total cash needed
- —
Loan-product check · same deal, 3 products live
Conventional
25% down · 7.5% · 30yr
- Down + closing
- —
- Monthly P&I
- —
- Monthly cashflow
- —
- DSCR
- —
- Eligible?
- —
Personal DTI + credit; lowest rate.
DSCR
20% down · 8.5% · 30yr
- Down + closing
- —
- Monthly P&I
- —
- Monthly cashflow
- —
- DSCR
- —
- Eligible?
- —
No personal income docs; deal must DSCR.
Hard money
10% down · 12.0% · 12mo
- Down + closing
- —
- Monthly P&I
- —
- Monthly cashflow
- —
- DSCR
- —
- Eligible?
- —
Short-term bridge; refi at stabilization.
Rent comps 5 comps
| Address | Beds | Baths | Sqft | Rent | $/sqft | DOM | Units | Dist |
|---|---|---|---|---|---|---|---|---|
| 2919 E 12th St Kansas City, MO | 3.0 | 2.0 | 1943 | $2,000 | $1.03 | 43d | 1 | 0.50mi |
| 307 Bellefontaine Ave Kansas City, MO | 3.0 | 3.0 | 2023 | $3,500 | $1.73 | 16d | 1 | 0.86mi |
| 3311 E 19th St Kansas City, MO | 5.0 | 3.0 | 2500 | $2,000 | $0.80 | 43d | 1 | 1.03mi |
| 3429 Morrell Ave Kansas City, MO | 4.0 | 1.5 | 1800 | $1,650 | $0.92 | 7d | 1 | 1.13mi |
| 2436 Forest Ave Kansas City, MO | 5.0 | 4.0 | 2632 | $4,000 | $1.52 | 7d | 1 | 1.48mi |
Listing history 14 events
-
2026-05-11status Pending 858-char remark
Show marketing remark (858 chars)
Welcome to 1010 Brooklyn Avenue, a charming opportunity in the heart of Kansas City! This property offers a great blend of character and potential, perfect for homeowners or investors alike. Conveniently located with easy access to major highways, downtown Kansas City, and local amenities, this home sits in an established neighborhood with ongoing growth and revitalization. Inside, you’ll find a functional layout with ample natural light and space to make your own. Whether you're looking to add to your rental portfolio or create your ideal residence. Enjoy a spacious lot with plenty of outdoor potential—ideal for entertaining, gardening, or future enhancements. With its central location and strong upside, 1010 Brooklyn Avenue is a smart investment you won’t want to miss. Schedule your showing today and explore the possibilities!
-
2026-04-27price $64,900 858-char remark
Show marketing remark (858 chars)
Welcome to 1010 Brooklyn Avenue, a charming opportunity in the heart of Kansas City! This property offers a great blend of character and potential, perfect for homeowners or investors alike. Conveniently located with easy access to major highways, downtown Kansas City, and local amenities, this home sits in an established neighborhood with ongoing growth and revitalization. Inside, you’ll find a functional layout with ample natural light and space to make your own. Whether you're looking to add to your rental portfolio or create your ideal residence. Enjoy a spacious lot with plenty of outdoor potential—ideal for entertaining, gardening, or future enhancements. With its central location and strong upside, 1010 Brooklyn Avenue is a smart investment you won’t want to miss. Schedule your showing today and explore the possibilities!
-
2026-03-25price $69,900 858-char remark
Show marketing remark (858 chars)
Welcome to 1010 Brooklyn Avenue, a charming opportunity in the heart of Kansas City! This property offers a great blend of character and potential, perfect for homeowners or investors alike. Conveniently located with easy access to major highways, downtown Kansas City, and local amenities, this home sits in an established neighborhood with ongoing growth and revitalization. Inside, you’ll find a functional layout with ample natural light and space to make your own. Whether you're looking to add to your rental portfolio or create your ideal residence. Enjoy a spacious lot with plenty of outdoor potential—ideal for entertaining, gardening, or future enhancements. With its central location and strong upside, 1010 Brooklyn Avenue is a smart investment you won’t want to miss. Schedule your showing today and explore the possibilities!
-
2026-02-23$74,900 Active 858-char remark
Show marketing remark (858 chars)
Welcome to 1010 Brooklyn Avenue, a charming opportunity in the heart of Kansas City! This property offers a great blend of character and potential, perfect for homeowners or investors alike. Conveniently located with easy access to major highways, downtown Kansas City, and local amenities, this home sits in an established neighborhood with ongoing growth and revitalization. Inside, you’ll find a functional layout with ample natural light and space to make your own. Whether you're looking to add to your rental portfolio or create your ideal residence. Enjoy a spacious lot with plenty of outdoor potential—ideal for entertaining, gardening, or future enhancements. With its central location and strong upside, 1010 Brooklyn Avenue is a smart investment you won’t want to miss. Schedule your showing today and explore the possibilities!
-
2025-03-06historical
-
2025-01-15price $90,000
-
2024-12-17price $95,000
-
2024-12-10price $100,000
-
2024-12-03price $103,000
-
2024-11-20$105,000 Active
-
2004-08-18soldstatus
-
2004-08-17soldstatus
-
2004-05-15$85,000
-
1985-06-01soldstatus
ⓘ Source: listings_history table (triggers on properties + properties_extension) + one-shot
backfill from property_details.listing_events for pre-trigger history.
Tax reassessment forecast MO · Resets to sale price
- Current annual tax
- $1,096 · $91/mo
- Projected year-2 tax
- $1,096 · $91/mo
- Expected delta
- $0/yr ($0/mo · 0.0%)
ⓘ Screening estimate from a state-policy table — verify with the county assessor before closing.
Climate risk First Street
- Flood 1/10 Low FEMA zone X (unshaded) · 0% chance over 30 yrs
- Wildfire 1/10 Low
- Heat 4/10 Moderate 7 d/yr ≥106°F today · 17 d/yr by 30 yrs out
- Wind 2/10 Low
- Air quality 3/10 Moderate 2 unhealthy d/yr today · 3 by 30 yrs out
Nearby sold comps map
Loading sold comps map…
Walkable amenities ~0.75 mi
Loading nearby amenities…
Taxation est. · year 1
- Rental income
- $27,754
- − Mortgage interest
- −$3,635
- − Property taxes
- −$1,096
- − Insurance
- −$324
- − Repairs & maintenance
- −$2,220
- − Management
- −$2,220
- − Depreciation
- −$1,888
- Taxable income
- $16,369
- Est. tax owed @ 24.0%
- −$3,929
- After-tax cash flow
- $12,492/yr
For passive investors: Depreciation is non-cash, so a rental often shows a tax loss while cash-flowing — sheltering income. Rental losses are passive: they offset passive income freely, and up to $25,000/yr can offset ordinary (W-2) income if you actively participate and your MAGI is under $100k (phasing out to $0 by $150k); unused losses carry forward. On sale, claimed depreciation is recaptured at up to 25%, and gains may owe capital-gains tax (a 1031 exchange can defer both). Figures are a year-1 estimate at your 24.0% rate — not tax advice; consult a CPA.
Schools (NCES district)
- District
- Kansas City 33
- NCES district ID
- 2916400
- Math proficiency
- 12% ▼ -8.00%
- Reading proficiency
- 24% ▬ 0.00%
- Median HH income
- $35,227
- Composite
- 14.8/100
- National rank
- #9387
- State rank
- #308 of 324 in MO
Livability — Kansas City
- Score
- 78/100
- State rank
- #28
- US rank
- #2671
Category grades
Schools grade is shown separately in the Schools card above.
Census & demographics
- Census place
- Kansas City, MO
- County
- Jackson County · 687,798 people
- City population
- 439,467
- Metro
- Kansas City, MO-KS
- Population (ZIP)
- 17,668
- Household income
- $33,111
- Rent vs Own
- Severe rent burden
- 1943.0
Population outlook (Jackson County) Hauer SSP2
- Today (2025)
- 719,589 people
- By 2030
- 731,456 · +1.6%
- By 2040
- 746,689 · +3.8%
- By 2050
- 749,289 · +4.1%
- By 2075
- 736,227 · +2.3%
- By 2100
- 668,210 · -7.1%
Race, ethnicity, and origin ACS 2023
- Neighborhood character
- Diverse neighborhood (Simpson 0.65)
- Race & ethnicity
- Black 42% Hispanic / Latino 40% Two or more races 13% White 12% Native American 1%
- Hispanic origin (detail)
- Mexican 28%
- Foreign-born
- 20% · Canada, Vietnam
- Languages at home
- 67% English-only · Spanish 29%
Political lean MEDSL · Jackson
- 2024 margin
- D (+19.3) · D 58.9% · R 39.5% · Other 1.6%
- 2008→2024 swing
- -6.1pp toward R · 2008: 25.4pp · 2024: 19.3pp
- All cycles
- 2024: D+19.3 2020: D+22.0 2016: D+16.6 2012: D+19.0 2008: D+25.4
Not yet ingested
- Civics
- —
Market trends
- HPI YoY
- ▼ -7.88%
- Current HPI
- 289.2468
- Rent YoY
- ▲ 0.94%
- Metro
- Kansas City, MO-KS
- State GDP YoY
- ▲ 1.84%
- F500 in state
- 20
Industry mix (Fortune 500 HQ in MO)
| Industry | F500 HQs | Revenue |
|---|---|---|
| Healthcare | 1 | $163B |
|
||
| Insurance | 1 | $21B |
|
||
| Industrial Technology | 1 | $17B |
|
||
| Retail | 1 | $16B |
|
||
| Industrial Distribution | 1 | $10B |
|
||
| Utilities | 1 | $9B |
|
||
Price history
-23.6% since first listed14 events — show timeline
- 2026-05-11 Pending — Heartland MLS as Distributed by MLS Grid
- 2026-04-27 Price Changed $64,900 Heartland MLS as Distributed by MLS Grid
- 2026-03-25 Price Changed $69,900 Heartland MLS as Distributed by MLS Grid
- 2026-02-23 Listed $74,900 Heartland MLS as Distributed by MLS Grid
- 2025-03-06 Listing Removed — Heartland MLS as Distributed by MLS Grid
- 2025-01-15 Price Changed $90,000 Heartland MLS as Distributed by MLS Grid
- 2024-12-17 Price Changed $95,000 Heartland MLS as Distributed by MLS Grid
- 2024-12-10 Price Changed $100,000 Heartland MLS as Distributed by MLS Grid
- 2024-12-03 Price Changed $103,000 Heartland MLS as Distributed by MLS Grid
- 2024-11-20 Listed $105,000 Heartland MLS as Distributed by MLS Grid
- 2004-08-18 Sold (Public Records) — Public Records
- 2004-08-17 Sold (MLS) — Heartland MLS as Distributed by MLS Grid
- 2004-05-15 Listed $85,000 Heartland MLS as Distributed by MLS Grid
- 1985-06-01 Sold (Public Records) — Public Records
Property tax history
+11.0%/yrLatest (2025): $1,096 · -22.0% YoY. Source: county tax records.
Cash-flow waterfall
monthlySold comps — $/sqft
last 12 mo · ≤1 miLoading sold comps…