 Triplex
24 Jewett Ave · Poughkeepsie, NY
Flood risk 1/10 · Minimal
- FEMA flood zone
- X (unshaded)
- Chance of flooding over 30 yrs
- 0.0%
- Est. flood insurance / yr
- $507 – $1,088
Fire risk 3/10 · Minor
- Est. fire insurance / yr
- $691 – $1,283
Heat risk 5/10 · Moderate
- Hot days now (above 99°F)
- 7 days/yr
- Hot days in 30 yrs
- 15 days/yr
Wind risk 4/10 · Minor
- Chance of severe wind over 30 yrs
- 11.0%
Air-quality risk 2/10 · Minimal
- Unhealthy air days now
- 1 days/yr
- Unhealthy air days in 30 yrs
- 3 days/yr
Risk factors via First Street. Map © Google.
Why this score? — see what drove the C+ grade
The composite is a weighted blend of 9 inputs, each scored 0–100. Each bar is that input's sub-score; the figure is the points it added to the 100-point composite (weight × sub-score).
- Cash flow +30.0/30.0
- 1% rule +10.0/10.0
- DSCR +10.0/10.0
- Livability +3.9/5.0
- Rent growth +3.4/5.0
- Schools +3.0/10.0
- Condition / age +2.5/5.0
- ARV discount +0.0/15.0
- Appreciation +0.0/10.0
$499,000
🖨 Deal sheet (PDF) 📄 Offer letter ✓ Due diligence
Multi-family units
County records classify this as Multi-Family (2-4 Unit). Listing-text estimate: 3 units. confirmed
Listing remarks
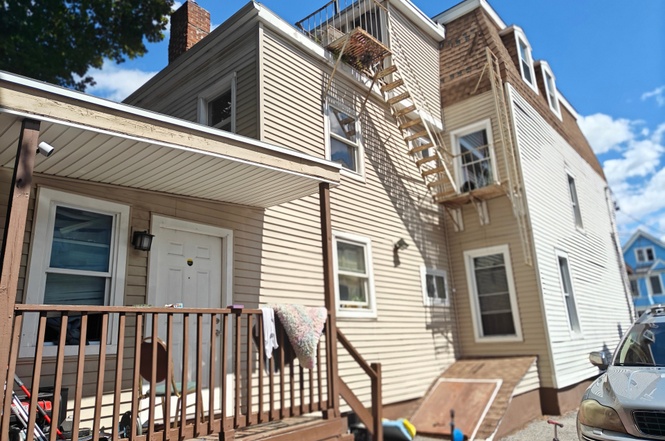
Attention Investors: Live in one and rent the other two units. This 3 family home offers a great investment opportunity. Good sized 7-8 bedrooms units, 3 baths, (3 bedrooms and 1 bath in first floor; 2-3 bedrooms and 1 bath in second floor; another 2 bedrooms and 1 bath unit in the third floor and a walk out to a fire escape as well there's a walk-out basement which serves as a great storage place. Its located on a quiet, no outlet street; 6 yr old boiler and water heater. 4-5 large spaces for parking in the rear ; Full unfinished basement; and Fire escape at the back of the house. Hardwood flooring in the bedrooms. The easy conveniences to the near City markets, transportation, colleges,
Key facts
- Hardwood flooring
- Walk out basement
- 6 yr old boiler
Tags
Property features AI
Exterior
- Parking: Driveway parking for up to 4 vehicles
- Utilities: Public sewer; Electricity available; Natural gas available; Water available; Sewer available
- Home design: Triplex
- Construction: Frame and vinyl siding exterior; Brick/mortar and stone foundation
- Exterior features: Frame construction with vinyl siding; Full unfinished basement with storage space; Not waterfront
Interior
- Kitchen: Eat-in kitchen(s)
- Bedrooms: Two 2-bedroom units and one 3-bedroom unit
- Flooring: Ceramic tile; Hardwood; Laminate
- Bathrooms: Three full bathrooms
- Heating & cooling: Baseboard heating; Hot water heating; No central cooling
- Interior features: First-floor bedroom; First-floor full bathroom; Ceiling fans; Eat-in kitchen; Entrance foyer; Formal dining room; Storage space; Washer/dryer hookup
- Laundry & utility: Washer hookup; Gas dryer hookup
Neighborhood map
What this means for you Summary
Snapshot
- This is a 3 × 5-bed/3.0-bath units multifamily listed at $499k.
Deal economics
- At list price, monthly cash flow is $2k ($25k/yr) — positive. Per door: $705/mo.
- The deal already cash-flows at list — no discount required.
- Meets the 1% rule at list price ($8k rent vs $499k).
- Recommended offer: $454k (9.0% below list) — sets the bar for market timing.
- Cap rate 11.4% vs local median 3.4% in Poughkeepsie — top-decile yield for the area; either an underpriced asset or a hidden risk that comps aren't pricing in. Stress-test before assuming the spread holds.
Location & tenants
- Location reads 78/100 on livability (#165 in NY, #2,577 nationally) — a middle-class / working-renter tenant base. Strengths: commute A+, health & safety A+, housing A-; Watch: employment D+, crime F.
- Poughkeepsie City School District (suburban): math 29% / reading 42% proficiency, ranked #559 of 590 in NY (top 95%) — families likely to look elsewhere, expect single-tenant / working-renter base with shorter leases; 73% free/reduced lunch — lower-income household profile, screen leases tightly.
- Zoned schools: Warring Magnet Academy of Science And Technology (math 5% / reading 24%, grade F, #2,024 of 2,108 statewide, top 97%, 312 students, 80% FRL); Poughkeepsie Middle School (math 8% / reading 37%, grade F, #650 of 729 statewide, top 90%, 877 students, 82% FRL); Poughkeepsie High School (math 59% / reading 67%, grade B-, #819 of 1,100 statewide, top 74%, 1,165 students, 74% FRL).
- Market conditions: Rents rising (+3.7%/yr); 195 active listings in the ZIP; 620 units permitted in Dutchess County in 2024 (242 in 5+ unit buildings).
Forward outlook
- Local home prices are declining (-3.0%/yr); year-one equity from $3k of loan paydown is wiped out by about $15k of value loss. Plan a longer hold.
- Dutchess County population projected at -11% by 2050 — secular population decline; favor cash flow + early exit over multi-decade hold.
- At projected returns (-3.0% appreciation + 3.7% rent growth), your $140k cash investment doubles in ~7 years — after that, you're playing with house money.
Negotiation context
- It's been on market 94 days — a 9% lower offer ($454k) is reasonable based on typical stale-listing flexibility.
- 2 sale attempts with the ask held roughly flat each time — persistent listings suggest the price (not the market) is what's stuck; bring a comps-based counter.
- Current owner paid $154k; list at $499k implies a 225% gain — meaningful room to come down on a strong offer.
Risks & watch-outs
- Watch-outs: property tax is 2.7% of price; built in 1910 — expect roof / HVAC / electrical / plumbing capex.
- Climate carrying-cost: extreme-heat days projected 7→15/yr by 2055 (HVAC capex compounding) — expect insurance premiums to compound above CPI over the hold.
Questions for the listing agent
- It's been on market 94 days. Have you received any prior offers? Is the seller open to a 9% concession, seller financing, or rate buy-down credit?
- Can we see the unit-by-unit rent roll, current vacancy, and any below-market leases? What's the average tenancy length?
- What capital expenditures (roof, boiler, parking lot, exteriors) have been made in the last 5 years, and what's planned in the next 2?
- Built in 1910 — when were the roof, HVAC, electrical panel, plumbing, and water heater last replaced?
- Property tax is high relative to price — has the assessment been appealed recently, and will the sale trigger a re-assessment?
- Why hasn't it sold? Are there any deal-killer items the seller is aware of (foundation, flood, title, zoning, code violations)?
- Is there a deadline driving the sale (1031 exchange, divorce, estate, relocation)? That informs how much negotiation room exists.
- Crime grade is F in this area — have there been break-ins, vandalism, or insurance claims at this property in the last 3 years? What carrier currently insures it and at what premium?
- What's the average days-on-market for RENTAL listings here right now (not sales)? A rising rental-DOM trend means longer vacancies and softer asking-rent achievability than the comps imply.
- What's the recent tenant-quality profile in this submarket — average credit score on applications, eviction rate, late-payment / NSF rate, and stable-employment percentage? A property-management company in the area should have these aggregated.
- How much new apartment / multifamily construction is in the pipeline within 1–3 miles? Heavy new supply (>2% of stock underway) typically softens rents 12–24 months out; light construction supports rent growth.
Investment metrics
- 1% rule
- 1.54% ✓
- Cap rate
- 11.38%
- Cash-on-cash
- 18.17%
- DSCR
- 1.81
- GRM
- 5.4
CMA / ARV
- ARV (on-the-fly)
- $403,848
- Comps found
- 10
Show comp detail 10 sales within ~0.75 mi
| Address | Dist | Beds/Ba | Sqft | Sold | Price | $/sf | Match |
|---|---|---|---|---|---|---|---|
| 1 Gray St | 0.30mi | 6/2.0 | 2,452 (-4%) | 4mo | $349,000 | $142 | 72 |
| 24 North White St | 0.13mi | 6/2.0 | 2,400 (-6%) | 16mo | $215,000 | $90 | 67 |
| 328 Church St | 0.28mi | 5/2.0 (-1) | 2,473 (-3%) | 8mo | $340,000 | $137 | 65 |
| 69 Glenwood Ave | 0.62mi | 6/3.0 | 2,475 (-3%) | 7mo | $425,000 | $172 | 60 |
| 338/340 Church St | 0.25mi | 6/2.0 | 2,692 (+5%) | 20mo | $395,000 | $147 | 59 |
| 33 Manitou Ave | 0.28mi | 5/2.0 (-1) | 2,450 (-4%) | 21mo | $422,000 | $172 | 53 |
| 470 Haight Ave | 0.63mi | 5/3.0 (-1) | 2,586 (+1%) | 23mo | $429,500 | $166 | 44 |
| 65 S Clinton St | 0.58mi | 5/5.0 (-1) | 2,678 (+5%) | 14mo | $550,000 | $205 | 40 |
| 50 Manitou Ave | 0.35mi | 5/2.0 (-1) | 2,240 (-12%) | 23mo | $353,000 | $158 | 35 |
| 8 Hoffman Ave | 0.36mi | 5/2.0 (-1) | 2,184 (-15%) | 24mo | $135,000 | $62 | 30 |
Match score weights: distance 35% · size 25% · config 20% · recency 20%. Top-matched comps best support the ARV.
Projected returns pro-forma
-3.0% appreciation · 3.67% rent growth · sell at horizon
- IRR
- 10.7%
- Equity multiple
- 1.43×
- Total profit
- $59,527
- Equity at exit
- $74,403
- IRR
- 20.4%
- Equity multiple
- 2.78×
- Total profit
- $248,773
- Equity at exit
- $43,144
Cash invested: $139,720 (down + closing). Projections, not guarantees.
Landlord ↔ Tenant lean methodology
- Overall (STATE)
- 15 Strongly Tenant-Friendly
- State New York
- 15 Strongly Tenant-Friendly · D+10
- County
- — inherits STATE
- City
- — inherits STATE
ZIP-level market 12601
- Rents YoY
- 3.7%
- Active inventory
- 195
- Price-to-rent
- 16.2×
Monthly cashflow live
- Estimated rent
- $7,686 medium interval (Pro) →
- Mortgage (P&I)
- −$2,617
- Tax from tax record
- −$1,132 /mo · $13,580/yr
- Insurance
- −$208
- HOA
- −$0
- Vacancy / Maint / Mgmt
- −$1,614
- Net cashflow
- $2,116
Break-even live
Sensitivity live
| Price | -10% $2,398 | -5% $2,257 | +0% $2,116 | +5% $1,974 | +10% $1,833 |
|---|---|---|---|---|---|
| Rent | -10% $1,508 | -5% $1,812 | +0% $2,116 | +5% $2,419 | +10% $2,723 |
| Rate | -1.0pp $2,367 | -0.5pp $2,242 | base $2,116 | +0.5pp $1,986 | +1.0pp $1,855 |
3-unit breakdown (identical units grouped — click to expand)
| Units | Beds | Baths | Est. rent |
|---|---|---|---|
| 3× units | 5 | 3 | $7,686 |
| #1 | 5 | 3 | $2,562 |
| #2 | 5 | 3 | $2,562 |
| #3 | 5 | 3 | $2,562 |
| Total (3 units) | $7,686 | ||
UW: 25.0% down · 7.5% · 30yr · 1.5% tax · 5.0% vac · 8.0% maint · 8.0% mgmt
Financing live
Cash to close
- Down payment
- $124,750
- Closing costs
- $14,970
- Reserves months
- —
- Total cash needed
- —
Loan-product check · same deal, 3 products live
Conventional
25% down · 7.5% · 30yr
- Down + closing
- —
- Monthly P&I
- —
- Monthly cashflow
- —
- DSCR
- —
- Eligible?
- —
Personal DTI + credit; lowest rate.
DSCR
20% down · 8.5% · 30yr
- Down + closing
- —
- Monthly P&I
- —
- Monthly cashflow
- —
- DSCR
- —
- Eligible?
- —
No personal income docs; deal must DSCR.
Hard money
10% down · 12.0% · 12mo
- Down + closing
- —
- Monthly P&I
- —
- Monthly cashflow
- —
- DSCR
- —
- Eligible?
- —
Short-term bridge; refi at stabilization.
Listing history 9 events
-
2026-04-25status Pending
-
2026-01-20$499,000 Active
-
2026-01-14historical
-
2025-08-28price $499,900
-
2025-08-27price $515,990
-
2025-08-27price $525,990
-
2025-08-26$499,990 Active
-
2002-07-23soldstatus $153,500
-
1989-06-28soldstatus $135,333
ⓘ Source: listings_history table (triggers on properties + properties_extension) + one-shot
backfill from property_details.listing_events for pre-trigger history.
Tax reassessment forecast NY · Partial reset (capped growth)
- Current annual tax
- $13,580 · $1,132/mo
- Projected year-2 tax
- $13,580 · $1,132/mo
- Expected delta
- $0/yr ($0/mo · 0.0%)
ⓘ Screening estimate from a state-policy table — verify with the county assessor before closing.
Climate risk First Street
- Flood 1/10 Low FEMA zone X (unshaded) · 0% chance over 30 yrs
- Wildfire 3/10 Moderate
- Heat 5/10 Major 7 d/yr ≥99°F today · 15 d/yr by 30 yrs out
- Wind 4/10 Moderate 11% chance of damaging wind over 30 yrs
- Air quality 2/10 Low 1 unhealthy d/yr today · 3 by 30 yrs out
Nearby sold comps map
Loading sold comps map…
Walkable amenities ~0.75 mi
Loading nearby amenities…
Taxation est. · year 1
- Rental income
- $92,232
- − Mortgage interest
- −$27,952
- − Property taxes
- −$13,580
- − Insurance
- −$2,495
- − Repairs & maintenance
- −$7,379
- − Management
- −$7,379
- − Depreciation
- −$14,516
- Taxable income
- $18,932
- Est. tax owed @ 24.0%
- −$4,544
- After-tax cash flow
- $20,843/yr
For passive investors: Depreciation is non-cash, so a rental often shows a tax loss while cash-flowing — sheltering income. Rental losses are passive: they offset passive income freely, and up to $25,000/yr can offset ordinary (W-2) income if you actively participate and your MAGI is under $100k (phasing out to $0 by $150k); unused losses carry forward. On sale, claimed depreciation is recaptured at up to 25%, and gains may owe capital-gains tax (a 1031 exchange can defer both). Figures are a year-1 estimate at your 24.0% rate — not tax advice; consult a CPA.
Schools (NCES district)
- District
- Poughkeepsie City School District
- NCES district ID
- 3623760
- Math proficiency
- 29% ▲ 5.00%
- Reading proficiency
- 42% ▲ 12.00%
- Median HH income
- $39,159
- Composite
- 29.68/100
- National rank
- #6459
- State rank
- #559 of 590 in NY
Livability — Poughkeepsie
- Score
- 78/100
- State rank
- #165
- US rank
- #2577
Category grades
Schools grade is shown separately in the Schools card above.
Census & demographics
- Census place
- Poughkeepsie, NY
- County
- Dutchess County · 188,048 people
- City population
- 86,468
- Metro
- Poughkeepsie-Newburgh-Middletown, NY
- Population (ZIP)
- 44,164
- Household income
- $63,652
- Rent vs Own
- Severe rent burden
- 2891.0
Population outlook (Dutchess County) Hauer SSP2
- Today (2025)
- 291,768 people
- By 2030
- 287,131 · -1.6%
- By 2040
- 274,881 · -5.8%
- By 2050
- 259,971 · -10.9%
- By 2075
- 235,366 · -19.3%
- By 2100
- 208,786 · -28.4%
Race, ethnicity, and origin ACS 2023
- Neighborhood character
- Highly diverse neighborhood (Simpson 0.70)
- Race & ethnicity
- White 44% Black 24% Hispanic / Latino 22% Two or more races 17% Asian 3%
- Hispanic origin (detail)
- Mexican 8% Puerto Rican 5% Dominican 1%
- Common ancestry
- Romanian 3% Iranian 1% Lithuanian 1%
- Foreign-born
- 19% · Canada, China
- Languages at home
- 79% English-only · Spanish 15% Other Indo-European 1% Chinese 1%
Political lean MEDSL · Dutchess
- 2024 margin
- Lean D (+5.4) · D 52.7% · R 47.3%
- 2008→2024 swing
- -3.2pp toward R · 2008: 8.6pp · 2024: 5.4pp
- All cycles
- 2024: D+5.4 2020: D+9.6 2016: R+1.1 2012: D+6.6 2008: D+8.6
Not yet ingested
- Civics
- —
Market trends
- HPI YoY
- ▼ -210.62%
- Current HPI
- 293.9789
- Rent YoY
- ▲ 3.67%
- Metro
- Poughkeepsie-Newburgh-Middletown, NY
- State GDP YoY
- ▲ 2.60%
- F500 in state
- 92
Industry mix (Fortune 500 HQ in NY)
| Industry | F500 HQs | Revenue |
|---|---|---|
| Financial Services | 10 | $950B |
|
||
| Consumer Goods | 9 | $162B |
|
||
| Insurance | 4 | $225B |
|
||
| Telecommunications | 2 | $144B |
|
||
| Pharmaceuticals | 2 | $112B |
|
||
| Media / Entertainment | 2 | $69B |
|
||
Price history
+268.7% since first listed9 events — show timeline
- 2026-04-25 Pending — OneKey® MLS as Distributed by MLS Grid
- 2026-01-20 Listed $499,000 OneKey® MLS as Distributed by MLS Grid
- 2026-01-14 Listing Removed — OneKey® MLS as Distributed by MLS Grid
- 2025-08-28 Price Changed $499,900 OneKey® MLS as Distributed by MLS Grid
- 2025-08-27 Price Changed $515,990 OneKey® MLS as Distributed by MLS Grid
- 2025-08-27 Price Changed $525,990 OneKey® MLS as Distributed by MLS Grid
- 2025-08-26 Listed $499,990 OneKey® MLS as Distributed by MLS Grid
- 2002-07-23 Sold (Public Records) $153,500 Public Records
- 1989-06-28 Sold (Public Records) $135,333 Public Records
Property tax history
+13.9%/yrLatest (2025): $13,580 · +54.4% YoY. Source: county tax records.
Cash-flow waterfall
monthlySold comps — $/sqft
last 12 mo · ≤1 miLoading sold comps…