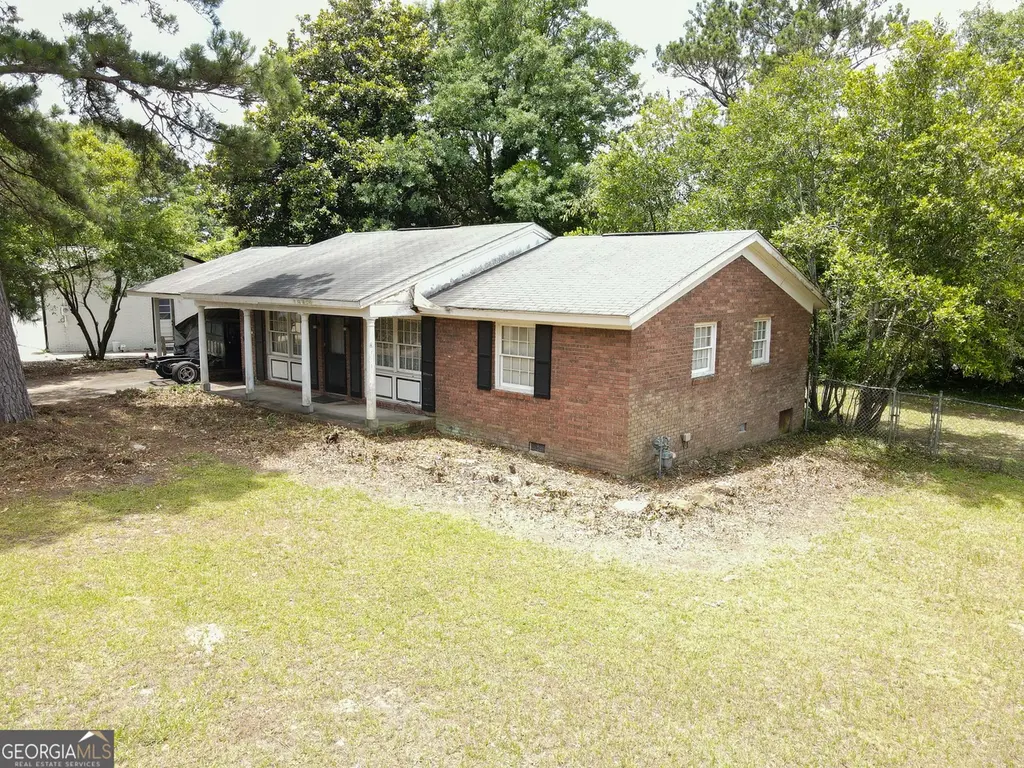
1550 Greenwich Pl · Macon-Bibb County, GA
Flood risk 1/10 · Minimal
- FEMA flood zone
- X (unshaded)
- Chance of flooding over 30 yrs
- 0.0%
- Est. flood insurance / yr
- $507 – $1,088
Fire risk 2/10 · Minimal
- Est. fire insurance / yr
- $963 – $1,789
Heat risk 7/10 · Major
- Hot days now (above 109°F)
- 7 days/yr
- Hot days in 30 yrs
- 18 days/yr
Wind risk 6/10 · Moderate
- Chance of severe wind over 30 yrs
- 66.0%
Air-quality risk 3/10 · Minor
- Unhealthy air days now
- 3 days/yr
- Unhealthy air days in 30 yrs
- 4 days/yr
Risk factors via First Street. Map © Google.
Why this score? — see what drove the C grade
The composite is a weighted blend of 9 inputs, each scored 0–100. Each bar is that input's sub-score; the figure is the points it added to the 100-point composite (weight × sub-score).
- Cash flow +26.9/30.0
- DSCR +9.3/10.0
- ARV discount +7.5/15.0
- 1% rule +6.1/10.0
- Rent growth +3.8/5.0
- Livability +2.5/5.0
- Condition / age +2.5/5.0
- Schools +1.2/10.0
- Appreciation +0.0/10.0
$105,000
🖨 Deal sheet 📄 Offer letter ✓ Due diligence
Listing remarks MLS
Calling all investors, renovators, and buyers with a vision! This 3-bedroom, 2-bath all-brick ranch offers a fantastic opportunity to transform a solid home into something truly special. Situated on a huge level corner lot, this property provides plenty of outdoor space for entertaining, gardening, expansion possibilities, or simply enjoying the privacy of a fenced backyard. Inside, you'll find a functional floor plan featuring a mix of hardwood, carpet, and laminate flooring, offering the perfect canvas for your updates and personal touches. Whether you're looking for your next investment property, a renovation project, a rental portfolio addition, or a place to customize and call home, this property delivers exceptional potential. Conveniently located near shopping, dining, schools, and major roadways, you'll enjoy easy access to everyday amenities while benefiting from the value and versatility this property has to offer.
Key facts
- Fenced backyard
- 0.32 acre lot
- 2 parking spots
Tags
Property features AI
Finance
- Other: Paved road access; Please use GPS for directions
- HOA & community: Association fees billed annually; Community is near schools and shopping
Exterior
- Parking: Carport; Two total parking spaces; Two carport spaces
- Utilities: Public water; Public sewer; Cable available; Electricity available; Natural gas available; Phone available; Water available
- Home design: One-level home; Brick construction (brick 4 sides); Fixer condition; Shingle (composition) roof; Slab foundation; Fee simple ownership
- Construction: Brick construction (brick 4 sides); Composition roof; Slab foundation; Sheds on the property
- Exterior features: Private yard; Back yard fencing; Chain link fence; Fenced yard; Patio; Outdoor storage; Shed(s)
Interior
- Kitchen: Eat-in kitchen; Electric cooktop; Electric oven; Refrigerator
- Bedrooms: Three main-level bedrooms; Primary bedroom on the main level
- Flooring: Carpet; Hardwood; Other flooring
- Bathrooms: Two full bathrooms; Both full bathrooms located on the main level; Master bath with tub/shower combo
- Heating & cooling: Central heating; Central air; Other heating and cooling features
- Interior features: Insulated windows; No shared/common walls; Other interior features; Crawl space basement
- Laundry & utility: Mud room
Neighborhood map
What this means for you Summary
Snapshot
- This is a 3-bed/2.0-bath single-family listed at $105k.
Deal economics
- At list price, monthly cash flow is $289 ($3k/yr) — positive.
- The deal already cash-flows at list — no discount required.
- Meets the 1% rule at list price ($1k rent vs $105k).
- Cap rate 9.6% vs local median 5.4% in Macon-Bibb County — top-decile yield for the area; either an underpriced asset or a hidden risk that comps aren't pricing in. Stress-test before assuming the spread holds.
Location & tenants
- Location reads: area grade C — affects rentability + tenant quality, not the cash-flow math above.
- Bibb County (urban): math 11% / reading 18% proficiency, ranked #161 of 174 in GA (top 92%) — low school quality limits family demand, transient renter base, plan for 1-2y turnover; 75% free/reduced lunch — lower-income household profile, screen leases tightly.
- Zoned schools: Hartley Elementary School (math 2% / reading 2%, grade F, #1,204 of 1,228 statewide, top 100%, 438 students, 100% FRL); Southwest High School (math 2% / reading 17%, grade F, #365 of 424 statewide, top 88%, 800 students, 100% FRL) — zoned schools average 100% FRL vs 75% district-wide (25 pts higher); higher-poverty schools than district average — tighter screening recommended.
- Market conditions: Rents rising fast (+5.0%/yr); 207 active listings in the ZIP; 35 comparable units currently listed for rent nearby; rentals lingering (median 44d on market — plan ~5-8 weeks vacancy on turnover, expect pricing pressure); 57% of comp listings sitting > 30 days — soft ceiling on asking rent; lower-income renter base — watch delinquency; 154 units permitted in Bibb County in 2024 (0 in 5+ unit buildings).
- At $1,163/mo this rent would consume 46% of the median local household income ($30k/yr) (locally 1335% of renters already pay >50% of income on rent) — very limited rent-growth headroom before tenants either downsize or default.
Forward outlook
- Local home prices are declining (-3.0%/yr); year-one equity from $726 of loan paydown is wiped out by about $3k of value loss. Plan a longer hold.
- Bibb County population projected at -12% by 2050 — secular population decline; favor cash flow + early exit over multi-decade hold.
- At projected returns (-3.0% appreciation + 5.0% rent growth), your $29k cash investment doubles in ~9 years — after that, you're playing with house money.
Negotiation context
- Only 12 days on market — expect competitive offers; lowballing is unlikely to land.
- 2 sale attempts with the ask held roughly flat each time — persistent listings suggest the price (not the market) is what's stuck; bring a comps-based counter.
Risks & watch-outs
- Climate carrying-cost: major wind risk, 66% chance of damaging wind over 30y; extreme-heat days projected 7→18/yr by 2055 (HVAC capex compounding) — expect insurance premiums to compound above CPI over the hold.
Questions for the listing agent
- Built in 1963 — when were the roof, HVAC, electrical panel, plumbing, and water heater last replaced?
- Is there a deadline driving the sale (1031 exchange, divorce, estate, relocation)? That informs how much negotiation room exists.
- What's the average days-on-market for RENTAL listings here right now (not sales)? A rising rental-DOM trend means longer vacancies and softer asking-rent achievability than the comps imply.
- What's the recent tenant-quality profile in this submarket — average credit score on applications, eviction rate, late-payment / NSF rate, and stable-employment percentage? A property-management company in the area should have these aggregated.
- How much new for-sale + rental construction is in the pipeline within 1–3 miles? Heavy new supply typically softens prices + rents 12–24 months out; constrained supply supports both.
Investment metrics
- 1% rule
- 1.11% ✓
- Cap rate
- 9.60%
- Cash-on-cash
- 11.80%
- DSCR
- 1.53
- GRM
- 7.5
CMA / ARV
- ARV (on-the-fly)
- $65,772
- Comps found
- 12
Show comp detail 12 sales within ~0.75 mi
| Address | Dist | Beds/Ba | Sqft | Sold | Price | $/sf | Match |
|---|---|---|---|---|---|---|---|
| 2509 Kent Dr | 0.37mi | 3/2.0 | 1,134 (0%) | 1mo | $170,000 | $150 | 82 |
| 1575 Winston Dr | 0.06mi | 2/2.0 (-1) | 1,215 (+7%) | 11mo | $125,000 | $103 | 71 |
| 1355 Harris St | 0.47mi | 3/1.0 | 1,102 (-3%) | 9mo | $102,000 | $93 | 62 |
| 1191 Carroll St | 0.67mi | 3/1.0 | 1,131 (-0%) | 6mo | $70,000 | $62 | 59 |
| 3480 Travis Blvd | 0.73mi | 3/1.0 | 1,056 (-7%) | 1mo | $50,000 | $47 | 50 |
| 1664 Randall Rd | 0.74mi | 3/2.0 | 1,212 (+7%) | 5mo | $70,000 | $58 | 50 |
| 1464 Williamson Rd | 0.43mi | 3/1.0 | 1,300 (+15%) | 4mo | $64,000 | $49 | 48 |
| 853 Grayson Ave | 0.65mi | 3/1.0 | 984 (-13%) | 4mo | $38,000 | $39 | 41 |
| 767 Lilly Ave | 0.71mi | 4/2.0 (+1) | 1,250 (+10%) | 7mo | $33,500 | $27 | 39 |
| 2017 Lowe St | 0.75mi | 3/1.0 | 1,025 (-10%) | 10mo | $47,000 | $46 | 36 |
| 3433 Travis Blvd | 0.67mi | 3/1.0 | 1,008 (-11%) | 14mo | $100,000 | $99 | 34 |
| 3336 Mcevoy Dr | 0.70mi | 3/1.0 | 1,266 (+12%) | 18mo | $69,000 | $55 | 29 |
Match score weights: distance 35% · size 25% · config 20% · recency 20%. Top-matched comps best support the ARV.
Projected returns pro-forma
-3.0% appreciation · 5.03% rent growth · sell at horizon
- IRR
- 3.3%
- Equity multiple
- 1.13×
- Total profit
- $3,786
- Equity at exit
- $15,656
- IRR
- 14.5%
- Equity multiple
- 2.27×
- Total profit
- $37,213
- Equity at exit
- $9,078
Cash invested: $29,400 (down + closing). Projections, not guarantees.
Landlord ↔ Tenant lean methodology
- Overall (STATE)
- 90 Strongly Landlord-Friendly
- State Georgia
- 90 Strongly Landlord-Friendly · R+3
- County
- — inherits STATE
- City
- — inherits STATE
ZIP-level market 31206
- Rents YoY
- 5.0%
- Active inventory
- 207
- Price-to-rent
- 7.5×
Monthly cashflow live
- Estimated rent
- $1,163 high interval (Pro) →
- Mortgage (P&I)
- −$551
- Tax from tax record
- −$35 /mo · $424/yr
- Insurance
- −$44
- HOA
- −$0
- Vacancy / Maint / Mgmt
- −$244
- Net cashflow
- $289
Break-even live
UW: 25.0% down · 7.5% · 30yr · 1.5% tax · 5.0% vac · 8.0% maint · 8.0% mgmt
Financing live
Cash to close
- Down payment
- $26,250
- Closing costs
- $3,150
- Reserves months
- —
- Total cash needed
- —
Loan-product check · same deal, 3 products live
Conventional
25% down · 7.5% · 30yr
- Down + closing
- —
- Monthly P&I
- —
- Monthly cashflow
- —
- DSCR
- —
- Eligible?
- —
Personal DTI + credit; lowest rate.
DSCR
20% down · 8.5% · 30yr
- Down + closing
- —
- Monthly P&I
- —
- Monthly cashflow
- —
- DSCR
- —
- Eligible?
- —
No personal income docs; deal must DSCR.
Hard money
10% down · 12.0% · 12mo
- Down + closing
- —
- Monthly P&I
- —
- Monthly cashflow
- —
- DSCR
- —
- Eligible?
- —
Short-term bridge; refi at stabilization.
Rent comps 35 comps
| Address | Beds | Baths | Sqft | Rent | $/sqft | DOM | Units | Dist |
|---|---|---|---|---|---|---|---|---|
| 1575 Winston Dr Macon, GA | 3.0 | 2.0 | 1215 | $1,350 | $1.11 | 21d | 1 | 0.08mi |
| 2445 Lowe St Macon, GA | 2.0 | 1.0 | 940 | $890 | $0.95 | 43d | 1 | 0.34mi |
| 3080 Rice Mill Rd Unit C-1 Macon, GA | 3.0 | 1.5 | 1100 | $925 | $0.84 | 21d | 1 | 0.39mi |
| 3080 Rice Mill Rd Macon, GA | 3.0 | 1.0 | 1100 | $950 | $0.86 | 43d | 1 | 0.39mi |
| 1868 Sussex Dr Macon, GA | 3.0 | 2.0 | 1450 | $1,500 | $1.03 | 43d | 1 | 0.53mi |
| 1089 Brisbane St Macon, GA | 3.0 | 1.0 | 816 | $1,075 | $1.32 | 13d | 1 | 0.61mi |
| 3149 Somerset Dr Macon, GA | 2.0 | 1.0 | 897 | $745 | $0.83 | 43d | 1 | 0.64mi |
| 3238 Somerset Dr Macon, GA | 3.0 | 1.0 | 1100 | $975 | $0.89 | 13d | 1 | 0.75mi |
| 728 Key St Macon, GA | 4.0 | 1.5 | 1210 | $1,200 | $0.99 | 21d | 1 | 0.78mi |
| 1164 Newberg Ave Macon, GA | 3.0 | 1.0 | 1100 | $1,195 | $1.09 | 43d | 1 | 0.79mi |
| 3685 Rice Mill Rd Macon, GA | 3.0 | 1.0 | 1152 | $1,450 | $1.26 | 43d | 1 | 0.88mi |
| 3837 Spencer Cir Macon, GA | 3.0 | 1.0 | 1080 | $1,300 | $1.20 | 43d | 1 | 0.89mi |
| 3778 Spencer Cir Macon, GA | 3.0 | 1.0 | 864 | $1,300 | $1.50 | 21d | 1 | 0.91mi |
| 1782 Eveline Ave Macon, GA | 3.0 | 1.0 | 900 | $1,050 | $1.17 | 43d | 1 | 0.94mi |
| 424 Pansy Ave Macon, GA | 2.0 | 1.0 | 810 | $850 | $1.05 | 43d | 1 | 1.05mi |
| 837 Newberg Ave Macon, GA | 3.0 | 1.0 | 966 | $750 | $0.78 | 43d | 1 | 1.09mi |
| 3823 Saint Charles Pl Macon, GA | 3.0 | 1.0 | 1020 | $1,150 | $1.13 | 43d | 1 | 1.09mi |
| 1835 Bethlea Ave Macon, GA | 2.0 | 1.0 | 800 | $900 | $1.12 | 43d | 1 | 1.14mi |
| 1596 Burton Ave Macon, GA | 3.0 | 1.0 | 1117 | $895 | $0.80 | 13d | 1 | 1.20mi |
| 806 Armory Dr Unit B Macon, GA | 3.0 | 1.0 | 1100 | $975 | $0.89 | 43d | 1 | 1.20mi |
| 1528 Wellworth Ave Macon, GA | 3.0 | 1.0 | 1126 | $1,000 | $0.89 | 21d | 1 | 1.23mi |
| 1148 N Beddingfield Dr Macon, GA | 3.0 | 1.0 | 1076 | $825 | $0.77 | 43d | 1 | 1.23mi |
| 1463 Bankston Ave Macon, GA | 2.0 | 1.0 | 960 | $950 | $0.99 | 43d | 1 | 1.28mi |
| 4028 Saint Charles Pl Macon, GA | 3.0 | 1.0 | 900 | $800 | $0.89 | 21d | 1 | 1.31mi |
| 645 Rutherford Ave Macon, GA | 4.0 | 2.0 | 1481 | $1,395 | $0.94 | 43d | 1 | 1.32mi |
| 1460 Brentwood Ave Macon, GA | 3.0 | 2.0 | 1148 | $1,250 | $1.09 | 21d | 1 | 1.34mi |
| 672 Bowden St Macon, GA | 2.0 | 1.0 | 1076 | $900 | $0.84 | 21d | 1 | 1.34mi |
| 3034 Churchill St Macon, GA | 2.0 | 1.0 | 872 | $900 | $1.03 | 21d | 1 | 1.40mi |
| 558 Cleveland St Macon, GA | 2.0 | 1.0 | 924 | $925 | $1.00 | 43d | 1 | 1.43mi |
| 1156 Triple Hill Dr Macon, GA | 2.0 | 1.0 | 980 | $875 | $0.89 | 13d | 1 | 1.44mi |
| 1289 Rocky Creek Rd Macon, GA | 2.0 | 1.0 | 1404 | $750 | $0.53 | 43d | 1 | 1.44mi |
| 771 Harold St Macon, GA | 2.0 | 1.0 | 950 | $1,250 | $1.32 | 13d | 1 | 1.45mi |
| 3423 Flamingo Dr Macon, GA | 3.0 | 1.0 | 1048 | $895 | $0.85 | 43d | 1 | 1.45mi |
| 846 Bedingfield Ave Macon, GA | 3.0 | 1.5 | 1187 | $975 | $0.82 | 43d | 1 | 1.48mi |
| 520 Nelson St Macon, GA | 3.0 | 1.0 | 1208 | $1,225 | $1.01 | 13d | 1 | 1.48mi |
Listing history 11 events
-
2026-06-19days on market $105,000 Active 12 DOM
-
2026-06-18days on market $105,000 Active 11 DOM
-
2026-06-17days on market $105,000 Active 10 DOM
-
2026-06-16days on market $105,000 Active 9 DOM
-
2026-06-15days on market $105,000 Active 8 DOM
-
2026-06-14days on market $105,000 Active 6 DOM
-
2026-06-13days on market $105,000 Active 5 DOM
-
2026-06-10days on market $105,000 Active 3 DOM
-
2026-06-09days on market $105,000 Active 2 DOM
-
2026-06-08remarks 699-char remark
-
2026-06-08$105,000 Active 1 DOM
ⓘ Source: listings_history table (triggers on properties + properties_extension) + one-shot
backfill from property_details.listing_events for pre-trigger history.
Tax reassessment forecast GA · Resets to sale price
- Current annual tax
- $424 · $35/mo
- Projected year-2 tax
- $966 · $80/mo
- Expected delta
- +$542/yr (+$45/mo · 128.0%)
ⓘ Screening estimate from a state-policy table — verify with the county assessor before closing.
Climate risk First Street
- Flood 1/10 Low FEMA zone X (unshaded) · 0% chance over 30 yrs
- Wildfire 2/10 Low
- Heat 7/10 Severe 7 d/yr ≥109°F today · 18 d/yr by 30 yrs out
- Wind 6/10 Major 66% chance of damaging wind over 30 yrs
- Air quality 3/10 Moderate 3 unhealthy d/yr today · 4 by 30 yrs out
Nearby sold comps map
Loading sold comps map…
Walkable amenities ~0.75 mi
Loading nearby amenities…
Taxation est. · year 1
- Rental income
- $13,958
- − Mortgage interest
- −$5,882
- − Property taxes
- −$424
- − Insurance
- −$525
- − Repairs & maintenance
- −$1,117
- − Management
- −$1,117
- − Depreciation
- −$3,055
- Taxable income
- $1,840
- Est. tax owed @ 24.0%
- −$441
- After-tax cash flow
- $3,029/yr
For passive investors: Depreciation is non-cash, so a rental often shows a tax loss while cash-flowing — sheltering income. Rental losses are passive: they offset passive income freely, and up to $25,000/yr can offset ordinary (W-2) income if you actively participate and your MAGI is under $100k (phasing out to $0 by $150k); unused losses carry forward. On sale, claimed depreciation is recaptured at up to 25%, and gains may owe capital-gains tax (a 1031 exchange can defer both). Figures are a year-1 estimate at your 24.0% rate — not tax advice; consult a CPA.
Schools (NCES district)
- District
- Bibb County
- NCES district ID
- 1300420
- Math proficiency
- 11% ▼ -14.00%
- Reading proficiency
- 18% ▼ -11.00%
- Median HH income
- $37,426
- Composite
- 12.13/100
- National rank
- #9654
- State rank
- #161 of 174 in GA
Livability — Macon-Bibb County
No livability data for this city. (Only ~50 U.S. cities are tracked.)
Census & demographics
- Census place
- Macon-Bibb County, GA
- County
- Bibb County · 164,332 people
- City population
- 143,186
- Metro
- Macon-Bibb County, GA
- Population (ZIP)
- 24,310
- Household income
- $30,042
- Rent vs Own
- Severe rent burden
- 1335.0
Population outlook (Bibb County) Hauer SSP2
- Today (2025)
- 148,772 people
- By 2030
- 145,904 · -1.9%
- By 2040
- 139,404 · -6.3%
- By 2050
- 131,603 · -11.5%
- By 2075
- 111,050 · -25.4%
- By 2100
- 83,346 · -44.0%
Race, ethnicity, and origin ACS 2023
- Neighborhood character
- Predominantly Black (76%)
- Race & ethnicity
- Black 76% White 12% Hispanic / Latino 8% Two or more races 4%
- Hispanic origin (detail)
- Mexican 5% Puerto Rican 1%
- Common ancestry
- Lithuanian 1% Italian 1%
- Foreign-born
- 4% · Canada
- Languages at home
- 91% English-only · Spanish 8%
Political lean MEDSL · Bibb
- 2024 margin
- Strong D (+22.4) · D 61.0% · R 38.5%
- 2008→2024 swing
- +4.4pp toward D · 2008: 18.0pp · 2024: 22.4pp
- All cycles
- 2024: D+22.4 2020: D+23.8 2016: D+20.2 2012: D+20.0 2008: D+18.0
Not yet ingested
- Civics
- —
Market trends
- HPI YoY
- ▼ -80.17%
- Current HPI
- 148.6765
- Rent YoY
- ▲ 5.03%
- Metro
- Macon-Bibb County, GA
- State GDP YoY
- ▲ 2.66%
- F500 in state
- 28
Industry mix (Fortune 500 HQ in GA)
| Industry | F500 HQs | Revenue |
|---|---|---|
| Paper / Packaging | 2 | $29B |
|
||
| Retail | 1 | $160B |
|
||
| Transportation / Logistics | 1 | $91B |
|
||
| Airlines | 1 | $62B |
|
||
| Consumer Goods | 1 | $47B |
|
||
| Utilities | 1 | $25B |
|
||
Price history
+0.0% since first listed2 events — show timeline
- 2026-06-07 Listed $105,000 FMLS
- 2026-06-07 Listed $105,000 GAMLS
Property tax history
+2.5%/yrLatest (2025): $424 · -1.6% YoY. Source: county tax records.
Cash-flow waterfall
monthlySold comps — $/sqft
last 12 mo · ≤1 miLoading sold comps…