 🏷️ Likely Rental
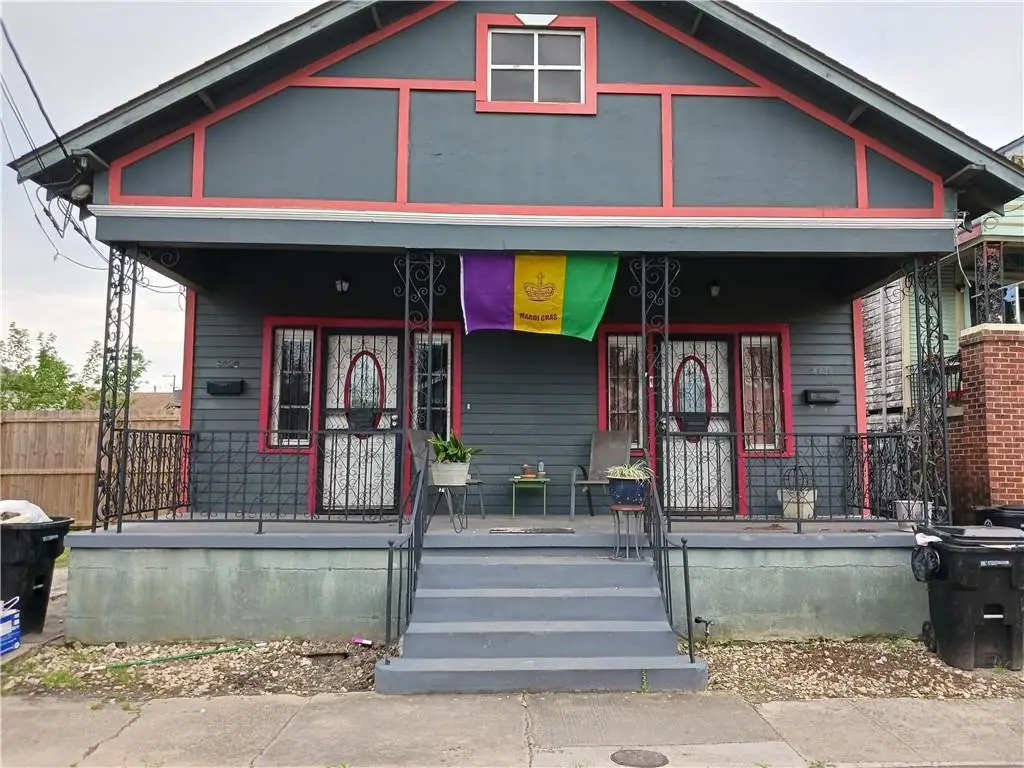
2458-2460 N Miro St · New Orleans, LA
Flood risk 8/10 · Major
- FEMA flood zone
- X (shaded)
- Chance of flooding over 30 yrs
- 0.76%
- Est. flood insurance / yr
- $507 – $1,088
Fire risk 1/10 · Minimal
- Est. fire insurance / yr
- $1,269 – $2,357
Heat risk 10/10 · Severe
- Hot days now (above 108°F)
- 7 days/yr
- Hot days in 30 yrs
- 22 days/yr
Wind risk 10/10 · Severe
- Chance of severe wind over 30 yrs
- 99.0%
Air-quality risk 4/10 · Minor
- Unhealthy air days now
- 4 days/yr
- Unhealthy air days in 30 yrs
- 4 days/yr
Risk factors via First Street. Map © Google.
Why this score? — see what drove the B grade
The composite is a weighted blend of 9 inputs, each scored 0–100. Each bar is that input's sub-score; the figure is the points it added to the 100-point composite (weight × sub-score).
- Cash flow +30.0/30.0
- ARV discount +15.0/15.0
- DSCR +10.0/10.0
- 1% rule +8.4/10.0
- Livability +4.0/5.0
- Rent growth +3.1/5.0
- Condition / age +2.5/5.0
- Schools +1.6/10.0
- Appreciation +0.0/10.0
$240,000
🖨 Deal sheet 📄 Offer letter ✓ Due diligence
Multi-family units
County records classify this as Multi-Family (2-4 Unit). Listing-text estimate: 2 units. confirmed
Listing remarks MLS
Popular St Roch Area. Easy Access To French Quarter, Metairie by Interstate 610. Bus Service also for area. Both units have front and back porch with inside washer/dryer hookups . Each unit has fenced backyard of its own and back doors . No carpet in any rooms with 11ft ceilings and ceiling fans. Central air and heat in both units. Each Unit has its own electric meter- no gas. Roof and decking was replaced 2020. All windows are double insulated . House has existing FHA loan so buyer looking for home of own plus income for help with payments this is the one . Both units are unoccupied . Property is Flood Zone X Being offered also for Lease $1600.00 per mth
Key facts
- Front and back porch
- Central air and heat
- Fenced backyard
Tags
Property features AI
Finance
- Financial info: Two-unit property (total of 2 units); Tenants pay electricity and gas; owner pays water
Exterior
- Utilities: Public water; Public sewer
- Home design: Single-story building; Raised foundation; Very good condition
- Construction: Frame construction with wood siding; Asphalt shingle roof
- Exterior features: Porch; Dock; City lot; Rectangular lot; Lot dimensions approximately 32 x 128
Interior
- Bedrooms: Two units, each with 3 bedrooms (Units 2458 and 2460)
- Bathrooms: Two full bathrooms total (one full bathroom in each unit)
- Heating & cooling: Central heating; Central air conditioning
- Interior features: Accessibility features
- Laundry & utility: In-unit laundry
Neighborhood map
What this means for you Summary
Snapshot
- This is a 2 × 3-bed/1.0-bath units multifamily listed at $240k.
Deal economics
- At list price, monthly cash flow is $833 ($10k/yr) — positive. Per door: $416/mo.
- The deal already cash-flows at list — no discount required.
- Meets the 1% rule at list price ($3k rent vs $240k).
- Cap rate 10.8% vs local median 4.4% in New Orleans — top-decile yield for the area; either an underpriced asset or a hidden risk that comps aren't pricing in. Stress-test before assuming the spread holds.
Location & tenants
- Location reads 81/100 on livability (#3 in LA, #1,383 nationally) — a professional / high-income tenant draw. Strengths: amenities A+, commute A+, health & safety A+; Watch: crime C-, employment D.
- Orleans Parish (urban): math 11% / reading 27% proficiency, ranked #69 of 98 in LA (top 70%) — low school quality limits family demand, transient renter base, plan for 1-2y turnover; 68% free/reduced lunch — lower-income household profile, screen leases tightly.
- Market conditions: Rents rising (+2.5%/yr); 581 active listings in the ZIP; 40 comparable units currently listed for rent nearby; rentals at typical pace (median 24d on market — plan ~3-4 weeks tenant-placement turnaround); 710 units permitted in Orleans Parish in 2024 (244 in 5+ unit buildings).
- At $3,217/mo this rent would consume 84% of the median local household income ($46k/yr) (locally 1988% of renters already pay >50% of income on rent) — very limited rent-growth headroom before tenants either downsize or default.
Forward outlook
- Local home prices are declining (-3.0%/yr); year-one equity from $2k of loan paydown is wiped out by about $7k of value loss. Plan a longer hold.
- Orleans County population projected at +61% by 2050 — long-run rental-demand tailwind backs the buy-and-hold thesis.
- At projected returns (-3.0% appreciation + 2.5% rent growth), your $67k cash investment doubles in ~9 years — after that, you're playing with house money.
Negotiation context
- Only 6 days on market — expect competitive offers; lowballing is unlikely to land.
- 15 sale attempts since 18y ago with the ask held roughly flat each time — persistent listings suggest the price (not the market) is what's stuck; bring a comps-based counter.
Risks & watch-outs
- Watch-outs: flood insurance adds $66/mo.
- Climate carrying-cost: severe flood risk; severe wind risk, 99% chance of damaging wind over 30y; extreme-heat days projected 7→22/yr by 2055 (HVAC capex compounding) — expect insurance premiums to compound above CPI over the hold.
Questions for the listing agent
- Can we see the unit-by-unit rent roll, current vacancy, and any below-market leases? What's the average tenancy length?
- What capital expenditures (roof, boiler, parking lot, exteriors) have been made in the last 5 years, and what's planned in the next 2?
- What's the actual annual flood-insurance premium (NFIP or private), and is the property in a SFHA with mandatory coverage?
- Is there a deadline driving the sale (1031 exchange, divorce, estate, relocation)? That informs how much negotiation room exists.
- What's the average days-on-market for RENTAL listings here right now (not sales)? A rising rental-DOM trend means longer vacancies and softer asking-rent achievability than the comps imply.
- What's the recent tenant-quality profile in this submarket — average credit score on applications, eviction rate, late-payment / NSF rate, and stable-employment percentage? A property-management company in the area should have these aggregated.
- How much new apartment / multifamily construction is in the pipeline within 1–3 miles? Heavy new supply (>2% of stock underway) typically softens rents 12–24 months out; light construction supports rent growth.
Investment metrics
- 1% rule
- 1.34% ✓
- Cap rate
- 10.79%
- Cash-on-cash
- 16.06%
- DSCR
- 1.71
- GRM
- 6.2
CMA / ARV
- ARV (on-the-fly)
- $300,144
- Comps found
- 12
Show comp detail 12 sales within ~0.75 mi
| Address | Dist | Beds/Ba | Sqft | Sold | Price | $/sf | Match |
|---|---|---|---|---|---|---|---|
| 1805 07 St Roch Ave | 0.27mi | 4/2.0 | 1,914 (-6%) | 1mo | $290,000 | $152 | 77 |
| 2517 N Miro St | 0.07mi | 4/2.0 | 1,857 (-8%) | 7mo | $50,000 | $27 | 77 |
| 1734 Spain St | 0.34mi | 5/3.0 (+1) | 1,985 (-2%) | 1mo | $100,000 | $50 | 71 |
| 2502 Music St | 0.23mi | 4/2.0 | 1,917 (-6%) | 19mo | $115,000 | $60 | 64 |
| 1438 40 St Roch Ave | 0.51mi | 4/3.0 | 2,057 (+1%) | 14mo | $290,000 | $141 | 59 |
| 2008 10 Frenchmen St | 0.49mi | 4/4.0 | 1,942 (-4%) | 6mo | $380,000 | $196 | 58 |
| 2437-2439 St Roch Ave | 0.23mi | 3/3.0 (-1) | 1,750 (-14%) | 11mo | $51,000 | $29 | 49 |
| 1827 29 Frenchmen St | 0.51mi | 5/3.0 (+1) | 2,160 (+6%) | 9mo | $360,000 | $167 | 49 |
| 2259-2261 N Derbigny St | 0.43mi | 3/2.0 (-1) | 1,848 (-9%) | 15mo | $340,000 | $184 | 47 |
| 2305-2307 Frenchmen St | 0.46mi | 4/2.0 | 1,750 (-14%) | 12mo | $144,000 | $82 | 46 |
| 3129 31 N Claiborne Ave | 0.75mi | 4/2.0 | 1,806 (-11%) | 3mo | $267,150 | $148 | 45 |
| 2408 10 Saint Anthony St | 0.70mi | 4/4.0 | 1,950 (-4%) | 10mo | $320,000 | $164 | 44 |
Match score weights: distance 35% · size 25% · config 20% · recency 20%. Top-matched comps best support the ARV.
Projected returns pro-forma
-3.0% appreciation · 2.49% rent growth · sell at horizon
- IRR
- 4.9%
- Equity multiple
- 1.19×
- Total profit
- $12,584
- Equity at exit
- $35,785
- IRR
- 13.9%
- Equity multiple
- 2.08×
- Total profit
- $72,903
- Equity at exit
- $20,751
Cash invested: $67,200 (down + closing). Projections, not guarantees.
Landlord ↔ Tenant lean methodology
- Overall (STATE)
- 90 Strongly Landlord-Friendly
- State Louisiana
- 90 Strongly Landlord-Friendly · R+12
- County
- — inherits STATE
- City
- — inherits STATE
ZIP-level market 70117
- Rents YoY
- 2.5%
- Active inventory
- 581
- Price-to-rent
- 12.4×
Monthly cashflow live
- Estimated rent
- $3,217 high interval (Pro) →
- Mortgage (P&I)
- −$1,259
- Tax from tax record
- −$284 /mo · $3,404/yr
- Insurance
- −$100
- Flood insurance flood zone
- −$66 /mo · $798/yr
- HOA
- −$0
- Vacancy / Maint / Mgmt
- −$676
- Net cashflow
- $833
Break-even live
2-unit breakdown (identical units grouped — click to expand)
| Units | Beds | Baths | Est. rent |
|---|---|---|---|
| 2× units | 3 | 1 | $3,218 |
| #1 | 3 | 1 | $1,609 |
| #2 | 3 | 1 | $1,609 |
| Total (2 units) | $3,217 | ||
UW: 25.0% down · 7.5% · 30yr · 1.5% tax · 5.0% vac · 8.0% maint · 8.0% mgmt
Financing live
Cash to close
- Down payment
- $60,000
- Closing costs
- $7,200
- Reserves months
- —
- Total cash needed
- —
Loan-product check · same deal, 3 products live
Conventional
25% down · 7.5% · 30yr
- Down + closing
- —
- Monthly P&I
- —
- Monthly cashflow
- —
- DSCR
- —
- Eligible?
- —
Personal DTI + credit; lowest rate.
DSCR
20% down · 8.5% · 30yr
- Down + closing
- —
- Monthly P&I
- —
- Monthly cashflow
- —
- DSCR
- —
- Eligible?
- —
No personal income docs; deal must DSCR.
Hard money
10% down · 12.0% · 12mo
- Down + closing
- —
- Monthly P&I
- —
- Monthly cashflow
- —
- DSCR
- —
- Eligible?
- —
Short-term bridge; refi at stabilization.
Rent comps 40 comps
| Address | Beds | Baths | Sqft | Rent | $/sqft | DOM | Units | Dist |
|---|---|---|---|---|---|---|---|---|
| 2228 Arts St New Orleans, LA | 3.0 | 2.0 | 2270 | $1,675 | $0.74 | 3d | 1 | 0.05mi |
| 2115 Mandeville St New Orleans, LA | 3.0 | 2.0 | 1400 | $1,650 | $1.18 | 23d | 1 | 0.24mi |
| 2107 Elysian Fields Ave New Orleans, LA | 4.0 | 2.0 | 1794 | $1,650 | $0.92 | 3d | 1 | 0.38mi |
| 1837 Touro St New Orleans, LA | 3.0 | 1.0 | 1994 | $2,000 | $1.00 | 23d | 1 | 0.58mi |
| 2920 Pauger St New Orleans, LA | 4.0 | 2.0 | 1882 | $1,995 | $1.06 | 23d | 1 | 0.64mi |
| 3228 Pauger St New Orleans, LA | 5.0 | 2.0 | 1600 | $2,100 | $1.31 | 23d | 1 | 0.68mi |
| 1938 N Johnson St Unit 38 New Orleans, LA | 3.0 | 2.0 | 1844 | $2,400 | $1.30 | 23d | 1 | 0.71mi |
| 1936 N Johnson St Unit 36 New Orleans, LA | 3.0 | 2.0 | 1844 | $2,400 | $1.30 | 23d | 1 | 0.71mi |
| 1839 Louisa St New Orleans, LA | 3.0 | 2.0 | 1500 | $2,095 | $1.40 | 16d | 1 | 0.74mi |
| 1835 Louisa St New Orleans, LA | 3.0 | 2.5 | 1800 | $2,350 | $1.31 | 3d | 1 | 0.75mi |
| 1231 Feliciana St New Orleans, LA | 3.0 | 2.5 | 1869 | $2,750 | $1.47 | 43d | 1 | 0.83mi |
| 2317 N Rampart St Unit 1272378P New Orleans, LA | 3.0–6.0 | 2.0–4.0 | 1581 | $4,154 | $2.63 | 3d | 2 | 0.88mi |
| 2320 N Rampart St New Orleans, LA | 3.0 | 3.0 | 2317 | $3,700 | $1.60 | 43d | 1 | 0.90mi |
| 1038 Montegut St New Orleans, LA | 3.0 | 2.5 | 2250 | $4,200 | $1.87 | 43d | 1 | 0.90mi |
| 1038 Montegut St New Orleans, LA | 3.0 | 2.5 | 2250 | $4,200 | $1.87 | 23d | 1 | 0.90mi |
| 2019 Gallier St New Orleans, LA | 4.0 | 2.0 | 1400 | $2,200 | $1.57 | 23d | 1 | 0.91mi |
| 5624-5626 Saint Claude ST New Orleans, LA | 4.0 | 3.0 | 1521 | $2,300 | $1.51 | 23d | 1 | 0.91mi |
| 1831 N Miro St New Orleans, LA | 3.0 | 2.0 | 1882 | $2,500 | $1.33 | 43d | 1 | 0.92mi |
| 1933 Industry St New Orleans, LA | 3.0 | 2.0 | 1400 | $1,595 | $1.14 | 16d | 1 | 0.93mi |
| 2739 Bay St Unit B New Orleans, LA | 4.0 | 2.0 | 1400 | $1,800 | $1.29 | 20d | 1 | 0.96mi |
| 1437 Gallier St New Orleans, LA | 3.0 | 2.0 | 1451 | $1,875 | $1.29 | 21d | 1 | 1.01mi |
| 3221 Saint Claude Ave New Orleans, LA | 3.0 | 1.0 | 1900 | $1,650 | $0.87 | 23d | 1 | 1.03mi |
| 2647 Myrtle St Unit 2647 New Orleans, LA | 4.0 | 2.0 | 1445 | $2,550 | $1.76 | 43d | 1 | 1.09mi |
| 1860 Burgundy St New Orleans, LA | 4.0 | 4.0 | 3000 | $3,500 | $1.17 | 23d | 1 | 1.11mi |
| 3134 Burgundy St New Orleans, LA | 3.0 | 2.0 | 1887 | $2,900 | $1.54 | 23d | 1 | 1.11mi |
| 1245 Kerlerec St New Orleans, LA | 3.0 | 2.0 | 1500 | $2,500 | $1.67 | 43d | 1 | 1.15mi |
| 1247 Kerlerec St New Orleans, LA | 3.0 | 2.0 | 1500 | $2,500 | $1.67 | 43d | 1 | 1.15mi |
| 1325 Pauline St New Orleans, LA | 3.0 | 2.0 | 1792 | $2,250 | $1.26 | 3d | 1 | 1.18mi |
| 1325 Pauline St New Orleans, LA | 3.0 | 2.0 | 1792 | $2,250 | $1.26 | 3d | 1 | 1.18mi |
| 928 Kerlerec St New Orleans, LA | 3.0 | 3.5 | 1684 | $2,750 | $1.63 | 3d | 1 | 1.18mi |
| 928 Kerlerec St New Orleans, LA | 3.0 | 3.5 | 1684 | $2,750 | $1.63 | 3d | 1 | 1.18mi |
| 3302 Metropolitan St New Orleans, LA | 4.0 | 2.5 | 1700 | $2,200 | $1.29 | 17d | 1 | 1.18mi |
| 1323 Pauline St New Orleans, LA | 3.0 | 2.0 | 1792 | $2,250 | $1.26 | 3d | 1 | 1.18mi |
| 1433 Esplanade Ave New Orleans, LA | 3.0 | 2.0 | 2411 | $5,000 | $2.07 | 2d | 1 | 1.25mi |
| 3907 Elysian Fields Ave New Orleans, LA | 3.0 | 2.0 | 1652 | $3,000 | $1.82 | 23d | 1 | 1.34mi |
| 639 Desire St New Orleans, LA | 3.0 | 2.5 | 2687 | $5,500 | $2.05 | 20d | 1 | 1.34mi |
| 1411 France St New Orleans, LA | 3.0 | 2.0 | 1525 | $2,000 | $1.31 | 23d | 1 | 1.37mi |
| 2331 Columbus St New Orleans, LA | 3.0 | 1.0 | 1976 | $1,850 | $0.94 | 23d | 1 | 1.40mi |
| 1403 Lesseps St New Orleans, LA | 3.0 | 3.0 | 1700 | $1,800 | $1.06 | 11d | 1 | 1.44mi |
| 1021 Henriette Delille St New Orleans, LA | 3.0 | 2.0 | 2012 | $2,250 | $1.12 | 17d | 1 | 1.45mi |
Listing history 6 events
-
2026-06-18days on market $240,000 Active 6 DOM
-
2026-06-17days on market $240,000 Active 5 DOM
-
2026-06-16days on market $240,000 Active 4 DOM
-
2026-06-15days on market $240,000 Active 3 DOM
-
2026-06-13remarks 672-char remark
-
2026-06-13$240,000 Active 1 DOM
ⓘ Source: listings_history table (triggers on properties + properties_extension) + one-shot
backfill from property_details.listing_events for pre-trigger history.
Tax reassessment forecast LA · Resets to sale price
- Current annual tax
- $3,404 · $284/mo
- Projected year-2 tax
- $3,404 · $284/mo
- Expected delta
- $0/yr ($0/mo · 0.0%)
ⓘ Screening estimate from a state-policy table — verify with the county assessor before closing.
Climate risk First Street
- Flood 8/10 Severe FEMA zone X (shaded) · 76% chance over 30 yrs
- Wildfire 1/10 Low
- Heat 10/10 Extreme 7 d/yr ≥108°F today · 22 d/yr by 30 yrs out
- Wind 10/10 Extreme 99% chance of damaging wind over 30 yrs
- Air quality 4/10 Moderate 4 unhealthy d/yr today · 4 by 30 yrs out
Nearby sold comps map
Loading sold comps map…
Walkable amenities ~0.75 mi
Loading nearby amenities…
Taxation est. · year 1
- Rental income
- $38,604
- − Mortgage interest
- −$13,444
- − Property taxes
- −$3,404
- − Insurance
- −$1,997
- − Repairs & maintenance
- −$3,088
- − Management
- −$3,088
- − Depreciation
- −$6,982
- Taxable income
- $6,601
- Est. tax owed @ 24.0%
- −$1,584
- After-tax cash flow
- $8,409/yr
For passive investors: Depreciation is non-cash, so a rental often shows a tax loss while cash-flowing — sheltering income. Rental losses are passive: they offset passive income freely, and up to $25,000/yr can offset ordinary (W-2) income if you actively participate and your MAGI is under $100k (phasing out to $0 by $150k); unused losses carry forward. On sale, claimed depreciation is recaptured at up to 25%, and gains may owe capital-gains tax (a 1031 exchange can defer both). Figures are a year-1 estimate at your 24.0% rate — not tax advice; consult a CPA.
Schools (NCES district)
- District
- Orleans Parish
- NCES district ID
- 2201170
- Math proficiency
- 11% ▼ -52.00%
- Reading proficiency
- 27% ▼ -46.00%
- Median HH income
- $37,011
- Composite
- 15.78/100
- National rank
- #9271
- State rank
- #69 of 98 in LA
Livability — New Orleans
- Score
- 81/100
- State rank
- #3
- US rank
- #1383
Category grades
Schools grade is shown separately in the Schools card above.
Census & demographics
- Census place
- New Orleans, LA
- County
- Orleans Parish · 338,817 people
- City population
- 338,817
- Metro
- New Orleans-Metairie, LA
- Population (ZIP)
- 25,652
- Household income
- $45,764
- Rent vs Own
- Severe rent burden
- 1988.0
Population outlook (Orleans County) Hauer SSP2
- Today (2025)
- 513,025 people
- By 2030
- 575,781 · +12.2%
- By 2040
- 700,174 · +36.5%
- By 2050
- 826,541 · +61.1%
- By 2075
- 1,123,374 · +119.0%
- By 2100
- 1,355,609 · +164.2%
Race, ethnicity, and origin ACS 2023
- Neighborhood character
- Majority Black (60%)
- Race & ethnicity
- Black 60% White 30% Two or more races 6% Hispanic / Latino 5%
- Common ancestry
- Lithuanian 5% Italian 1% Romanian 1%
- Foreign-born
- 5% · Canada, South Korea
- Languages at home
- 93% English-only · Spanish 3% Other Indo-European 1% French/Haitian/Cajun 1%
Political lean MEDSL · Orleans
- 2024 margin
- Solid D (+67.0) · D 82.2% · R 15.2% · Other 2.7%
- 2008→2024 swing
- +6.7pp toward D · 2008: 60.3pp · 2024: 67.0pp
- All cycles
- 2024: D+67.0 2020: D+68.2 2016: D+66.2 2012: D+62.5 2008: D+60.3
Not yet ingested
- Civics
- —
Market trends
- HPI YoY
- ▼ -177.22%
- Current HPI
- 184.6061
- Rent YoY
- ▲ 2.49%
- Metro
- New Orleans-Metairie, LA
- State GDP YoY
- ▲ 3.29%
- F500 in state
- 10
Industry mix (Fortune 500 HQ in LA)
| Industry | F500 HQs | Revenue |
|---|---|---|
| Telecommunications | 2 | $23B |
|
||
| Utilities | 1 | $12B |
|
||
| Wholesale / Distribution | 1 | $5B |
|
||
| Advertising | 1 | $2B |
|
||
Price history
+327.8% since first listed28 events — show timeline
- 2026-06-12 Listed $240,000 GSREIN
- 2026-06-12 Listed $240,000 AcadianaMLS
- 2025-03-08 Listed $270,000 AcadianaMLS
- 2023-04-06 Listed $310,000 AcadianaMLS
- 2022-02-24 Sold (Public Records) $250,000 Public Records
- 2021-12-02 Listed $250,000 AcadianaMLS
- 2021-03-23 Price Changed $259,000 GSREIN
- 2021-01-15 Listed $259,000 AcadianaMLS
- 2017-06-05 Sold (Public Records) $155,000 Public Records
- 2017-02-04 Listed $155,000 AcadianaMLS
- 2017-02-04 Listing Removed — GSREIN
- 2017-01-07 Price Changed $155,000 GSREIN
- 2016-12-07 Price Changed $158,000 GSREIN
- 2016-09-16 Price Changed $167,000 GSREIN
- 2016-08-11 Listed $163,000 GSREIN
- 2016-08-03 Listed $155,000 AcadianaMLS
- 2016-07-31 Listing Removed — GSREIN
- 2016-07-24 Price Changed $160,000 GSREIN
- 2016-02-01 Listed $170,000 GSREIN
- 2016-01-29 Listed $160,000 AcadianaMLS
- 2013-08-30 Listed $195,000 GSREIN
- 2013-08-30 Listed $195,000 AcadianaMLS
- 2009-04-03 Sold (Public Records) $170,000 Public Records
- 2008-05-05 Sold (Public Records) $60,000 Public Records
- 2008-04-25 Sold (MLS) $60,000 GSREIN
- 2008-02-28 Listed $60,000 AcadianaMLS
- 2008-02-28 Listed $60,000 GSREIN
- 1986-01-30 Sold (Public Records) $56,100 Public Records
Property tax history
+7.8%/yrLatest (2026): $3,404 · +1.1% YoY. Source: county tax records.
Cash-flow waterfall
monthlySold comps — $/sqft
last 12 mo · ≤1 miLoading sold comps…