 Triplex
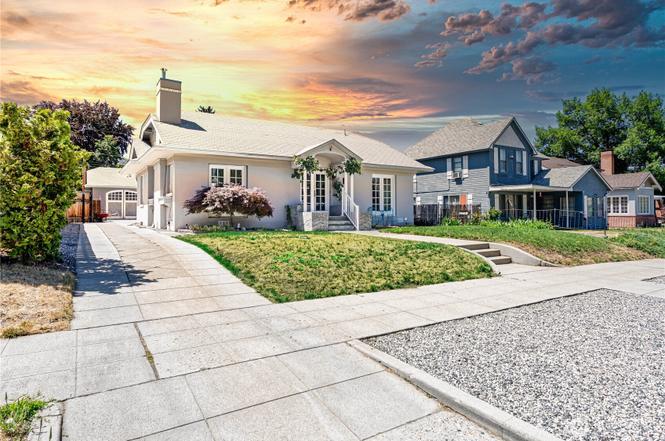
146 S Delaware Ave · Wenatchee, WA
Flood risk 1/10 · Minimal
- FEMA flood zone
- X (shaded)
- Chance of flooding over 30 yrs
- 0.0%
- Est. flood insurance / yr
- $473 – $860
Fire risk 7/10 · Major
- Est. fire insurance / yr
- $604 – $1,122
Heat risk 4/10 · Minor
- Hot days now (above 96°F)
- 7 days/yr
- Hot days in 30 yrs
- 13 days/yr
Wind risk 1/10 · Minimal
- Chance of severe wind over 30 yrs
- —
Air-quality risk 10/10 · Severe
- Unhealthy air days now
- 25 days/yr
- Unhealthy air days in 30 yrs
- 25 days/yr
Risk factors via First Street. Map © Google.
Why this score? — see what drove the D- grade
The composite is a weighted blend of 9 inputs, each scored 0–100. Each bar is that input's sub-score; the figure is the points it added to the 100-point composite (weight × sub-score).
- Cash flow +9.5/30.0
- ARV discount +7.5/15.0
- Schools +4.2/10.0
- Livability +3.6/5.0
- 1% rule +2.9/10.0
- DSCR +2.7/10.0
- Rent growth +2.7/5.0
- Condition / age +2.5/5.0
- Appreciation +0.0/10.0
$595,000
🖨 Deal sheet 📄 Offer letter ✓ Due diligence
Multi-family units
County records classify this as Multi-Family (2-4 Unit). Listing-text estimate: 3 units. confirmed
Listing remarks
Historic Downtown Wenatchee Triplex Across from Chase Park Located in Wenatchee’s Grandview Historic District, this charming 1922 triplex offers a rare opportunity to own an income property in a prime location. Situated directly across from Chase Park and just blocks from downtown restaurants, shops, and the riverfront, the setting is hard to beat. The property features three units: a 2 bed/1 bath main unit and two 1 bed/1 bath units, plus a detached garage for added income or storage. Each unit has been updated while preserving historic charm. Ideal for investors or owner-occupants looking to live in one unit and rent the others.
Key facts
- Updated units
- Chase park
- Income property
Tags
Neighborhood map
What this means for you Summary
Snapshot
- This is a 1×2bd/1.0ba + 2×1bd/1.0ba units multifamily listed at $595k.
Deal economics
- At list price, monthly cash flow is $-414 ($-5k/yr) — negative. Per door: $-138/mo.
- To cash-flow at today's rent, offer at most $535k (10.1% below list).
- To meet the 1% rule (rent ≥ 1% of price), the offer needs to be $468k (21.3% below list).
- Recommended offer: $468k (21.3% below list) — sets the bar for 1% rule.
- Cap rate 5.5% vs local median 2.9% in Wenatchee — top-decile yield for the area; either an underpriced asset or a hidden risk that comps aren't pricing in. Stress-test before assuming the spread holds.
Location & tenants
- Location reads 72/100 on livability (#211 in WA) — a middle-class / working-renter tenant base. Strengths: health & safety A+, housing A, amenities B; Watch: crime C-, commute F.
- Wenatchee School District (urban): math 38% / reading 54% proficiency, ranked #175 of 291 in WA (top 60%) — families likely to look elsewhere, expect single-tenant / working-renter base with shorter leases.
- Zoned schools: Washington Elementary School (494 students, 46% FRL); Wenatchee High School (2,076 students, 56% FRL) — zoned schools at 51% FRL track the district average.
- Market conditions: Rents flat; 326 active listings in the ZIP; solid renter incomes; 762 units permitted in Chelan County in 2024 (377 in 5+ unit buildings).
- At $4,681/mo this rent would consume 69% of the median local household income ($81k/yr) (locally 1278% of renters already pay >50% of income on rent) — very limited rent-growth headroom before tenants either downsize or default.
Forward outlook
- Local home prices are declining (-3.0%/yr); year-one equity from $4k of loan paydown is wiped out by about $18k of value loss. Plan a longer hold.
- Chelan County population projected at +13% by 2050 — modest demand growth; plan on rents tracking national, not racing it.
Negotiation context
- It's been on market 23 days — a 2% lower offer ($586k) is reasonable based on typical stale-listing flexibility.
- 8 sale attempts since 3y ago with the ask held roughly flat each time — persistent listings suggest the price (not the market) is what's stuck; bring a comps-based counter.
Risks & watch-outs
- Watch-outs: built in 1920 — expect roof / HVAC / electrical / plumbing capex.
- Climate carrying-cost: major wildfire risk — expect insurance premiums to compound above CPI over the hold.
Questions for the listing agent
- What do current leases actually rent for vs. the listed asking? Can we see a recent rent roll and the last 12 months of T-12 income?
- Can we see the unit-by-unit rent roll, current vacancy, and any below-market leases? What's the average tenancy length?
- What capital expenditures (roof, boiler, parking lot, exteriors) have been made in the last 5 years, and what's planned in the next 2?
- Built in 1920 — when were the roof, HVAC, electrical panel, plumbing, and water heater last replaced?
- Is there a deadline driving the sale (1031 exchange, divorce, estate, relocation)? That informs how much negotiation room exists.
- The area grade is low — what's the realistic commute time and amenity access for the typical tenant pool here? Any planned neighborhood developments (good or bad) we should know about?
- What's the average days-on-market for RENTAL listings here right now (not sales)? A rising rental-DOM trend means longer vacancies and softer asking-rent achievability than the comps imply.
- What's the recent tenant-quality profile in this submarket — average credit score on applications, eviction rate, late-payment / NSF rate, and stable-employment percentage? A property-management company in the area should have these aggregated.
- How much new apartment / multifamily construction is in the pipeline within 1–3 miles? Heavy new supply (>2% of stock underway) typically softens rents 12–24 months out; light construction supports rent growth.
Investment metrics
- 1% rule
- 0.79% ✗
- Cap rate
- 5.46%
- Cash-on-cash
- -2.98%
- DSCR
- 0.87
- GRM
- 10.6
CMA / ARV
No comps found within radius.
Projected returns pro-forma
-3.0% appreciation · 0.75% rent growth · sell at horizon
- IRR
- -23.8%
- Equity multiple
- 0.20×
- Total profit
- $-133,073
- Equity at exit
- $88,716
- IRR
- -26.5%
- Equity multiple
- -0.14×
- Total profit
- $-190,192
- Equity at exit
- $51,445
Cash invested: $166,600 (down + closing). Projections, not guarantees.
Landlord ↔ Tenant lean methodology
- Overall (STATE)
- 28 Tenant-Leaning
- State Washington
- 28 Tenant-Leaning · D+8
- County
- — inherits STATE
- City
- — inherits STATE
ZIP-level market 98801
- Rents YoY
- 0.8%
- Active inventory
- 326
- Price-to-rent
- 29.9×
Monthly cashflow live
- Estimated rent
- $4,681 high interval (Pro) →
- Mortgage (P&I)
- −$3,120
- Tax est. 1.5%
- −$744 /mo · $8,925/yr
- Insurance
- −$248
- HOA
- −$0
- Vacancy / Maint / Mgmt
- −$983
- Net cashflow
- $-414
Break-even live
3-unit breakdown (identical units grouped — click to expand)
| Units | Beds | Baths | Est. rent |
|---|---|---|---|
| 1× unit | 2 | 1 | $1,659 |
| 2× units | 1 | 1 | $3,022 |
| #2 | 1 | 1 | $1,511 |
| #3 | 1 | 1 | $1,511 |
| Total (3 units) | $4,681 | ||
UW: 25.0% down · 7.5% · 30yr · 1.5% tax · 5.0% vac · 8.0% maint · 8.0% mgmt
Financing live
Cash to close
- Down payment
- $148,750
- Closing costs
- $17,850
- Reserves months
- —
- Total cash needed
- —
Loan-product check · same deal, 3 products live
Conventional
25% down · 7.5% · 30yr
- Down + closing
- —
- Monthly P&I
- —
- Monthly cashflow
- —
- DSCR
- —
- Eligible?
- —
Personal DTI + credit; lowest rate.
DSCR
20% down · 8.5% · 30yr
- Down + closing
- —
- Monthly P&I
- —
- Monthly cashflow
- —
- DSCR
- —
- Eligible?
- —
No personal income docs; deal must DSCR.
Hard money
10% down · 12.0% · 12mo
- Down + closing
- —
- Monthly P&I
- —
- Monthly cashflow
- —
- DSCR
- —
- Eligible?
- —
Short-term bridge; refi at stabilization.
Listing history 15 events
-
2026-04-23status Pending
-
2026-04-17status Active
-
2026-02-21status Pending
-
2026-02-21status Active
-
2026-02-20status Pending
-
2026-02-03$595,000 Active
-
2023-11-27soldstatus $560,000 Closed
-
2023-10-21status Pending
-
2023-10-21status Pending
-
2023-10-20status Active
-
2023-10-20status Active
-
2023-08-24status Active
-
2023-08-18status Pending
-
2023-08-14$549,000 Active
-
2023-08-14Active
ⓘ Source: listings_history table (triggers on properties + properties_extension) + one-shot
backfill from property_details.listing_events for pre-trigger history.
Climate risk First Street
- Flood 1/10 Low FEMA zone X (shaded) · 0% chance over 30 yrs
- Wildfire 7/10 Severe
- Heat 4/10 Moderate 7 d/yr ≥96°F today · 13 d/yr by 30 yrs out
- Wind 1/10 Low
- Air quality 10/10 Extreme 25 unhealthy d/yr today · 25 by 30 yrs out
Nearby sold comps map
Loading sold comps map…
Walkable amenities ~0.75 mi
Loading nearby amenities…
Taxation est. · year 1
- Rental income
- $56,172
- − Mortgage interest
- −$33,329
- − Property taxes
- −$8,925
- − Insurance
- −$2,975
- − Repairs & maintenance
- −$4,494
- − Management
- −$4,494
- − Depreciation
- −$17,309
- Taxable loss
- −$15,354
- Est. tax savings @ 24.0%
- +$3,685
- After-tax cash flow
- $-1,282/yr
For passive investors: Depreciation is non-cash, so a rental often shows a tax loss while cash-flowing — sheltering income. Rental losses are passive: they offset passive income freely, and up to $25,000/yr can offset ordinary (W-2) income if you actively participate and your MAGI is under $100k (phasing out to $0 by $150k); unused losses carry forward. On sale, claimed depreciation is recaptured at up to 25%, and gains may owe capital-gains tax (a 1031 exchange can defer both). Figures are a year-1 estimate at your 24.0% rate — not tax advice; consult a CPA.
Schools (NCES district)
- District
- Wenatchee School District
- NCES district ID
- 5309660
- Math proficiency
- 38% ▲ 1.00%
- Reading proficiency
- 54% ▲ 2.00%
- Median HH income
- $51,059
- Composite
- 41.72/100
- National rank
- #7189
- State rank
- #175 of 291 in WA
Livability — Wenatchee
- Score
- 72/100
- State rank
- #211
- US rank
- #6003
Category grades
Schools grade is shown separately in the Schools card above.
Census & demographics
- Census place
- Wenatchee, WA
- County
- Chelan County · 53,031 people
- City population
- 45,426
- Metro
- Wenatchee, WA
- Population (ZIP)
- 45,426
- Household income
- $81,488
- Rent vs Own
- Severe rent burden
- 1278.0
Population outlook (Chelan County) Hauer SSP2
- Today (2025)
- 81,630 people
- By 2030
- 84,312 · +3.3%
- By 2040
- 88,619 · +8.6%
- By 2050
- 91,915 · +12.6%
- By 2075
- 99,409 · +21.8%
- By 2100
- 100,032 · +22.5%
Race, ethnicity, and origin ACS 2023
- Neighborhood character
- Majority White (61%)
- Race & ethnicity
- White 61% Hispanic / Latino 33% Two or more races 14% Native American 2%
- Hispanic origin (detail)
- Mexican 28%
- Common ancestry
- Portuguese 4% Italian 3% Slovak 3%
- Foreign-born
- 14% · Canada, Dominican Republic
- Languages at home
- 72% English-only · Spanish 27%
Political lean MEDSL · Chelan
- 2024 margin
- Lean R (+9.5) · D 43.9% · R 53.4% · Other 2.7%
- 2008→2024 swing
- +2.5pp toward D · 2008: -12.0pp · 2024: -9.5pp
- All cycles
- 2024: R+9.5 2020: R+7.8 2016: R+15.7 2012: R+16.9 2008: R+12.0
Not yet ingested
- Civics
- —
Market trends
- HPI YoY
- ▼ -569.39%
- Current HPI
- 227.1555
- Rent YoY
- ▲ 0.75%
- Metro
- Wenatchee, WA
- State GDP YoY
- ▲ 4.65%
- F500 in state
- 22
Industry mix (Fortune 500 HQ in WA)
| Industry | F500 HQs | Revenue |
|---|---|---|
| Retail | 2 | $269B |
|
||
| Technology / Retail | 1 | $638B |
|
||
| Technology | 1 | $245B |
|
||
| Telecommunications | 1 | $38B |
|
||
| Food / Beverage | 1 | $36B |
|
||
| Automotive / Trucks | 1 | $34B |
|
||
Price history
+8.4% since first listed15 events — show timeline
- 2026-04-23 Pending — NWMLS as Distributed by MLS Grid
- 2026-04-17 Relisted — NWMLS as Distributed by MLS Grid
- 2026-02-21 Pending — NWMLS as Distributed by MLS Grid
- 2026-02-21 Relisted — NWMLS as Distributed by MLS Grid
- 2026-02-20 Pending — NWMLS as Distributed by MLS Grid
- 2026-02-03 Listed $595,000 NWMLS as Distributed by MLS Grid
- 2023-11-27 Sold (MLS) $560,000 NWMLS as Distributed by MLS Grid
- 2023-10-21 Pending — NWMLS as Distributed by MLS Grid
- 2023-10-21 Pending — NWMLS as Distributed by MLS Grid
- 2023-10-20 Relisted — NWMLS as Distributed by MLS Grid
- 2023-10-20 Relisted — NWMLS as Distributed by MLS Grid
- 2023-08-24 Relisted — NWMLS as Distributed by MLS Grid
- 2023-08-18 Pending — NWMLS as Distributed by MLS Grid
- 2023-08-14 Listed — NWMLS as Distributed by MLS Grid
- 2023-08-14 Listed $549,000 NWMLS as Distributed by MLS Grid
Cash-flow waterfall
monthlySold comps — $/sqft
last 12 mo · ≤1 miLoading sold comps…