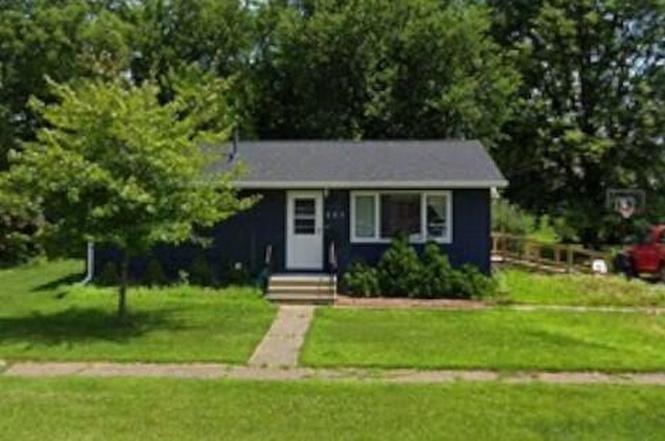
225 SW 3rd St · Ogden, IA
Flood risk 1/10 · Minimal
- FEMA flood zone
- X (unshaded)
- Chance of flooding over 30 yrs
- 0.0%
- Est. flood insurance / yr
- $473 – $860
Fire risk 1/10 · Minimal
- Est. fire insurance / yr
- $902 – $1,676
Heat risk 3/10 · Minor
- Hot days now (above 103°F)
- 7 days/yr
- Hot days in 30 yrs
- 15 days/yr
Wind risk 2/10 · Minimal
- Chance of severe wind over 30 yrs
- —
Air-quality risk 1/10 · Minimal
- Unhealthy air days now
- 0 days/yr
- Unhealthy air days in 30 yrs
- 0 days/yr
Risk factors via First Street. Map © Google.
Why this score? — see what drove the C+ grade
The composite is a weighted blend of 9 inputs, each scored 0–100. Each bar is that input's sub-score; the figure is the points it added to the 100-point composite (weight × sub-score).
- Cash flow +14.6/30.0
- ARV discount +13.2/15.0
- Appreciation +10.0/10.0
- Schools +6.5/10.0
- DSCR +4.5/10.0
- 1% rule +4.1/10.0
- Livability +4.0/5.0
- Rent growth +2.5/5.0
- Condition / age +2.5/5.0
$110,000
🖨 Deal sheet 📄 Offer letter ✓ Due diligence
Listing remarks MLS
Well maintained 3 bedroom / 2 bath ranch home! New roof, siding, gutters, interior paint, and electrical box! Air ducts have been cleaned out as an added bonus. Original hardwood floors. Kitchen is light and airy and does have space and hook-up for main floor laundry. Dry basement with lots of space to finish into more living space. Walking distance to library, post office, bank, downtown area and the new Fareway. Don't miss your chance.
Key facts
- 8,770 sq ft lot
- Built 1959
Property features AI
Exterior
- Security: Smoke detector(s)
- Utilities: Public water; Public sewer
- Home design: Single-story; Asphalt shingle roof
- Construction: Block foundation
- Exterior features: Smoke detector(s)
Interior
- Kitchen: Eat-in kitchen
- Bedrooms: 3 main-level bedrooms
- Flooring: Carpet; Tile
- Bathrooms: 1 full bathroom; 1 half bathroom
- Heating & cooling: Forced air heating (gas); Central air conditioning
- Interior features: Eat-in kitchen; Window treatments
Neighborhood map
What this means for you Summary
Snapshot
- This is a 3-bed/1.5-bath single-family listed at $110k.
Deal economics
- At list price, monthly cash flow is $27 ($326/yr) — positive.
- The deal already cash-flows at list — no discount required.
- To meet the 1% rule (rent ≥ 1% of price), the offer needs to be $100k (8.9% below list).
- Recommended offer: $100k (8.9% below list) — sets the bar for 1% rule.
- Cap rate 6.6% vs local median 2.8% in Ogden — top-decile yield for the area; either an underpriced asset or a hidden risk that comps aren't pricing in. Stress-test before assuming the spread holds.
Location & tenants
- Location reads 81/100 on livability (#70 in IA, #1,530 nationally) — a professional / high-income tenant draw. Strengths: schools A+, crime A+, cost of living A+; Watch: employment D, amenities F, commute F.
- Ogden Community School District (rural): math 74% / reading 77% proficiency, ranked #61 of 289 in IA (top 21%) — strong family-tenant draw, lease renewals of 3-5y typical; only 20% free/reduced lunch — higher-income household profile.
- Market conditions: 31 active listings in the ZIP; 80 units permitted in Boone County in 2024 (16 in 5+ unit buildings).
Forward outlook
- In year one you build about $12k of equity ($761 loan paydown + $11k appreciation (10.0% local appreciation)).
- At projected returns (10.0% appreciation + 3.0% rent growth), your $31k cash investment doubles in ~3 years — after that, you're playing with house money.
- By year 4, paydown + projected appreciation supports a ~$42k cash-out refi (75% LTV) — recoverable capital for the next deal without selling this one.
Negotiation context
- Only 1 days on market — expect competitive offers; lowballing is unlikely to land.
- 5 sale attempts since 14y ago with the ask held roughly flat each time — persistent listings suggest the price (not the market) is what's stuck; bring a comps-based counter.
Risks & watch-outs
- Watch-outs: built in 1959 — expect roof / HVAC / electrical / plumbing capex.
Questions for the listing agent
- Built in 1959 — when were the roof, HVAC, electrical panel, plumbing, and water heater last replaced?
- Is there a deadline driving the sale (1031 exchange, divorce, estate, relocation)? That informs how much negotiation room exists.
- Schools are A-rated — typically a magnet for longer-tenancy family renters. What's the average tenant stay here, and is there a school-zone premium baked into asking?
- What's the average days-on-market for RENTAL listings here right now (not sales)? A rising rental-DOM trend means longer vacancies and softer asking-rent achievability than the comps imply.
- What's the recent tenant-quality profile in this submarket — average credit score on applications, eviction rate, late-payment / NSF rate, and stable-employment percentage? A property-management company in the area should have these aggregated.
- How much new for-sale + rental construction is in the pipeline within 1–3 miles? Heavy new supply typically softens prices + rents 12–24 months out; constrained supply supports both.
Investment metrics
- 1% rule
- 0.91% ✗
- Cap rate
- 6.59%
- Cash-on-cash
- 1.06%
- DSCR
- 1.05
- GRM
- 9.1
CMA / ARV
- ARV (on-the-fly)
- $125,800
- Comps found
- 10
Show comp detail 10 sales within ~0.75 mi
| Address | Dist | Beds/Ba | Sqft | Sold | Price | $/sf | Match |
|---|---|---|---|---|---|---|---|
| 256 S 1st St | 0.12mi | 3/1.0 | 925 (0%) | 7mo | $163,000 | $176 | 86 |
| 208 SW 4th St | 0.10mi | 2/2.0 (-1) | 980 (+6%) | 4mo | $132,500 | $135 | 75 |
| 305 E Walnut St | 0.32mi | 3/2.0 | 972 (+5%) | 3mo | $10,000 | $10 | 72 |
| 213 SW 4th St | 0.07mi | 2/1.0 (-1) | 1,016 (+10%) | 14mo | $85,000 | $84 | 61 |
| 205 NE 4th St | 0.40mi | 3/2.0 | 1,025 (+11%) | 0mo | $235,000 | $229 | 61 |
| 314 N 1st St | 0.32mi | 2/1.0 (-1) | 890 (-4%) | 14mo | $101,000 | $113 | 60 |
| 325 SW 3rd St | 0.14mi | 2/1.0 (-1) | 886 (-4%) | 23mo | $80,100 | $90 | 60 |
| 243 S 1st St | 0.14mi | 2/1.0 (-1) | 856 (-8%) | 20mo | $116,000 | $136 | 58 |
| 319 SW 7th St Pl St | 0.35mi | 2/2.0 (-1) | 1,040 (+12%) | 8mo | $200,000 | $192 | 49 |
| 420 NW 5th St | 0.41mi | 3/1.0 | 1,053 (+14%) | 11mo | $162,000 | $154 | 47 |
Match score weights: distance 35% · size 25% · config 20% · recency 20%. Top-matched comps best support the ARV.
Projected returns pro-forma
10.0% appreciation · 3.0% rent growth · sell at horizon
- IRR
- 25.0%
- Equity multiple
- 3.00×
- Total profit
- $61,658
- Equity at exit
- $99,097
- IRR
- 22.1%
- Equity multiple
- 6.85×
- Total profit
- $180,247
- Equity at exit
- $213,706
Cash invested: $30,800 (down + closing). Projections, not guarantees.
Landlord ↔ Tenant lean methodology
- Overall (STATE)
- 83 Strongly Landlord-Friendly
- State Iowa
- 83 Strongly Landlord-Friendly · R+6
- County
- — inherits STATE
- City
- — inherits STATE
ZIP-level market 50212
- Home prices YoY
- 5.1%
- Active inventory
- 31
- Price-to-rent
- 9.1×
Monthly cashflow live
- Estimated rent
- $1,002 medium interval (Pro) →
- Mortgage (P&I)
- −$577
- Tax from tax record
- −$142 /mo · $1,702/yr
- Insurance
- −$46
- HOA
- −$0
- Vacancy / Maint / Mgmt
- −$210
- Net cashflow
- $27
Break-even live
UW: 25.0% down · 7.5% · 30yr · 1.5% tax · 5.0% vac · 8.0% maint · 8.0% mgmt
Financing live
Cash to close
- Down payment
- $27,500
- Closing costs
- $3,300
- Reserves months
- —
- Total cash needed
- —
Loan-product check · same deal, 3 products live
Conventional
25% down · 7.5% · 30yr
- Down + closing
- —
- Monthly P&I
- —
- Monthly cashflow
- —
- DSCR
- —
- Eligible?
- —
Personal DTI + credit; lowest rate.
DSCR
20% down · 8.5% · 30yr
- Down + closing
- —
- Monthly P&I
- —
- Monthly cashflow
- —
- DSCR
- —
- Eligible?
- —
No personal income docs; deal must DSCR.
Hard money
10% down · 12.0% · 12mo
- Down + closing
- —
- Monthly P&I
- —
- Monthly cashflow
- —
- DSCR
- —
- Eligible?
- —
Short-term bridge; refi at stabilization.
Listing history 1 events
-
2026-06-17$110,000 Pending 1 DOM
ⓘ Source: listings_history table (triggers on properties + properties_extension) + one-shot
backfill from property_details.listing_events for pre-trigger history.
Tax reassessment forecast IA · Partial reset (capped growth)
- Current annual tax
- $1,702 · $142/mo
- Projected year-2 tax
- $1,714 · $143/mo
- Expected delta
- +$12/yr (+$1/mo · 0.7%)
ⓘ Screening estimate from a state-policy table — verify with the county assessor before closing.
Climate risk First Street
- Flood 1/10 Low FEMA zone X (unshaded) · 0% chance over 30 yrs
- Wildfire 1/10 Low
- Heat 3/10 Moderate 7 d/yr ≥103°F today · 15 d/yr by 30 yrs out
- Wind 2/10 Low
- Air quality 1/10 Low 0 unhealthy d/yr today · 0 by 30 yrs out
Nearby sold comps map
Loading sold comps map…
Walkable amenities ~0.75 mi
Loading nearby amenities…
Taxation est. · year 1
- Rental income
- $12,026
- − Mortgage interest
- −$6,162
- − Property taxes
- −$1,702
- − Insurance
- −$550
- − Repairs & maintenance
- −$962
- − Management
- −$962
- − Depreciation
- −$3,200
- Taxable loss
- −$1,512
- Est. tax savings @ 24.0%
- +$363
- After-tax cash flow
- $689/yr
For passive investors: Depreciation is non-cash, so a rental often shows a tax loss while cash-flowing — sheltering income. Rental losses are passive: they offset passive income freely, and up to $25,000/yr can offset ordinary (W-2) income if you actively participate and your MAGI is under $100k (phasing out to $0 by $150k); unused losses carry forward. On sale, claimed depreciation is recaptured at up to 25%, and gains may owe capital-gains tax (a 1031 exchange can defer both). Figures are a year-1 estimate at your 24.0% rate — not tax advice; consult a CPA.
Schools (NCES district)
- District
- Ogden Community School District
- NCES district ID
- 1921660
- Math proficiency
- 74% ▼ -9.00%
- Reading proficiency
- 77% ▼ -7.00%
- Median HH income
- $56,714
- Composite
- 64.56/100
- National rank
- #536
- State rank
- #61 of 289 in IA
Livability — Ogden
- Score
- 81/100
- State rank
- #70
- US rank
- #1530
Category grades
Schools grade is shown separately in the Schools card above.
Census & demographics
- Census place
- Ogden, IA
- Population (ZIP)
- 3,109
Population outlook (Boone County) Hauer SSP2
- Today (2025)
- 27,674 people
- By 2030
- 28,058 · +1.4%
- By 2040
- 28,474 · +2.9%
- By 2050
- 28,383 · +2.6%
- By 2075
- 27,647 · -0.1%
- By 2100
- 25,485 · -7.9%
Race, ethnicity, and origin ACS 2023
- Neighborhood character
- Predominantly White (98%)
- Race & ethnicity
- White 98% Two or more races 1%
- Common ancestry
- Iranian 6% Portuguese 6% Italian 2%
- Foreign-born
- 1%
Political lean MEDSL · Boone
- 2024 margin
- Strong R (+21.5) · D 38.4% · R 59.9% · Other 1.6%
- 2008→2024 swing
- -29.2pp toward R · 2008: 7.6pp · 2024: -21.5pp
- All cycles
- 2024: R+21.5 2020: R+15.6 2016: R+13.9 2012: D+6.4 2008: D+7.6
Not yet ingested
- Civics
- —
Market trends
- HPI YoY
- ▲ 12.76%
- Current HPI
- 263.0
- Rent YoY
- —
- Metro
- —
- State GDP YoY
- ▲ 2.48%
- F500 in state
- 4
Industry mix (Fortune 500 HQ in IA)
| Industry | F500 HQs | Revenue |
|---|---|---|
| Financial Services | 1 | $16B |
|
||
| Retail / Convenience | 1 | $15B |
|
||
Price history
+83.3% since first listed13 events — show timeline
- 2026-06-17 Pending — CIBOR
- 2026-06-17 Pending — DMMLS
- 2026-06-17 Listed $110,000 CIBOR
- 2026-06-16 Listed $110,000 DMMLS
- 2022-10-10 Sold (Public Records) $120,000 Public Records
- 2022-10-10 Sold (MLS) $120,000 CIBOR
- 2022-10-10 Sold (MLS) $120,000 DMMLS
- 2022-09-22 Pending — DMMLS
- 2022-09-18 Listed $125,000 DMMLS
- 2022-09-10 Listed $125,000 CIBOR
- 2015-01-20 Sold (Public Records) $35,500 Public Records
- 2012-10-18 Listed $40,000 CIBOR
- 2009-11-17 Sold (Public Records) $60,000 Public Records
Property tax history
+1.2%/yrLatest (2025): $1,702 · +0.5% YoY. Source: county tax records.
Cash-flow waterfall
monthlySold comps — $/sqft
last 12 mo · ≤1 miLoading sold comps…