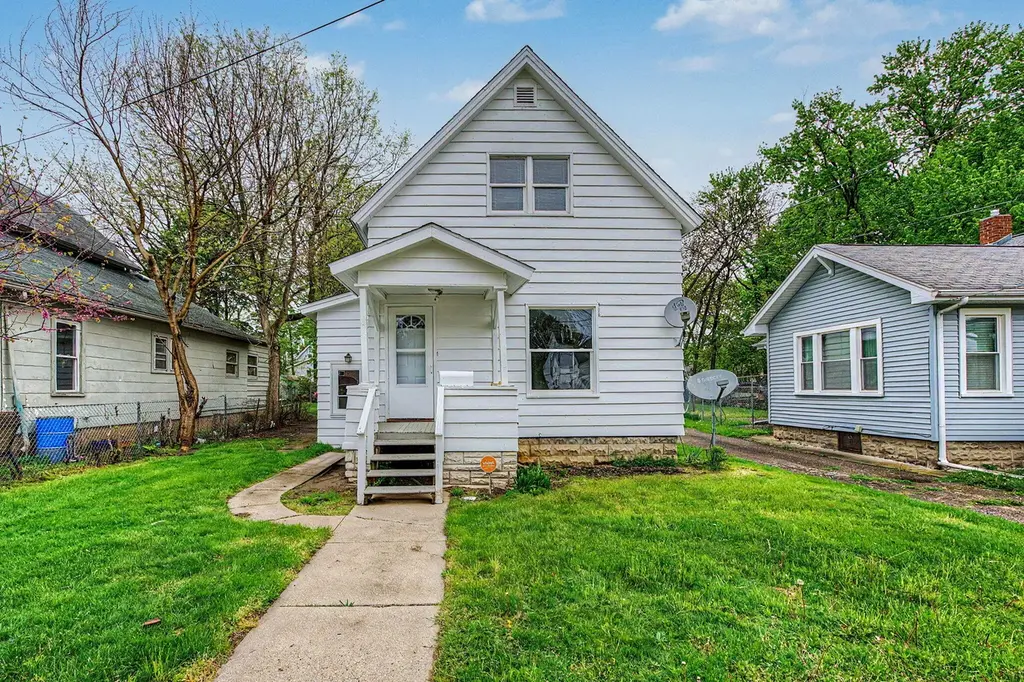
160 Goguac St W · Battle Creek, MI
Flood risk 1/10 · Minimal
- FEMA flood zone
- X (unshaded)
- Chance of flooding over 30 yrs
- 0.0%
- Est. flood insurance / yr
- $473 – $860
Fire risk 1/10 · Minimal
- Est. fire insurance / yr
- $784 – $1,456
Heat risk 3/10 · Minor
- Hot days now (above 97°F)
- 7 days/yr
- Hot days in 30 yrs
- 16 days/yr
Wind risk 2/10 · Minimal
- Chance of severe wind over 30 yrs
- —
Air-quality risk 3/10 · Minor
- Unhealthy air days now
- 2 days/yr
- Unhealthy air days in 30 yrs
- 3 days/yr
Risk factors via First Street. Map © Google.
Why this score? — see what drove the C- grade
The composite is a weighted blend of 9 inputs, each scored 0–100. Each bar is that input's sub-score; the figure is the points it added to the 100-point composite (weight × sub-score).
- Cash flow +23.7/30.0
- DSCR +7.6/10.0
- ARV discount +5.5/15.0
- 1% rule +5.4/10.0
- Rent growth +5.0/5.0
- Livability +3.7/5.0
- Condition / age +2.5/5.0
- Schools +1.1/10.0
- Appreciation +0.0/10.0
$129,000
🖨 Deal sheet 📄 Offer letter ✓ Due diligence
Listing remarks MLS
This inviting 3-bedroom home blends character and practicality with a main-floor primary suite featuring a private 3/4 bath. Enjoy a generously sized kitchen ideal for everyday living. Rich wood flooring adds warmth and character throughout the living and dining rooms, creating an inviting space to relax and enjoy. Upstairs are two good sized bedrooms and another full bath. The home benefits from replacement windows and updated electrical, providing meaningful improvements and added appeal for buyers looking for a move-in-ready opportunity.
Key facts
- Updated electrical
- Rich wood flooring
- Private 3/4 bath
Tags
Property features AI
Exterior
- Utilities: Public water; Paved road access
- Home design: Traditional style single-family residence; Built in 1920; Public water
- Construction: Wood siding; Shingle roof; Full basement
- Exterior features: Sidewalk
Interior
- Kitchen: Oven; Range; Refrigerator
- Bedrooms: Primary bedroom; Bedroom 2; Bedroom 3
- Bathrooms: 2 full bathrooms; Primary bathroom
- Heating & cooling: Forced air heating
- Interior features: Replacement windows; 6 total rooms; Full Michigan-style basement
Neighborhood map
What this means for you Summary
Snapshot
- This is a 3-bed/1.5-bath single-family listed at $129k.
Deal economics
- At list price, monthly cash flow is $245 ($3k/yr) — positive.
- The deal already cash-flows at list — no discount required.
- Meets the 1% rule at list price ($1k rent vs $129k).
- Recommended offer: $127k (1.5% below list) — sets the bar for market timing.
- Cap rate 8.6% vs local median 5.2% in Battle Creek — top-decile yield for the area; either an underpriced asset or a hidden risk that comps aren't pricing in. Stress-test before assuming the spread holds.
Location & tenants
- Location reads 73/100 on livability (#198 in MI) — a middle-class / working-renter tenant base. Strengths: cost of living A+, housing A+, health & safety A+; Watch: schools C-, amenities C-, crime F.
- Battle Creek Public Schools (urban): math 8% / reading 19% proficiency, ranked #510 of 540 in MI (top 94%) — low school quality limits family demand, transient renter base, plan for 1-2y turnover; 75% free/reduced lunch — lower-income household profile, screen leases tightly.
- Market conditions: Rents rising fast (+11.1%/yr); 165 active listings in the ZIP; 3 comparable units currently listed for rent nearby; rentals lingering (median 44d on market — plan ~5-8 weeks vacancy on turnover, expect pricing pressure); 100% of comp listings sitting > 30 days — soft ceiling on asking rent; 132 units permitted in Calhoun County in 2024 (0 in 5+ unit buildings).
Forward outlook
- Local home prices are declining (-3.0%/yr); year-one equity from $892 of loan paydown is wiped out by about $4k of value loss. Plan a longer hold.
- Calhoun County population projected at -16% by 2050 — secular population decline; favor cash flow + early exit over multi-decade hold.
- At projected returns (-3.0% appreciation + 8.0% rent growth), your $36k cash investment doubles in ~8 years — after that, you're playing with house money.
Negotiation context
- It's been on market 18 days — a 2% lower offer ($127k) is reasonable based on typical stale-listing flexibility.
- 3 sale attempts with the ask held roughly flat each time — persistent listings suggest the price (not the market) is what's stuck; bring a comps-based counter.
Risks & watch-outs
- Watch-outs: built in 1920 — expect roof / HVAC / electrical / plumbing capex.
Questions for the listing agent
- Built in 1920 — when were the roof, HVAC, electrical panel, plumbing, and water heater last replaced?
- Is there a deadline driving the sale (1031 exchange, divorce, estate, relocation)? That informs how much negotiation room exists.
- Crime grade is F in this area — have there been break-ins, vandalism, or insurance claims at this property in the last 3 years? What carrier currently insures it and at what premium?
- What's the average days-on-market for RENTAL listings here right now (not sales)? A rising rental-DOM trend means longer vacancies and softer asking-rent achievability than the comps imply.
- What's the recent tenant-quality profile in this submarket — average credit score on applications, eviction rate, late-payment / NSF rate, and stable-employment percentage? A property-management company in the area should have these aggregated.
- How much new for-sale + rental construction is in the pipeline within 1–3 miles? Heavy new supply typically softens prices + rents 12–24 months out; constrained supply supports both.
Investment metrics
- 1% rule
- 1.04% ✓
- Cap rate
- 8.57%
- Cash-on-cash
- 8.15%
- DSCR
- 1.36
- GRM
- 8.0
CMA / ARV
- ARV (on-the-fly)
- $123,552
- Comps found
- 12
Show comp detail 12 sales within ~0.75 mi
| Address | Dist | Beds/Ba | Sqft | Sold | Price | $/sf | Match |
|---|---|---|---|---|---|---|---|
| 64 W Goguac St W | 0.21mi | 3/1.0 | 1,220 (+7%) | 2mo | $49,000 | $40 | 75 |
| 85 Frisbie Ave | 0.31mi | 3/1.0 | 1,202 (+5%) | 5mo | $75,000 | $62 | 71 |
| 172 Riverside Dr | 0.54mi | 3/1.0 | 1,151 (+1%) | 1mo | $156,000 | $136 | 71 |
| 124 Spring St | 0.32mi | 3/1.0 | 1,200 (+5%) | 7mo | $133,000 | $111 | 70 |
| 178 Webber St | 0.17mi | 4/1.0 (+1) | 1,236 (+8%) | 8mo | $133,000 | $108 | 65 |
| 41 Randolph St | 0.48mi | 3/2.0 | 1,194 (+4%) | 8mo | $160,370 | $134 | 62 |
| 223 W Territorial Rd W | 0.56mi | 3/1.0 | 1,226 (+7%) | 0mo | $130,000 | $106 | 59 |
| 61 Harris Ave | 0.23mi | 2/1.0 (-1) | 1,000 (-13%) | 3mo | $95,000 | $95 | 58 |
| 228 Summer St | 0.73mi | 3/2.0 | 1,090 (-5%) | 3mo | $118,750 | $109 | 54 |
| 93 Goguac St E | 0.55mi | 3/2.0 | 1,288 (+13%) | 2mo | $128,500 | $100 | 50 |
| 545 W Territorial Rd | 0.74mi | 2/2.0 (-1) | 1,224 (+7%) | 1mo | $127,000 | $104 | 46 |
| 235 Fairfield Ave | 0.62mi | 2/1.0 (-1) | 990 (-14%) | 7mo | $200,000 | $202 | 36 |
Match score weights: distance 35% · size 25% · config 20% · recency 20%. Top-matched comps best support the ARV.
Projected returns pro-forma
-3.0% appreciation · 8.0% rent growth · sell at horizon
- IRR
- 1.2%
- Equity multiple
- 1.05×
- Total profit
- $1,742
- Equity at exit
- $19,234
- IRR
- 15.0%
- Equity multiple
- 2.48×
- Total profit
- $53,633
- Equity at exit
- $11,154
Cash invested: $36,120 (down + closing). Projections, not guarantees.
Landlord ↔ Tenant lean methodology
- Overall (STATE)
- 62 Landlord-Friendly
- State Michigan
- 62 Landlord-Friendly · EVEN
- County
- — inherits STATE
- City
- — inherits STATE
ZIP-level market 49015
- Rents YoY
- 11.1%
- Active inventory
- 165
- Price-to-rent
- 8.0×
Monthly cashflow live
- Estimated rent
- $1,336 medium interval (Pro) →
- Mortgage (P&I)
- −$676
- Tax from tax record
- −$80 /mo · $957/yr
- Insurance
- −$54
- HOA
- −$0
- Vacancy / Maint / Mgmt
- −$281
- Net cashflow
- $245
Break-even live
UW: 25.0% down · 7.5% · 30yr · 1.5% tax · 5.0% vac · 8.0% maint · 8.0% mgmt
Financing live
Cash to close
- Down payment
- $32,250
- Closing costs
- $3,870
- Reserves months
- —
- Total cash needed
- —
Loan-product check · same deal, 3 products live
Conventional
25% down · 7.5% · 30yr
- Down + closing
- —
- Monthly P&I
- —
- Monthly cashflow
- —
- DSCR
- —
- Eligible?
- —
Personal DTI + credit; lowest rate.
DSCR
20% down · 8.5% · 30yr
- Down + closing
- —
- Monthly P&I
- —
- Monthly cashflow
- —
- DSCR
- —
- Eligible?
- —
No personal income docs; deal must DSCR.
Hard money
10% down · 12.0% · 12mo
- Down + closing
- —
- Monthly P&I
- —
- Monthly cashflow
- —
- DSCR
- —
- Eligible?
- —
Short-term bridge; refi at stabilization.
Rent comps 3 comps
| Address | Beds | Baths | Sqft | Rent | $/sqft | DOM | Units | Dist |
|---|---|---|---|---|---|---|---|---|
| 98 Van Buren St E Battle Creek, MI | 2.0 | 1.0 | 1118 | $950 | $0.85 | 43d | 1 | 1.27mi |
| 115 West St Battle Creek, MI | 2.0–3.0 | 1.0–2.0 | 1090 | $1,500 | $1.38 | 43d | 3 | 1.31mi |
| 226 Taft Ct Battle Creek, MI | 1.0–2.0 | 1.0 | 762 | $985 | $1.29 | 43d | 8 | 1.37mi |
Listing history 11 events
-
2026-06-09status $129,000 Pending 18 DOM
-
2026-06-08days on market $129,000 Active 18 DOM
-
2026-06-07days on market $129,000 Active 17 DOM
-
2026-06-05days on market $129,000 Active 14 DOM
-
2026-06-02days on market $129,000 Active 12 DOM
-
2026-06-01days on market $129,000 Active 11 DOM
-
2026-05-31days on market $129,000 Active 10 DOM
-
2026-05-30days on market $129,000 Active 9 DOM
-
2026-05-21$129,000 Active
Show marketing remark (546 chars)
This inviting 3-bedroom home blends character and practicality with a main-floor primary suite featuring a private 3/4 bath. Enjoy a generously sized kitchen ideal for everyday living. Rich wood flooring adds warmth and character throughout the living and dining rooms, creating an inviting space to relax and enjoy. Upstairs are two good sized bedrooms and another full bath. The home benefits from replacement windows and updated electrical, providing meaningful improvements and added appeal for buyers looking for a move-in-ready opportunity.
-
2026-05-21$129,000 Active 546-char remark
Show marketing remark (546 chars)
This inviting 3-bedroom home blends character and practicality with a main-floor primary suite featuring a private 3/4 bath. Enjoy a generously sized kitchen ideal for everyday living. Rich wood flooring adds warmth and character throughout the living and dining rooms, creating an inviting space to relax and enjoy. Upstairs are two good sized bedrooms and another full bath. The home benefits from replacement windows and updated electrical, providing meaningful improvements and added appeal for buyers looking for a move-in-ready opportunity.
ⓘ Source: listings_history table (triggers on properties + properties_extension) + one-shot
backfill from property_details.listing_events for pre-trigger history.
Tax reassessment forecast MI · Partial reset (capped growth)
- Current annual tax
- $957 · $80/mo
- Projected year-2 tax
- $1,472 · $123/mo
- Expected delta
- +$515/yr (+$43/mo · 53.7%)
ⓘ Screening estimate from a state-policy table — verify with the county assessor before closing.
Climate risk First Street
- Flood 1/10 Low FEMA zone X (unshaded) · 0% chance over 30 yrs
- Wildfire 1/10 Low
- Heat 3/10 Moderate 7 d/yr ≥97°F today · 16 d/yr by 30 yrs out
- Wind 2/10 Low
- Air quality 3/10 Moderate 2 unhealthy d/yr today · 3 by 30 yrs out
Nearby sold comps map
Loading sold comps map…
Walkable amenities ~0.75 mi
Loading nearby amenities…
Taxation est. · year 1
- Rental income
- $16,029
- − Mortgage interest
- −$7,226
- − Property taxes
- −$957
- − Insurance
- −$645
- − Repairs & maintenance
- −$1,282
- − Management
- −$1,282
- − Depreciation
- −$3,753
- Taxable income
- $883
- Est. tax owed @ 24.0%
- −$212
- After-tax cash flow
- $2,730/yr
For passive investors: Depreciation is non-cash, so a rental often shows a tax loss while cash-flowing — sheltering income. Rental losses are passive: they offset passive income freely, and up to $25,000/yr can offset ordinary (W-2) income if you actively participate and your MAGI is under $100k (phasing out to $0 by $150k); unused losses carry forward. On sale, claimed depreciation is recaptured at up to 25%, and gains may owe capital-gains tax (a 1031 exchange can defer both). Figures are a year-1 estimate at your 24.0% rate — not tax advice; consult a CPA.
Schools (NCES district)
- District
- Battle Creek Public Schools
- NCES district ID
- 2600005
- Math proficiency
- 8% ▼ -2.00%
- Reading proficiency
- 19% ▬ 0.00%
- Median HH income
- $31,697
- Composite
- 10.73/100
- National rank
- #9769
- State rank
- #510 of 540 in MI
Livability — Battle Creek
- Score
- 73/100
- State rank
- #198
- US rank
- #5031
Category grades
Schools grade is shown separately in the Schools card above.
Census & demographics
- Census place
- Battle Creek, MI
- County
- Calhoun County · 91,590 people
- City population
- 91,590
- Metro
- Battle Creek, MI
- Population (ZIP)
- 27,765
- Household income
- $68,821
- Rent vs Own
- Severe rent burden
- 755.0
Population outlook (Calhoun County) Hauer SSP2
- Today (2025)
- 130,157 people
- By 2030
- 126,691 · -2.7%
- By 2040
- 118,517 · -8.9%
- By 2050
- 109,855 · -15.6%
- By 2075
- 90,486 · -30.5%
- By 2100
- 70,766 · -45.6%
Race, ethnicity, and origin ACS 2023
- Neighborhood character
- Predominantly White (71%)
- Race & ethnicity
- White 71% Two or more races 11% Hispanic / Latino 7% Asian 7% Black 7%
- Hispanic origin (detail)
- Mexican 5%
- Common ancestry
- Iranian 4% Lithuanian 4% Romanian 3%
- Foreign-born
- 10% · Philippines, Canada
- Languages at home
- 86% English-only · Other Asian/Pacific 7% Spanish 4% Other Indo-European 1%
Political lean MEDSL · Calhoun
- 2024 margin
- R (+14.1) · D 42.3% · R 56.4% · Other 1.3%
- 2008→2024 swing
- -23.4pp toward R · 2008: 9.4pp · 2024: -14.1pp
- All cycles
- 2024: R+14.1 2020: R+11.1 2016: R+12.5 2012: D+1.6 2008: D+9.4
Not yet ingested
- Civics
- —
Market trends
- HPI YoY
- ▼ -116.20%
- Current HPI
- 206.7754
- Rent YoY
- ▲ 11.13%
- Metro
- Battle Creek, MI
- State GDP YoY
- ▲ 1.37%
- F500 in state
- 28
Industry mix (Fortune 500 HQ in MI)
| Industry | F500 HQs | Revenue |
|---|---|---|
| Automotive Parts | 3 | $48B |
|
||
| Automotive | 2 | $372B |
|
||
| Chemicals | 1 | $45B |
|
||
| Automotive Retail | 1 | $29B |
|
||
| Healthcare / Medical Devices | 1 | $23B |
|
||
| Automotive Technology | 1 | $20B |
|
||
Price history
+0.0% since first listed3 events — show timeline
- 2026-05-21 Listed $129,000 MiRealSource-MiMLS
- 2026-05-21 Listed $129,000 REALCOMP
- 2026-05-21 Listed $129,000 SW Michigan MLS
Property tax history
-2.2%/yrLatest (2025): $957 · -31.2% YoY. Source: county tax records.
Cash-flow waterfall
monthlySold comps — $/sqft
last 12 mo · ≤1 miLoading sold comps…