 8-Plex
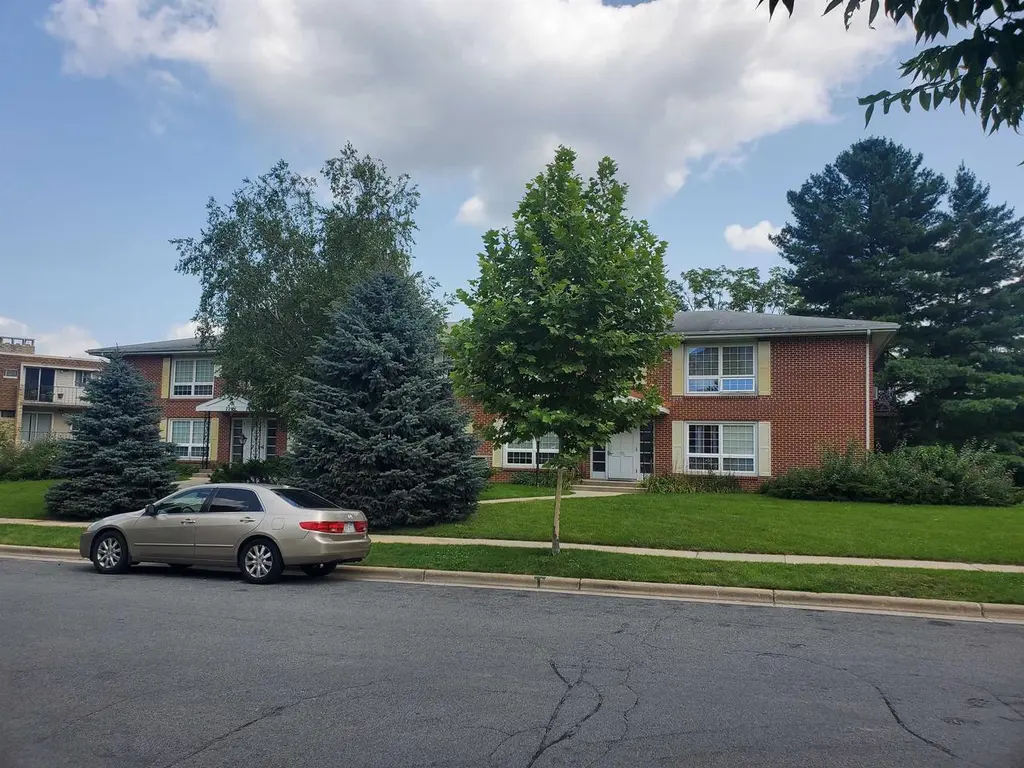
225 Nautilus Dr · Madison, WI
Flood risk 1/10 · Minimal
- FEMA flood zone
- X (unshaded)
- Chance of flooding over 30 yrs
- 0.0%
- Est. flood insurance / yr
- $507 – $1,088
Fire risk 1/10 · Minimal
- Est. fire insurance / yr
- $636 – $1,182
Heat risk 2/10 · Minimal
- Hot days now (above 98°F)
- 7 days/yr
- Hot days in 30 yrs
- 14 days/yr
Wind risk 2/10 · Minimal
- Chance of severe wind over 30 yrs
- —
Air-quality risk 2/10 · Minimal
- Unhealthy air days now
- 1 days/yr
- Unhealthy air days in 30 yrs
- 1 days/yr
Risk factors via First Street. Map © Google.
Why this score? — see what drove the D grade
The composite is a weighted blend of 9 inputs, each scored 0–100. Each bar is that input's sub-score; the figure is the points it added to the 100-point composite (weight × sub-score).
- Cash flow +14.6/30.0
- ARV discount +7.5/15.0
- DSCR +4.5/10.0
- 1% rule +4.3/10.0
- Livability +4.2/5.0
- Rent growth +3.9/5.0
- Schools +3.3/10.0
- Condition / age +2.5/5.0
- Appreciation +0.0/10.0
$1,450,000
🖨 Deal sheet (PDF) 📄 Offer letter ✓ Due diligence
Multi-family units
County records classify this as Multi-Family (5+ Unit). Listing-text estimate: 8 units. confirmed
5+ unit building — per-unit beds/baths from public records are typically unavailable; the breakdown below (if shown) is an estimate from the listing text.
Listing remarks MLS
Solidly built, brick 8 unit now in an established neighborhood. Each unit includes one space in a detached garage, and storage locker. Each building also features basement laundry area for tenant use. This property has been well-maintained but can use some cosmetic updates. Strong rental history with some room for rent increases. Rents listed are for Units in Building 225. Additional unit rents for Building 229: #1 $1260, Great location close to bus line and employers including Trustage and Exact Sciences. #2 $1225, Unit #3 $1265, Unit #4 $1215. All units are similar in floorplan and condition. Only 1 unit will be available for initial showing.
Key facts
- 0.62 acre lot
- Built 1965
- Listed 641 days
Neighborhood map
What this means for you Summary
Snapshot
- This is a 8 × 2-bed/1-bath units multifamily listed at $1.45M.
Deal economics
- At list price, monthly cash flow is $355 ($4k/yr) — positive. Per door: $44/mo.
- The deal already cash-flows at list — no discount required.
- To meet the 1% rule (rent ≥ 1% of price), the offer needs to be $1.34M (7.3% below list).
- Recommended offer: $1.28M (12.0% below list) — sets the bar for market timing.
- Cap rate 6.6% vs local median 2.4% in Madison — top-decile yield for the area; either an underpriced asset or a hidden risk that comps aren't pricing in. Stress-test before assuming the spread holds.
Location & tenants
- Location reads 84/100 on livability (#39 in WI, #819 nationally) — a professional / high-income tenant draw. Strengths: commute A+, employment A+, housing A+.
- Madison Metropolitan School District (urban): math 35% / reading 40% proficiency, ranked #193 of 342 in WI (top 56%) — families likely to look elsewhere, expect single-tenant / working-renter base with shorter leases.
- Zoned schools: Muir Elementary (math 42% / reading 37%, grade F, #490 of 1,041 statewide, top 53%, 403 students, 46% FRL); Jefferson Middle (math 28% / reading 31%, grade F, #261 of 383 statewide, top 73%, 415 students, 52% FRL); Vel Phillips Memorial High (math 43% / reading 54%, grade D, #46 of 483 statewide, top 10%, 2,025 students, 39% FRL) — zoned schools at 46% FRL track the district average.
- Market conditions: Rents rising fast (+5.5%/yr); 62 active listings in the ZIP; solid renter incomes; 5,519 units permitted in Dane County in 2024 (3,978 in 5+ unit buildings).
- At $13,447/mo this rent would consume 182% of the median local household income ($89k/yr) (locally 1320% of renters already pay >50% of income on rent) — very limited rent-growth headroom before tenants either downsize or default.
Forward outlook
- Local home prices are declining (-3.0%/yr); year-one equity from $10k of loan paydown is wiped out by about $44k of value loss. Plan a longer hold.
- Dane County population projected at +35% by 2050 — long-run rental-demand tailwind backs the buy-and-hold thesis.
Negotiation context
- It's been on market 641 days — a 12% lower offer ($1.28M) is reasonable based on typical stale-listing flexibility.
- 2 sale attempts since 2y ago; this cycle's ask has dropped $150k (9%) from the opening price — seller is motivated, your offer sets the floor, not the list.
- Current owner paid $680k; list at $1.45M implies a 113% gain — meaningful room to come down on a strong offer.
Questions for the listing agent
- It's been on market 641 days. Have you received any prior offers? Is the seller open to a 12% concession, seller financing, or rate buy-down credit?
- Can we see the unit-by-unit rent roll, current vacancy, and any below-market leases? What's the average tenancy length?
- What capital expenditures (roof, boiler, parking lot, exteriors) have been made in the last 5 years, and what's planned in the next 2?
- Built in 1965 — when were the roof, HVAC, electrical panel, plumbing, and water heater last replaced?
- Why hasn't it sold? Are there any deal-killer items the seller is aware of (foundation, flood, title, zoning, code violations)?
- Is there a deadline driving the sale (1031 exchange, divorce, estate, relocation)? That informs how much negotiation room exists.
- The area grade is low — what's the realistic commute time and amenity access for the typical tenant pool here? Any planned neighborhood developments (good or bad) we should know about?
- What's the average days-on-market for RENTAL listings here right now (not sales)? A rising rental-DOM trend means longer vacancies and softer asking-rent achievability than the comps imply.
- What's the recent tenant-quality profile in this submarket — average credit score on applications, eviction rate, late-payment / NSF rate, and stable-employment percentage? A property-management company in the area should have these aggregated.
- How much new apartment / multifamily construction is in the pipeline within 1–3 miles? Heavy new supply (>2% of stock underway) typically softens rents 12–24 months out; light construction supports rent growth.
Investment metrics
- 1% rule
- 0.93% ✗
- Cap rate
- 6.59%
- Cash-on-cash
- 1.05%
- DSCR
- 1.05
- GRM
- 9.0
CMA / ARV
- ARV (median comp)
- $335,088
- List price
- $1,450,000
- Delta
- 332.72%
- Verdict
- OVERPRICED
- Comps
- 1 within 2.0 mi
Projected returns pro-forma
-3.0% appreciation · 5.49% rent growth · sell at horizon
- IRR
- -11.8%
- Equity multiple
- 0.56×
- Total profit
- $-177,479
- Equity at exit
- $216,200
- IRR
- 0.8%
- Equity multiple
- 1.06×
- Total profit
- $25,099
- Equity at exit
- $125,369
Cash invested: $406,000 (down + closing). Projections, not guarantees.
Landlord ↔ Tenant lean methodology
- Overall (STATE)
- 73 Landlord-Friendly
- State Wisconsin
- 73 Landlord-Friendly · R+2
- County
- — inherits STATE
- City
- — inherits STATE
ZIP-level market 53705
- Rents YoY
- 5.5%
- Active inventory
- 62
- Price-to-rent
- 71.9×
Monthly cashflow live
- Estimated rent
- $13,447 medium interval (Pro) →
- Mortgage (P&I)
- −$7,604
- Tax from tax record
- −$2,060 /mo · $24,722/yr
- Insurance
- −$604
- HOA
- −$0
- Vacancy / Maint / Mgmt
- −$2,824
- Net cashflow
- $355
Break-even live
Sensitivity live
| Price | -10% $1,176 | -5% $765 | +0% $355 | +5% $-56 | +10% $-466 |
|---|---|---|---|---|---|
| Rent | -10% $-707 | -5% $-176 | +0% $355 | +5% $886 | +10% $1,417 |
| Rate | -1.0pp $1,085 | -0.5pp $724 | base $355 | +0.5pp $-21 | +1.0pp $-403 |
8-unit breakdown (identical units grouped — click to expand)
| Units | Beds | Baths | Est. rent |
|---|---|---|---|
| 8× units | 2 | 1 | $13,448 |
| #1 | 2 | 1 | $1,681 |
| #2 | 2 | 1 | $1,681 |
| #3 | 2 | 1 | $1,681 |
| #4 | 2 | 1 | $1,681 |
| #5 | 2 | 1 | $1,681 |
| #6 | 2 | 1 | $1,681 |
| #7 | 2 | 1 | $1,681 |
| #8 | 2 | 1 | $1,681 |
| Total (8 units) | $13,447 | ||
UW: 25.0% down · 7.5% · 30yr · 1.5% tax · 5.0% vac · 8.0% maint · 8.0% mgmt
Financing live
Cash to close
- Down payment
- $362,500
- Closing costs
- $43,500
- Reserves months
- —
- Total cash needed
- —
Loan-product check · same deal, 3 products live
Conventional
25% down · 7.5% · 30yr
- Down + closing
- —
- Monthly P&I
- —
- Monthly cashflow
- —
- DSCR
- —
- Eligible?
- —
Personal DTI + credit; lowest rate.
DSCR
20% down · 8.5% · 30yr
- Down + closing
- —
- Monthly P&I
- —
- Monthly cashflow
- —
- DSCR
- —
- Eligible?
- —
No personal income docs; deal must DSCR.
Hard money
10% down · 12.0% · 12mo
- Down + closing
- —
- Monthly P&I
- —
- Monthly cashflow
- —
- DSCR
- —
- Eligible?
- —
Short-term bridge; refi at stabilization.
Listing history 14 events
-
2026-06-03status $1,450,000 Pending 641 DOM
-
2026-06-02days on market $1,450,000 Active 641 DOM
-
2026-06-01days on market $1,450,000 Active 640 DOM
-
2026-05-31days on market $1,450,000 Active 639 DOM
-
2026-05-31days on market $1,450,000 Active 638 DOM
-
2025-06-05price $1,450,000 653-char remark
Show marketing remark (653 chars)
Solidly built, brick 8 unit now in an established neighborhood. Each unit includes one space in a detached garage, and storage locker. Each building also features basement laundry area for tenant use. This property has been well-maintained but can use some cosmetic updates. Strong rental history with some room for rent increases. Rents listed are for Units in Building 225. Additional unit rents for Building 229: #1 $1260, Great location close to bus line and employers including Trustage and Exact Sciences. #2 $1225, Unit #3 $1265, Unit #4 $1215. All units are similar in floorplan and condition. Only 1 unit will be available for initial showing.
-
2025-01-09price $1,500,000 653-char remark
Show marketing remark (653 chars)
Solidly built, brick 8 unit now in an established neighborhood. Each unit includes one space in a detached garage, and storage locker. Each building also features basement laundry area for tenant use. This property has been well-maintained but can use some cosmetic updates. Strong rental history with some room for rent increases. Rents listed are for Units in Building 225. Additional unit rents for Building 229: #1 $1260, Great location close to bus line and employers including Trustage and Exact Sciences. #2 $1225, Unit #3 $1265, Unit #4 $1215. All units are similar in floorplan and condition. Only 1 unit will be available for initial showing.
-
2024-08-30$1,600,000 Active 653-char remark
Show marketing remark (653 chars)
Solidly built, brick 8 unit now in an established neighborhood. Each unit includes one space in a detached garage, and storage locker. Each building also features basement laundry area for tenant use. This property has been well-maintained but can use some cosmetic updates. Strong rental history with some room for rent increases. Rents listed are for Units in Building 225. Additional unit rents for Building 229: #1 $1260, Great location close to bus line and employers including Trustage and Exact Sciences. #2 $1225, Unit #3 $1265, Unit #4 $1215. All units are similar in floorplan and condition. Only 1 unit will be available for initial showing.
-
2024-05-17historical $1,295
-
2024-04-23$1,295
-
2022-05-30price $1,150
-
2014-10-02soldstatus $680,000
-
2008-08-06soldstatus $547,000
-
2000-05-05soldstatus $355,000
ⓘ Source: listings_history table (triggers on properties + properties_extension) + one-shot
backfill from property_details.listing_events for pre-trigger history.
Tax reassessment forecast WI · Partial reset (capped growth)
- Current annual tax
- $24,722 · $2,060/mo
- Projected year-2 tax
- $25,773 · $2,148/mo
- Expected delta
- +$1,052/yr (+$88/mo · 4.3%)
ⓘ Screening estimate from a state-policy table — verify with the county assessor before closing.
Climate risk First Street
- Flood 1/10 Low FEMA zone X (unshaded) · 0% chance over 30 yrs
- Wildfire 1/10 Low
- Heat 2/10 Low 7 d/yr ≥98°F today · 14 d/yr by 30 yrs out
- Wind 2/10 Low
- Air quality 2/10 Low 1 unhealthy d/yr today · 1 by 30 yrs out
Nearby sold comps map
Loading sold comps map…
Walkable amenities ~0.75 mi
Loading nearby amenities…
Taxation est. · year 1
- Rental income
- $161,364
- − Mortgage interest
- −$81,223
- − Property taxes
- −$24,722
- − Insurance
- −$7,250
- − Repairs & maintenance
- −$12,909
- − Management
- −$12,909
- − Depreciation
- −$42,182
- Taxable loss
- −$19,830
- Est. tax savings @ 24.0%
- +$4,759
- After-tax cash flow
- $9,018/yr
For passive investors: Depreciation is non-cash, so a rental often shows a tax loss while cash-flowing — sheltering income. Rental losses are passive: they offset passive income freely, and up to $25,000/yr can offset ordinary (W-2) income if you actively participate and your MAGI is under $100k (phasing out to $0 by $150k); unused losses carry forward. On sale, claimed depreciation is recaptured at up to 25%, and gains may owe capital-gains tax (a 1031 exchange can defer both). Figures are a year-1 estimate at your 24.0% rate — not tax advice; consult a CPA.
Schools (NCES district)
- District
- Madison Metropolitan School District
- NCES district ID
- 5508520
- Math proficiency
- 35% ▼ -4.00%
- Reading proficiency
- 40% ▲ 3.00%
- Median HH income
- $51,654
- Composite
- 32.56/100
- National rank
- #5686
- State rank
- #193 of 342 in WI
Livability — Madison
- Score
- 84/100
- State rank
- #39
- US rank
- #819
Category grades
Schools grade is shown separately in the Schools card above.
Census & demographics
- Census place
- Madison, WI
- County
- Dane County · 506,461 people
- City population
- 301,931
- Metro
- Madison, WI
- Population (ZIP)
- 25,017
- Household income
- $88,549
- Rent vs Own
- Severe rent burden
- 1320.0
Population outlook (Dane County) Hauer SSP2
- Today (2025)
- 610,707 people
- By 2030
- 654,875 · +7.2%
- By 2040
- 740,480 · +21.2%
- By 2050
- 826,188 · +35.3%
- By 2075
- 1,040,574 · +70.4%
- By 2100
- 1,168,084 · +91.3%
Race, ethnicity, and origin ACS 2023
- Neighborhood character
- Predominantly White (71%)
- Race & ethnicity
- White 71% Asian 14% Two or more races 7% Hispanic / Latino 7% Black 2%
- Hispanic origin (detail)
- Mexican 4%
- Common ancestry
- Romanian 7% Portuguese 6% Italian 3%
- Foreign-born
- 19% · China, Canada, South Korea
- Languages at home
- 80% English-only · Chinese 5% Spanish 4% Other Indo-European 3%
Political lean MEDSL · Dane
- 2024 margin
- Solid D (+51.7) · D 75.1% · R 23.4% · Other 1.5%
- 2008→2024 swing
- +4.7pp toward D · 2008: 47.0pp · 2024: 51.7pp
- All cycles
- 2024: D+51.7 2020: D+52.6 2016: D+48.0 2012: D+43.6 2008: D+47.0
Not yet ingested
- Civics
- —
Market trends
- HPI YoY
- ▼ -492.17%
- Current HPI
- 352.895
- Rent YoY
- ▲ 5.49%
- Metro
- Madison, WI
- State GDP YoY
- ▲ 2.10%
- F500 in state
- 20
Industry mix (Fortune 500 HQ in WI)
| Industry | F500 HQs | Revenue |
|---|---|---|
| Industrial Machinery | 4 | $23B |
|
||
| Industrial Technology | 2 | $36B |
|
||
| Insurance | 1 | $36B |
|
||
| Professional Services | 1 | $19B |
|
||
| Utilities | 1 | $9B |
|
||
| Consumer Goods | 1 | $3B |
|
||
Price history
+308.5% since first listed9 events — show timeline
- 2025-06-05 Price Changed $1,450,000 SCWMLS
- 2025-01-09 Price Changed $1,500,000 SCWMLS
- 2024-08-30 Listed $1,600,000 SCWMLS
- 2024-05-17 Rental Removed $1,295 APPFOLIO
- 2024-04-23 Listed for Rent $1,295 APPFOLIO
- 2022-05-30 Price Changed $1,150 RENT.
- 2014-10-02 Sold (Public Records) $680,000 Public Records
- 2008-08-06 Sold (Public Records) $547,000 Public Records
- 2000-05-05 Sold (Public Records) $355,000 Public Records
Property tax history
+5.8%/yrLatest (2025): $24,722 · +12.8% YoY. Source: county tax records.
Cash-flow waterfall
monthlySold comps — $/sqft
last 12 mo · ≤1 miLoading sold comps…