10318 Morris Blvd · Ketron Island, WA
Flood risk 1/10 · Minimal
- FEMA flood zone
- X (unshaded)
- Chance of flooding over 30 yrs
- 0.0%
- Est. flood insurance / yr
- $507 – $1,088
Fire risk 2/10 · Minimal
- Est. fire insurance / yr
- $604 – $1,122
Heat risk 2/10 · Minimal
- Hot days now (above 87°F)
- 6 days/yr
- Hot days in 30 yrs
- 12 days/yr
Wind risk 1/10 · Minimal
- Chance of severe wind over 30 yrs
- —
Air-quality risk 7/10 · Major
- Unhealthy air days now
- 9 days/yr
- Unhealthy air days in 30 yrs
- 9 days/yr
Risk factors via First Street. Map © Google.
Why this score? — see what drove the D+ grade
The composite is a weighted blend of 9 inputs, each scored 0–100. Each bar is that input's sub-score; the figure is the points it added to the 100-point composite (weight × sub-score).
- ARV discount +15.0/15.0
- Cash flow +13.0/30.0
- Schools +5.8/10.0
- DSCR +3.9/10.0
- 1% rule +3.2/10.0
- Rent growth +2.5/5.0
- Condition / age +2.5/5.0
- Livability +1.5/5.0
- Appreciation +0.0/10.0
$250,000
🖨 Deal sheet (PDF) 📄 Offer letter ✓ Due diligence
Listing remarks
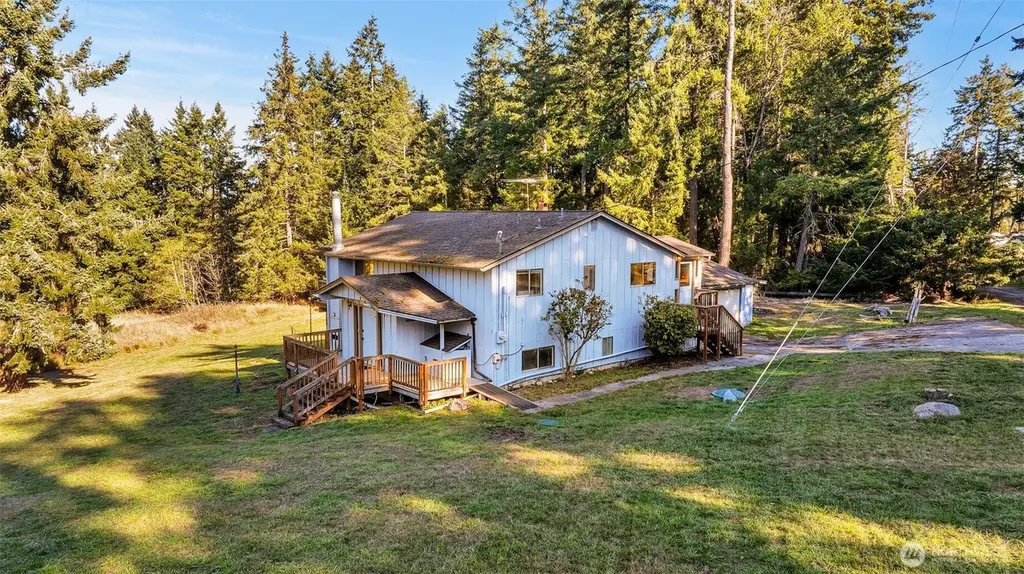
Escape the noise of the city and embrace the quiet beauty of Ketron Island. The ferry journey over the sound sets the tone for a truly peaceful, unplugged lifestyle. The home is set on over half an acre with mountain, meadow, and sound views in a serene natural setting. The property features 2 bedrooms, 1.75 baths, a spacious living room with expansive windows, a shop, and a bonus room—ready for your vision and personal touches. With a 2 car garage and space for an RV, it’s an ideal opportunity to create your own island retreat, whether for everyday living or a weekend getaway. Ketron is a quiet island community made up exclusively of private residences, offering a rare sense of
Key facts
- Island property
- Private retreat
- Sound views
Tags
Property features AI
Finance
- Financial info: Acceptable financing: Cash, Conventional, FHA, VA
Exterior
- Parking: Attached garage; 2 covered parking spaces; Garage suitable for RV parking; Garage (has garage, ~480 sq ft)
- Utilities: Electric energy source; Community water (Ketron Island Water); Septic sewer; Power provided by TPU
- Home design: Single family residence; Split entry / multi-level layout; Built on lot; Has view; Entry located on split level
- Construction: Wood construction; Composition roof; Poured concrete foundation
- Exterior features: Wood exterior; Deck; Patio; Garden space; Open, secluded lot setting; RV parking; Shop
Interior
- Kitchen: Kitchen with eating space (second level); Additional kitchen area (second level); Dishwasher; Stove/Range; Refrigerator
- Bedrooms: 2 bedrooms (both on lower level); Primary bedroom on lower level; Additional bedroom on lower level; Den/office (lower)
- Flooring: Vinyl flooring; Carpet
- Bathrooms: 1 full bathroom (lower) with bathtub; 1 three-quarter bathroom (upper); 2 showers total
- Heating & cooling: Baseboard heating; Wall furnace; No cooling
- Interior features: Ceiling fans; Fireplace (wood burning); Pantry; Water heater; Wired for generator; Finished basement
- Laundry & utility: Washer; Dryer; Utility room (second level); Electric water heater in utility room
Neighborhood map
What this means for you Summary
Snapshot
- This is a 2-bed/2.0-bath single-family listed at $250k.
Deal economics
- At list price, monthly cash flow is $-13 ($-157/yr) — negative.
- To cash-flow at today's rent, offer at most $248k (0.9% below list).
- To meet the 1% rule (rent ≥ 1% of price), the offer needs to be $206k (17.6% below list).
- Recommended offer: $206k (17.6% below list) — sets the bar for 1% rule.
Location & tenants
- Location reads 29/100 on livability (#623 in WA) — a limited-amenity area; tenant pool skews transient or value-seeking. Strengths: crime A, cost of living B+; Watch: health & safety C-, amenities F, commute F.
- Steilacoom Hist. School District (suburban): math 57% / reading 71% proficiency, ranked #33 of 291 in WA (top 11%) — acceptable for families but not a draw, mixed tenant base, ~2y average lease; only 16% free/reduced lunch — higher-income household profile.
- Zoned schools: Pioneer Middle (711 students, 32% FRL); Steilacoom High (946 students, 26% FRL).
- Market conditions: 49 active listings in the ZIP; solid renter incomes; 3,209 units permitted in Pierce County in 2024 (1,269 in 5+ unit buildings).
Forward outlook
- Local home prices are declining (-3.0%/yr); year-one equity from $2k of loan paydown is wiped out by about $8k of value loss. Plan a longer hold.
- Pierce County population projected at +26% by 2050 — long-run rental-demand tailwind backs the buy-and-hold thesis.
Negotiation context
- Only 14 days on market — expect competitive offers; lowballing is unlikely to land.
- 5 sale attempts since 15y ago; this cycle's ask has dropped $50k (17%) from the opening price — seller is motivated, your offer sets the floor, not the list.
Questions for the listing agent
- What do current leases actually rent for vs. the listed asking? Can we see a recent rent roll and the last 12 months of T-12 income?
- Built in 1977 — when were the roof, HVAC, electrical panel, plumbing, and water heater last replaced?
- Is there a deadline driving the sale (1031 exchange, divorce, estate, relocation)? That informs how much negotiation room exists.
- Schools are F-rated, which usually means shorter tenancies and higher turnover. Who's the typical renter profile here, and what's been the actual vacancy rate?
- The area grade is low — what's the realistic commute time and amenity access for the typical tenant pool here? Any planned neighborhood developments (good or bad) we should know about?
- What's the average days-on-market for RENTAL listings here right now (not sales)? A rising rental-DOM trend means longer vacancies and softer asking-rent achievability than the comps imply.
- What's the recent tenant-quality profile in this submarket — average credit score on applications, eviction rate, late-payment / NSF rate, and stable-employment percentage? A property-management company in the area should have these aggregated.
- How much new for-sale + rental construction is in the pipeline within 1–3 miles? Heavy new supply typically softens prices + rents 12–24 months out; constrained supply supports both.
Investment metrics
- 1% rule
- 0.82% ✗
- Cap rate
- 6.23%
- Cash-on-cash
- -0.22%
- DSCR
- 0.99
- GRM
- 10.1
CMA / ARV
- ARV (on-the-fly)
- $499,488
- Comps found
- 2
Show comp detail 2 sales within ~0.75 mi
| Address | Dist | Beds/Ba | Sqft | Sold | Price | $/sf | Match |
|---|---|---|---|---|---|---|---|
| 10806 W Morris Blvd | 0.35mi | 3/3.0 (+1) | 2,160 (+5%) | 4mo | $523,000 | $242 | 64 |
| 10115 Morris Blvd | 0.14mi | 3/2.0 (+1) | 1,773 (-14%) | 14mo | $262,800 | $148 | 54 |
Match score weights: distance 35% · size 25% · config 20% · recency 20%. Top-matched comps best support the ARV.
Projected returns pro-forma
-3.0% appreciation · 3.0% rent growth · sell at horizon
- IRR
- -16.7%
- Equity multiple
- 0.41×
- Total profit
- $-41,367
- Equity at exit
- $37,276
- IRR
- -8.5%
- Equity multiple
- 0.47×
- Total profit
- $-37,186
- Equity at exit
- $21,615
Cash invested: $70,000 (down + closing). Projections, not guarantees.
Landlord ↔ Tenant lean methodology
- Overall (STATE)
- 28 Tenant-Leaning
- State Washington
- 28 Tenant-Leaning · D+8
- County
- — inherits STATE
- City
- — inherits STATE
ZIP-level market 98388
- Active inventory
- 49
- Price-to-rent
- 10.1×
Monthly cashflow live
- Estimated rent
- $2,060 medium interval (Pro) →
- Mortgage (P&I)
- −$1,311
- Tax from tax record
- −$225 /mo · $2,706/yr
- Insurance
- −$104
- HOA
- −$0
- Vacancy / Maint / Mgmt
- −$433
- Net cashflow
- $-13
Break-even live
Sensitivity live
| Price | -10% $128 | -5% $58 | +0% $-13 | +5% $-84 | +10% $-155 |
|---|---|---|---|---|---|
| Rent | -10% $-176 | -5% $-94 | +0% $-13 | +5% $68 | +10% $150 |
| Rate | -1.0pp $113 | -0.5pp $50 | base $-13 | +0.5pp $-78 | +1.0pp $-144 |
UW: 25.0% down · 7.5% · 30yr · 1.5% tax · 5.0% vac · 8.0% maint · 8.0% mgmt
Financing live
Cash to close
- Down payment
- $62,500
- Closing costs
- $7,500
- Reserves months
- —
- Total cash needed
- —
Loan-product check · same deal, 3 products live
Conventional
25% down · 7.5% · 30yr
- Down + closing
- —
- Monthly P&I
- —
- Monthly cashflow
- —
- DSCR
- —
- Eligible?
- —
Personal DTI + credit; lowest rate.
DSCR
20% down · 8.5% · 30yr
- Down + closing
- —
- Monthly P&I
- —
- Monthly cashflow
- —
- DSCR
- —
- Eligible?
- —
No personal income docs; deal must DSCR.
Hard money
10% down · 12.0% · 12mo
- Down + closing
- —
- Monthly P&I
- —
- Monthly cashflow
- —
- DSCR
- —
- Eligible?
- —
Short-term bridge; refi at stabilization.
Listing history 31 events
-
2026-06-17status $250,000 Pending 14 DOM
-
2026-06-16days on market $250,000 Active 14 DOM
-
2026-06-15days on market $250,000 Active 13 DOM
-
2026-06-13days on market $250,000 Active 11 DOM
-
2026-06-13days on market $250,000 Active 10 DOM
-
2026-06-09days on market $250,000 Active 7 DOM
-
2026-06-08days on market $250,000 Active 6 DOM
-
2026-06-07days on market $250,000 Active 5 DOM
-
2026-06-04days on market $250,000 Active 2 DOM
-
2026-06-02pricedays on market $250,000 Active 1 DOM
-
2026-06-01days on market $300,000 Active 60 DOM
-
2026-05-31days on market $300,000 Active 59 DOM
-
2026-04-02$300,000 Active
-
2019-09-12soldstatus $240,000 Sold
-
2019-09-12soldstatus $240,000
-
2019-08-21status Pending
-
2019-08-13status Pending Inspection
-
2019-08-09price $240,000
-
2019-07-25price $242,500
-
2019-05-30status Active
-
2019-05-24status Pending Inspection
-
2019-04-17$245,000 Active
-
2012-04-11soldstatus $79,000 Sold
-
2012-04-11soldstatus $79,000
-
2012-01-25status Pending
-
2012-01-13price $89,000
-
2011-12-23status Active
-
2011-12-09status Pending Inspection
-
2011-11-17price $95,000
-
2011-09-02price $109,000
-
2011-05-06$129,900 Active
ⓘ Source: listings_history table (triggers on properties + properties_extension) + one-shot
backfill from property_details.listing_events for pre-trigger history.
Tax reassessment forecast WA · Resets to sale price
- Current annual tax
- $2,706 · $225/mo
- Projected year-2 tax
- $2,706 · $225/mo
- Expected delta
- $0/yr ($0/mo · 0.0%)
ⓘ Screening estimate from a state-policy table — verify with the county assessor before closing.
Climate risk First Street
- Flood 1/10 Low FEMA zone X (unshaded) · 0% chance over 30 yrs
- Wildfire 2/10 Low
- Heat 2/10 Low 6 d/yr ≥87°F today · 12 d/yr by 30 yrs out
- Wind 1/10 Low
- Air quality 7/10 Severe 9 unhealthy d/yr today · 9 by 30 yrs out
Nearby sold comps map
Loading sold comps map…
Walkable amenities ~0.75 mi
Loading nearby amenities…
Taxation est. · year 1
- Rental income
- $24,723
- − Mortgage interest
- −$14,004
- − Property taxes
- −$2,706
- − Insurance
- −$1,250
- − Repairs & maintenance
- −$1,978
- − Management
- −$1,978
- − Depreciation
- −$7,273
- Taxable loss
- −$4,465
- Est. tax savings @ 24.0%
- +$1,072
- After-tax cash flow
- $915/yr
For passive investors: Depreciation is non-cash, so a rental often shows a tax loss while cash-flowing — sheltering income. Rental losses are passive: they offset passive income freely, and up to $25,000/yr can offset ordinary (W-2) income if you actively participate and your MAGI is under $100k (phasing out to $0 by $150k); unused losses carry forward. On sale, claimed depreciation is recaptured at up to 25%, and gains may owe capital-gains tax (a 1031 exchange can defer both). Figures are a year-1 estimate at your 24.0% rate — not tax advice; consult a CPA.
Schools (NCES district)
- District
- Steilacoom Hist. School District
- NCES district ID
- 5308460
- Math proficiency
- 57% ▲ 2.00%
- Reading proficiency
- 71% ▬ 0.00%
- Median HH income
- $72,348
- Composite
- 57.95/100
- National rank
- #2169
- State rank
- #33 of 291 in WA
Livability — Ketron Island
- Score
- 29/100
- State rank
- #623
- US rank
- #27930
Category grades
Schools grade is shown separately in the Schools card above.
Census & demographics
- Census place
- Ketron Island, WA
- County
- Pierce County · 788,257 people
- Metro
- Seattle-Tacoma-Bellevue, WA
- Population (ZIP)
- 7,043
- Household income
- $100,851
- Rent vs Own
- Severe rent burden
- 130.0
Population outlook (Pierce County) Hauer SSP2
- Today (2025)
- 956,648 people
- By 2030
- 1,010,862 · +5.7%
- By 2040
- 1,113,170 · +16.4%
- By 2050
- 1,206,524 · +26.1%
- By 2075
- 1,436,425 · +50.2%
- By 2100
- 1,563,654 · +63.5%
Race, ethnicity, and origin ACS 2023
- Neighborhood character
- Predominantly White (68%)
- Race & ethnicity
- White 68% Two or more races 12% Hispanic / Latino 12% Asian 5% Black 5% Native American 1%
- Hispanic origin (detail)
- Mexican 9% Puerto Rican 1%
- Common ancestry
- Lithuanian 4% Portuguese 4% Slovak 3%
- Foreign-born
- 8% · Canada, China, Vietnam
- Languages at home
- 90% English-only · Spanish 2% German/W. Germanic 1% Tagalog/Filipino 1%
Political lean MEDSL · Pierce
- 2024 margin
- D (+10.8) · D 53.9% · R 43.1% · Other 3.0%
- 2008→2024 swing
- -1.4pp toward R · 2008: 12.2pp · 2024: 10.8pp
- All cycles
- 2024: D+10.8 2020: D+11.2 2016: D+7.5 2012: D+11.0 2008: D+12.2
Not yet ingested
- Civics
- —
Market trends
- HPI YoY
- ▼ -218.69%
- Current HPI
- 283.304
- Rent YoY
- —
- Metro
- Seattle-Tacoma-Bellevue, WA
- State GDP YoY
- ▲ 4.65%
- F500 in state
- 22
Industry mix (Fortune 500 HQ in WA)
| Industry | F500 HQs | Revenue |
|---|---|---|
| Retail | 2 | $269B |
|
||
| Technology / Retail | 1 | $638B |
|
||
| Technology | 1 | $245B |
|
||
| Telecommunications | 1 | $38B |
|
||
| Food / Beverage | 1 | $36B |
|
||
| Automotive / Trucks | 1 | $34B |
|
||
Price history
+130.9% since first listed19 events — show timeline
- 2026-04-02 Listed $300,000 NWMLS as Distributed by MLS Grid
- 2019-09-12 Sold (Public Records) $240,000 Public Records
- 2019-09-12 Sold (MLS) $240,000 NWMLS as Distributed by MLS Grid
- 2019-08-21 Pending — NWMLS as Distributed by MLS Grid
- 2019-08-13 Pending — NWMLS as Distributed by MLS Grid
- 2019-08-09 Price Changed $240,000 NWMLS as Distributed by MLS Grid
- 2019-07-25 Price Changed $242,500 NWMLS as Distributed by MLS Grid
- 2019-05-30 Relisted — NWMLS as Distributed by MLS Grid
- 2019-05-24 Pending — NWMLS as Distributed by MLS Grid
- 2019-04-17 Listed $245,000 NWMLS as Distributed by MLS Grid
- 2012-04-11 Sold (Public Records) $79,000 Public Records
- 2012-04-11 Sold (MLS) $79,000 NWMLS as Distributed by MLS Grid
- 2012-01-25 Pending — NWMLS as Distributed by MLS Grid
- 2012-01-13 Price Changed $89,000 NWMLS as Distributed by MLS Grid
- 2011-12-23 Relisted — NWMLS as Distributed by MLS Grid
- 2011-12-09 Pending — NWMLS as Distributed by MLS Grid
- 2011-11-17 Price Changed $95,000 NWMLS as Distributed by MLS Grid
- 2011-09-02 Price Changed $109,000 NWMLS as Distributed by MLS Grid
- 2011-05-06 Listed $129,900 NWMLS as Distributed by MLS Grid
Property tax history
+4.4%/yrLatest (2026): $2,706 · -0.1% YoY. Source: county tax records.
Cash-flow waterfall
monthlySold comps — $/sqft
last 12 mo · ≤1 miLoading sold comps…