 🏗️ New Construction
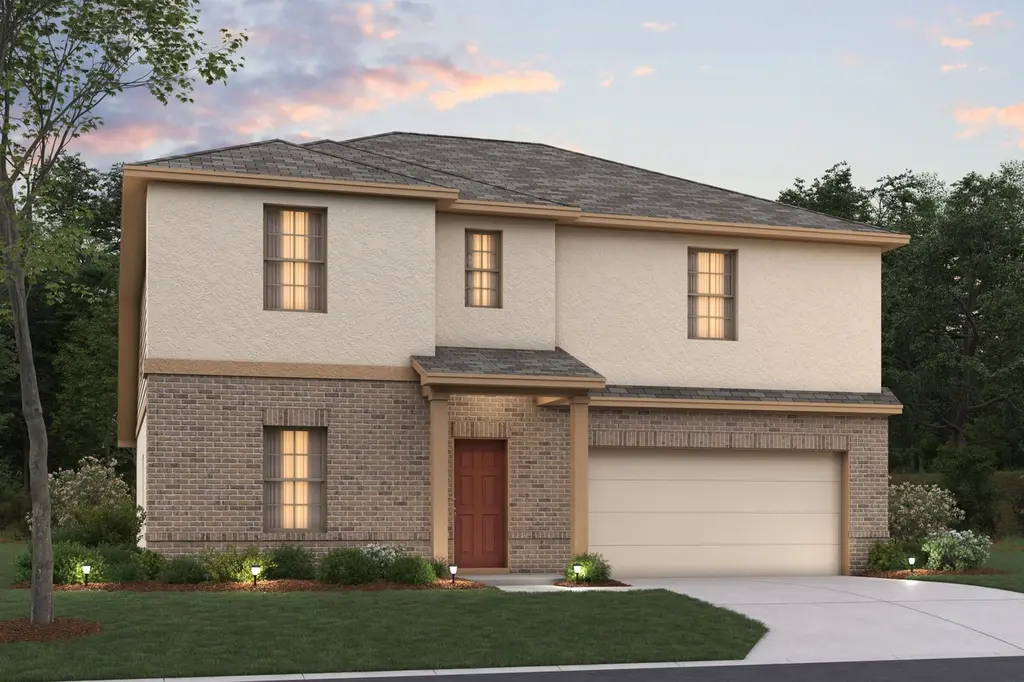
Columbus Plan · San Antonio, TX
Flood risk No data
- FEMA flood zone
- —
- Chance of flooding over 30 yrs
- —
- Est. flood insurance / yr
- —
Fire risk No data
- Est. fire insurance / yr
- —
Heat risk No data
- Hot days now (above threshold)
- —
- Hot days in 30 yrs
- —
Wind risk No data
- Chance of severe wind over 30 yrs
- —
Air-quality risk No data
- Unhealthy air days now
- —
- Unhealthy air days in 30 yrs
- —
Risk factors via First Street. Map © Google.
Why this score? — see what drove the D grade
The composite is a weighted blend of 9 inputs, each scored 0–100. Each bar is that input's sub-score; the figure is the points it added to the 100-point composite (weight × sub-score).
- Cash flow +9.0/30.0
- ARV discount +7.5/15.0
- Appreciation +5.0/10.0
- Schools +4.4/10.0
- Livability +4.0/5.0
- 1% rule +2.8/10.0
- DSCR +2.5/10.0
- Rent growth +2.5/5.0
- Condition / age +2.5/5.0
$364,990
🖨 Deal sheet (PDF) 📄 Offer letter ✓ Due diligence
Listing remarks
The Columbus is a 2-story home that boasts 2,848 square feet, and features 4-5 bedrooms, 2-3 bathrooms, and a 2- to 3-car garage.
Key facts
- 2 garage spots
- Listed 19 days
Property features AI
Finance
- Other: Address: 170 Stabler Sq, San Antonio TX 78056; Status: Active; Last updated: 2026-06-01
- Financial info: List price $364,990
Exterior
- Parking: 2 covered garage spaces (2 total parking spaces)
- Home design: New construction (Plan: Columbus); Single-family residence
- Exterior features: Living area approximately 2819 (per plan)
Interior
- Kitchen: Standard kitchen included (details on plan)
- Bedrooms: 4 bedrooms
- Bathrooms: 2 full bathrooms and 1 half bathroom
- Interior features: Open plan living areas (plan: Columbus)
Neighborhood map
What this means for you Summary
Snapshot
- This is a 4-bed/2.5-bath single-family listed at $365k.
Deal economics
- At list price, monthly cash flow is $-287 ($-3k/yr) — negative.
- To cash-flow at today's rent, offer at most $324k (11.4% below list).
- To meet the 1% rule (rent ≥ 1% of price), the offer needs to be $283k (22.5% below list).
- Recommended offer: $283k (22.5% below list) — sets the bar for 1% rule.
- Cap rate 5.4% vs local median 3.8% in San Antonio — top-decile yield for the area; either an underpriced asset or a hidden risk that comps aren't pricing in. Stress-test before assuming the spread holds.
Location & tenants
- Location reads 80/100 on livability (#31 in TX, #1,616 nationally) — a professional / high-income tenant draw. Strengths: amenities A+, commute A+, cost of living A+; Watch: crime F.
- Medina Valley ISD (rural): math 48% / reading 53% proficiency, ranked #148 of 826 in TX (top 18%) — acceptable for families but not a draw, mixed tenant base, ~2y average lease.
- Zoned schools: Potranco El (math 50% / reading 51%, grade D+, #833 of 4,322 statewide, top 20%, 847 students, 47% FRL); Medina Valley Middle (math 47% / reading 49%, grade C-, #400 of 1,662 statewide, top 24%, 1,029 students, 62% FRL); Medina Valley H S (math 34% / reading 55%, grade F, #652 of 1,632 statewide, top 43%, 2,147 students, 51% FRL) — zoned schools at 53% FRL track the district average.
- Market conditions: 140 active listings in the ZIP; 102 units permitted in Medina County in 2024 (0 in 5+ unit buildings).
Forward outlook
- In year one you build about $3k of equity ($3k loan paydown + $150 appreciation (0.0% local appreciation)).
- Medina County population projected at +24% by 2050 — long-run rental-demand tailwind backs the buy-and-hold thesis.
- By year 9, paydown + projected appreciation supports a ~$32k cash-out refi (75% LTV) — recoverable capital for the next deal without selling this one.
Negotiation context
- It's been on market 20 days — a 2% lower offer ($360k) is reasonable based on typical stale-listing flexibility.
Questions for the listing agent
- What do current leases actually rent for vs. the listed asking? Can we see a recent rent roll and the last 12 months of T-12 income?
- Is there a deadline driving the sale (1031 exchange, divorce, estate, relocation)? That informs how much negotiation room exists.
- Crime grade is F in this area — have there been break-ins, vandalism, or insurance claims at this property in the last 3 years? What carrier currently insures it and at what premium?
- The area grade is low — what's the realistic commute time and amenity access for the typical tenant pool here? Any planned neighborhood developments (good or bad) we should know about?
- What's the average days-on-market for RENTAL listings here right now (not sales)? A rising rental-DOM trend means longer vacancies and softer asking-rent achievability than the comps imply.
- What's the recent tenant-quality profile in this submarket — average credit score on applications, eviction rate, late-payment / NSF rate, and stable-employment percentage? A property-management company in the area should have these aggregated.
- How much new for-sale + rental construction is in the pipeline within 1–3 miles? Heavy new supply typically softens prices + rents 12–24 months out; constrained supply supports both.
Investment metrics
- 1% rule
- 0.78% ✗
- Cap rate
- 5.35%
- Cash-on-cash
- -3.37%
- DSCR
- 0.85
- GRM
- 10.7
CMA / ARV
No comps found within radius.
Projected returns pro-forma
0.04% appreciation · 3.0% rent growth · sell at horizon
- IRR
- -5.9%
- Equity multiple
- 0.72×
- Total profit
- $-28,185
- Equity at exit
- $106,731
- IRR
- 0.1%
- Equity multiple
- 1.01×
- Total profit
- $805
- Equity at exit
- $128,894
Cash invested: $102,197 (down + closing). Projections, not guarantees.
Landlord ↔ Tenant lean methodology
- Overall (STATE)
- 87 Strongly Landlord-Friendly
- State Texas
- 87 Strongly Landlord-Friendly · R+5
- County
- — inherits STATE
- City
- — inherits STATE
ZIP-level market 78056
- Home prices YoY
- 0.0%
- Active inventory
- 140
- Price-to-rent
- 10.7×
Monthly cashflow live
- Estimated rent
- $2,830 medium interval (Pro) →
- Mortgage (P&I)
- −$1,914
- Tax est. 1.5%
- −$456 /mo · $5,475/yr
- Insurance
- −$152
- HOA
- −$0
- Lot rent
- −$0
- Vacancy / Maint / Mgmt
- −$594
- Net cashflow
- $-287
Break-even live
Sensitivity live
| Price | -10% $-34 | -5% $-160 | +0% $-287 | +5% $-413 | +10% $-539 |
|---|---|---|---|---|---|
| Rent | -10% $-510 | -5% $-398 | +0% $-287 | +5% $-175 | +10% $-63 |
| Rate | -1.0pp $-103 | -0.5pp $-194 | base $-287 | +0.5pp $-381 | +1.0pp $-477 |
UW: 25.0% down · 7.5% · 30yr · 1.5% tax · 5.0% vac · 8.0% maint · 8.0% mgmt
Financing live
Cash to close
- Down payment
- $91,248
- Closing costs
- $10,950
- Reserves months
- —
- Total cash needed
- —
Loan-product check · same deal, 3 products live
Conventional
25% down · 7.5% · 30yr
- Down + closing
- —
- Monthly P&I
- —
- Monthly cashflow
- —
- DSCR
- —
- Eligible?
- —
Personal DTI + credit; lowest rate.
DSCR
20% down · 8.5% · 30yr
- Down + closing
- —
- Monthly P&I
- —
- Monthly cashflow
- —
- DSCR
- —
- Eligible?
- —
No personal income docs; deal must DSCR.
Hard money
10% down · 12.0% · 12mo
- Down + closing
- —
- Monthly P&I
- —
- Monthly cashflow
- —
- DSCR
- —
- Eligible?
- —
Short-term bridge; refi at stabilization.
Listing history 14 events
-
2026-06-22days on market $364,990 Active 20 DOM
-
2026-06-21days on market $364,990 Active 19 DOM
-
2026-06-18days on market $364,990 Active 16 DOM
-
2026-06-17days on market $364,990 Active 15 DOM
-
2026-06-16days on market $364,990 Active 14 DOM
-
2026-06-15days on market $364,990 Active 13 DOM
-
2026-06-13days on market $364,990 Active 11 DOM
-
2026-06-09days on market $364,990 Active 8 DOM
-
2026-06-08days on market $364,990 Active 7 DOM
-
2026-06-07days on market $364,990 Active 6 DOM
-
2026-06-04days on market $364,990 Active 3 DOM
-
2026-06-03days on market $364,990 Active 2 DOM
-
2026-06-02remarks 129-char remark
-
2026-06-02$364,990 Active 1 DOM
ⓘ Source: listings_history table (triggers on properties + properties_extension) + one-shot
backfill from property_details.listing_events for pre-trigger history.
Nearby sold comps map
Loading sold comps map…
Walkable amenities ~0.75 mi
Loading nearby amenities…
Taxation est. · year 1
- Rental income
- $33,961
- − Mortgage interest
- −$20,445
- − Property taxes
- −$5,475
- − Insurance
- −$1,825
- − Repairs & maintenance
- −$2,717
- − Management
- −$2,717
- − Depreciation
- −$10,618
- Taxable loss
- −$9,836
- Est. tax savings @ 24.0%
- +$2,361
- After-tax cash flow
- $-1,079/yr
For passive investors: Depreciation is non-cash, so a rental often shows a tax loss while cash-flowing — sheltering income. Rental losses are passive: they offset passive income freely, and up to $25,000/yr can offset ordinary (W-2) income if you actively participate and your MAGI is under $100k (phasing out to $0 by $150k); unused losses carry forward. On sale, claimed depreciation is recaptured at up to 25%, and gains may owe capital-gains tax (a 1031 exchange can defer both). Figures are a year-1 estimate at your 24.0% rate — not tax advice; consult a CPA.
Schools (NCES district)
- District
- Medina Valley ISD
- NCES district ID
- 4830060
- Math proficiency
- 48% ▼ -9.00%
- Reading proficiency
- 53% ▼ -2.00%
- Median HH income
- $60,596
- Composite
- 44.2/100
- National rank
- #2851
- State rank
- #148 of 826 in TX
Livability — San Antonio
- Score
- 80/100
- State rank
- #31
- US rank
- #1616
Category grades
Schools grade is shown separately in the Schools card above.
Census & demographics
- City population
- 1,806,925
- Population (ZIP)
- 2,431
Population outlook (Medina County) Hauer SSP2
- Today (2025)
- 54,332 people
- By 2030
- 57,250 · +5.4%
- By 2040
- 62,563 · +15.1%
- By 2050
- 67,386 · +24.0%
- By 2075
- 79,538 · +46.4%
- By 2100
- 84,624 · +55.8%
Race, ethnicity, and origin ACS 2023
- Neighborhood character
- Predominantly White (66%)
- Race & ethnicity
- White 66% Hispanic / Latino 27% Two or more races 15% Native American 1%
- Hispanic origin (detail)
- Mexican 24%
- Common ancestry
- Romanian 13% Lithuanian 7% Scottish 6%
- Foreign-born
- 8% · Canada
- Languages at home
- 86% English-only · Spanish 11% French/Haitian/Cajun 1%
Political lean MEDSL · Medina
- 2024 margin
- Solid R (+42.8) · D 28.2% · R 71.0%
- 2008→2024 swing
- -8.9pp toward R · 2008: -33.9pp · 2024: -42.8pp
- All cycles
- 2024: R+42.8 2020: R+39.2 2016: R+43.2 2012: R+39.2 2008: R+33.9
Not yet ingested
- Civics
- —
Market trends
- HPI YoY
- ▬ 0.04%
- Current HPI
- 219.5947
- Rent YoY
- —
- Metro
- —
- State GDP YoY
- ▲ 3.95%
- F500 in state
- 110
Industry mix (Fortune 500 HQ in TX)
| Industry | F500 HQs | Revenue |
|---|---|---|
| Energy | 16 | $1,198B |
|
||
| Technology | 5 | $198B |
|
||
| Engineering / Construction | 4 | $72B |
|
||
| Energy Services | 3 | $60B |
|
||
| Utilities | 3 | $41B |
|
||
| Healthcare | 2 | $330B |
|
||
Cash-flow waterfall
monthlySold comps — $/sqft
last 12 mo · ≤1 miLoading sold comps…