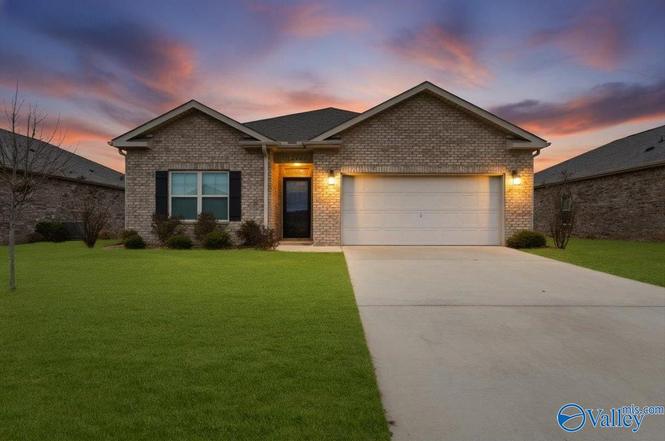
16205 Glenncrest Ln · Huntsville, AL
Flood risk No data
- FEMA flood zone
- —
- Chance of flooding over 30 yrs
- —
- Est. flood insurance / yr
- —
Fire risk No data
- Est. fire insurance / yr
- —
Heat risk No data
- Hot days now (above threshold)
- —
- Hot days in 30 yrs
- —
Wind risk No data
- Chance of severe wind over 30 yrs
- —
Air-quality risk No data
- Unhealthy air days now
- —
- Unhealthy air days in 30 yrs
- —
Risk factors via First Street. Map © Google.
Why this score? — see what drove the D grade
The composite is a weighted blend of 9 inputs, each scored 0–100. Each bar is that input's sub-score; the figure is the points it added to the 100-point composite (weight × sub-score).
- Cash flow +11.9/30.0
- ARV discount +10.8/15.0
- Livability +4.1/5.0
- DSCR +3.5/10.0
- Schools +2.9/10.0
- Rent growth +2.7/5.0
- 1% rule +2.5/10.0
- Condition / age +2.5/5.0
- Appreciation +0.0/10.0
$290,000
🖨 Deal sheet (PDF) 📄 Offer letter ✓ Due diligence
Listing remarks MLS
Move-in ready! Newer home with 4 bedrooms and 2 full bathrooms! Easy to maintain flat lot and double car garage! LVP in the main living areas and carpet in the bedroom and tile in the bathrooms. Granite countertops and higher end fixtures! Stainless steel appliances and pendant lighting! Enjoy entertaining on the screened in porch in your private yard!
Key facts
- Screened in porch
- Flat lot
- Private fenced yard
Tags
Neighborhood map
What this means for you Summary
Snapshot
- This is a 4-bed/2.0-bath single-family listed at $290k.
Deal economics
- At list price, monthly cash flow is $-73 ($-878/yr) — negative.
- To cash-flow at today's rent, offer at most $277k (4.5% below list).
- To meet the 1% rule (rent ≥ 1% of price), the offer needs to be $219k (24.6% below list).
- Recommended offer: $219k (24.6% below list) — sets the bar for 1% rule.
- Cap rate 6.0% vs local median 3.8% in Huntsville — top-decile yield for the area; either an underpriced asset or a hidden risk that comps aren't pricing in. Stress-test before assuming the spread holds.
Location & tenants
- Location reads 82/100 on livability (#3 in AL, #1,082 nationally) — a professional / high-income tenant draw. Strengths: commute A+, cost of living A+, housing A+; Watch: crime F.
- Huntsville City (urban): math 21% / reading 46% proficiency, ranked #48 of 129 in AL (top 37%) — families likely to look elsewhere, expect single-tenant / working-renter base with shorter leases.
- Market conditions: Rents flat; 675 active listings in the ZIP; 10 comparable units currently listed for rent nearby; rentals at typical pace (median 25d on market — plan ~3-4 weeks tenant-placement turnaround); 40% of comp listings sitting > 30 days — soft ceiling on asking rent; solid renter incomes; 494 units permitted in Limestone County in 2024 (0 in 5+ unit buildings).
Forward outlook
- Local home prices are declining (-3.0%/yr); year-one equity from $2k of loan paydown is wiped out by about $9k of value loss. Plan a longer hold.
- Limestone County population projected at +43% by 2050 — long-run rental-demand tailwind backs the buy-and-hold thesis.
Negotiation context
- It's been on market 113 days — a 9% lower offer ($264k) is reasonable based on typical stale-listing flexibility.
- 4 sale attempts since 5y ago with the ask held roughly flat each time — persistent listings suggest the price (not the market) is what's stuck; bring a comps-based counter.
Questions for the listing agent
- What do current leases actually rent for vs. the listed asking? Can we see a recent rent roll and the last 12 months of T-12 income?
- It's been on market 113 days. Have you received any prior offers? Is the seller open to a 25% concession, seller financing, or rate buy-down credit?
- What does the HOA fee cover, when was the last increase, and are there any pending special assessments or reserve-fund shortfalls?
- Why hasn't it sold? Are there any deal-killer items the seller is aware of (foundation, flood, title, zoning, code violations)?
- Is there a deadline driving the sale (1031 exchange, divorce, estate, relocation)? That informs how much negotiation room exists.
- Crime grade is F in this area — have there been break-ins, vandalism, or insurance claims at this property in the last 3 years? What carrier currently insures it and at what premium?
- The area grade is low — what's the realistic commute time and amenity access for the typical tenant pool here? Any planned neighborhood developments (good or bad) we should know about?
- What's the average days-on-market for RENTAL listings here right now (not sales)? A rising rental-DOM trend means longer vacancies and softer asking-rent achievability than the comps imply.
- What's the recent tenant-quality profile in this submarket — average credit score on applications, eviction rate, late-payment / NSF rate, and stable-employment percentage? A property-management company in the area should have these aggregated.
- How much new for-sale + rental construction is in the pipeline within 1–3 miles? Heavy new supply typically softens prices + rents 12–24 months out; constrained supply supports both.
Investment metrics
- 1% rule
- 0.75% ✗
- Cap rate
- 5.99%
- Cash-on-cash
- -1.08%
- DSCR
- 0.95
- GRM
- 11.0
CMA / ARV
- ARV (median comp)
- $312,885
- List price
- $290,000
- Delta
- -7.31%
- Verdict
- FAIR
- Comps
- 20 within 1.0 mi
Show comp detail 12 sales within ~0.75 mi
| Address | Dist | Beds/Ba | Sqft | Sold | Price | $/sf | Match |
|---|---|---|---|---|---|---|---|
| 1120 Tanger Glen Trl NW | 0.45mi | 3/2.5 (-1) | 1,909 (+4%) | 1mo | $278,620 | $146 | 64 |
| 1121 Tanger Glen Trl NW | 0.47mi | 3/2.5 (-1) | 1,909 (+4%) | 2mo | $269,995 | $141 | 62 |
| 1116 Tanger Glen Trl NW | 0.47mi | 3/2.5 (-1) | 1,933 (+6%) | 2mo | $288,720 | $149 | 60 |
| 1114 Tanger Glen Trl NW | 0.47mi | 3/2.5 (-1) | 1,933 (+6%) | 2mo | $288,950 | $149 | 60 |
| 1016 Highgrove Hts | 0.57mi | 3/2.5 (-1) | 1,900 (+4%) | 1mo | $260,000 | $137 | 59 |
| 1119 Tanger Glen Trl NW | 0.48mi | 3/2.5 (-1) | 1,933 (+6%) | 3mo | $283,555 | $147 | 59 |
| 29471 Canoe Cir | 0.74mi | 4/2.0 | 1,964 (+8%) | 2mo | $319,900 | $163 | 52 |
| 29517 Crawfish Dr | 0.56mi | 3/2.0 (-1) | 1,620 (-11%) | 2mo | $314,886 | $194 | 48 |
| 387 Sandy Oak Dr | 0.63mi | 4/3.0 | 2,019 (+10%) | 1mo | $343,900 | $170 | 48 |
| 16353 Blue Water Way | 0.61mi | 3/2.0 (-1) | 1,620 (-11%) | 1mo | $293,000 | $181 | 47 |
| 29440 Crawfish Dr | 0.64mi | 3/2.0 (-1) | 1,620 (-11%) | 1mo | $304,011 | $188 | 45 |
| 390 Sandy Oak Dr | 0.74mi | 4/3.0 | 2,019 (+10%) | 2mo | $342,900 | $170 | 42 |
Match score weights: distance 35% · size 25% · config 20% · recency 20%. Top-matched comps best support the ARV.
Projected returns pro-forma
-3.0% appreciation · 0.81% rent growth · sell at horizon
- IRR
- -20.3%
- Equity multiple
- 0.30×
- Total profit
- $-56,462
- Equity at exit
- $43,240
- IRR
- -18.5%
- Equity multiple
- 0.09×
- Total profit
- $-74,063
- Equity at exit
- $25,074
Cash invested: $81,200 (down + closing). Projections, not guarantees.
Landlord ↔ Tenant lean methodology
- Overall (STATE)
- 90 Strongly Landlord-Friendly
- State Alabama
- 90 Strongly Landlord-Friendly · R+15
- County
- — inherits STATE
- City
- — inherits STATE
ZIP-level market 35749
- Home prices YoY
- -5.4%
- Rents YoY
- 0.8%
- Active inventory
- 675
- Price-to-rent
- 11.0×
Monthly cashflow live
- Estimated rent
- $2,187 high interval (Pro) →
- Mortgage (P&I)
- −$1,521
- Tax from tax record
- −$152 /mo · $1,829/yr
- Insurance
- −$121
- HOA
- −$7
- Vacancy / Maint / Mgmt
- −$459
- Net cashflow
- $-73
Break-even live
Sensitivity live
| Price | -10% $91 | -5% $9 | +0% $-73 | +5% $-155 | +10% $-237 |
|---|---|---|---|---|---|
| Rent | -10% $-246 | -5% $-160 | +0% $-73 | +5% $13 | +10% $100 |
| Rate | -1.0pp $73 | -0.5pp $1 | base $-73 | +0.5pp $-148 | +1.0pp $-225 |
UW: 25.0% down · 7.5% · 30yr · 1.5% tax · 5.0% vac · 8.0% maint · 8.0% mgmt
Financing live
Cash to close
- Down payment
- $72,500
- Closing costs
- $8,700
- Reserves months
- —
- Total cash needed
- —
Loan-product check · same deal, 3 products live
Conventional
25% down · 7.5% · 30yr
- Down + closing
- —
- Monthly P&I
- —
- Monthly cashflow
- —
- DSCR
- —
- Eligible?
- —
Personal DTI + credit; lowest rate.
DSCR
20% down · 8.5% · 30yr
- Down + closing
- —
- Monthly P&I
- —
- Monthly cashflow
- —
- DSCR
- —
- Eligible?
- —
No personal income docs; deal must DSCR.
Hard money
10% down · 12.0% · 12mo
- Down + closing
- —
- Monthly P&I
- —
- Monthly cashflow
- —
- DSCR
- —
- Eligible?
- —
Short-term bridge; refi at stabilization.
Rent comps 10 comps
| Address | Beds | Baths | Sqft | Rent | $/sqft | DOM | Units | Dist |
|---|---|---|---|---|---|---|---|---|
| 29889 Glenrose Way Harvest, AL | 3.0 | 2.0 | 1670 | $1,600 | $0.96 | 25d | 1 | 0.29mi |
| 17331 Fieldway Cir Harvest, AL | 3.0 | 2.0 | 1648 | $1,800 | $1.09 | 23d | 1 | 0.33mi |
| 30199 Plantation Park Dr NW Harvest, AL | 5.0 | 3.0 | 2565 | $3,000 | $1.17 | 25d | 1 | 0.42mi |
| 30000 Abbeywood Ln Harvest, AL | 3.0 | 2.0 | 1618 | $1,600 | $0.99 | 25d | 1 | 0.48mi |
| 106 Smith Vasser Rd Harvest, AL | 4.0 | 3.0 | 2620 | $2,300 | $0.88 | 45d | 1 | 0.67mi |
| 227 Poplar Hollow Dr Harvest, AL | 4.0 | 3.0 | 2108 | $2,100 | $1.00 | 45d | 1 | 0.72mi |
| 29419 Canoe Cir NW Harvest, AL | 4.0 | 2.5 | 1964 | $2,095 | $1.07 | 25d | 1 | 0.78mi |
| 15980 Trey Hughes Dr Harvest, AL | 4.0 | 2.5 | 1898 | $1,686 | $0.89 | 45d | 1 | 1.02mi |
| 15881 Elaine Ct Unit 1250617P Harvest, AL | 3.0 | 2.0 | 2497 | $4,891 | $1.96 | 15d | 1 | 1.10mi |
| 100 Gibbon Dr Harvest, AL | 3.0 | 2.0 | 1500 | $1,625 | $1.08 | 46d | 1 | 1.20mi |
HOA detail
- Monthly dues
- $7 · $84/yr
Listing history 22 events
-
2026-06-16statusdays on market $290,000 Pending 113 DOM
-
2026-06-15days on market $290,000 Contingent 112 DOM
-
2026-06-14days on market $290,000 Contingent 110 DOM
-
2026-06-10days on market $290,000 Contingent 107 DOM
-
2026-06-09days on market $290,000 Contingent 106 DOM
-
2026-06-08days on market $290,000 Contingent 105 DOM
-
2026-06-07days on market $290,000 Contingent 104 DOM
-
2026-06-03days on market $290,000 Contingent 100 DOM
-
2026-06-02days on market $290,000 Contingent 99 DOM
-
2026-06-01days on market $290,000 Contingent 98 DOM
-
2026-05-31days on market $290,000 Contingent 97 DOM
-
2026-05-30days on market $290,000 Contingent 96 DOM
-
2026-05-12historical Contingent 354-char remark
Show marketing remark (354 chars)
Move-in ready! Newer home with 4 bedrooms and 2 full bathrooms! Easy to maintain flat lot and double car garage! LVP in the main living areas and carpet in the bedroom and tile in the bathrooms. Granite countertops and higher end fixtures! Stainless steel appliances and pendant lighting! Enjoy entertaining on the screened in porch in your private yard!
-
2026-04-30status Active 354-char remark
Show marketing remark (354 chars)
Move-in ready! Newer home with 4 bedrooms and 2 full bathrooms! Easy to maintain flat lot and double car garage! LVP in the main living areas and carpet in the bedroom and tile in the bathrooms. Granite countertops and higher end fixtures! Stainless steel appliances and pendant lighting! Enjoy entertaining on the screened in porch in your private yard!
-
2026-03-01status Pending 354-char remark
Show marketing remark (354 chars)
Move-in ready! Newer home with 4 bedrooms and 2 full bathrooms! Easy to maintain flat lot and double car garage! LVP in the main living areas and carpet in the bedroom and tile in the bathrooms. Granite countertops and higher end fixtures! Stainless steel appliances and pendant lighting! Enjoy entertaining on the screened in porch in your private yard!
-
2025-12-27$290,000 Active 354-char remark
Show marketing remark (354 chars)
Move-in ready! Newer home with 4 bedrooms and 2 full bathrooms! Easy to maintain flat lot and double car garage! LVP in the main living areas and carpet in the bedroom and tile in the bathrooms. Granite countertops and higher end fixtures! Stainless steel appliances and pendant lighting! Enjoy entertaining on the screened in porch in your private yard!
-
2025-12-19historical $1,850
-
2025-11-20price $1,850
-
2025-11-13price $1,950
-
2025-11-11price $1,750
-
2025-11-01$1,950
-
2021-09-10$260,225
ⓘ Source: listings_history table (triggers on properties + properties_extension) + one-shot
backfill from property_details.listing_events for pre-trigger history.
Tax reassessment forecast AL · Resets to sale price
- Current annual tax
- $1,829 · $152/mo
- Projected year-2 tax
- $1,829 · $152/mo
- Expected delta
- $0/yr ($0/mo · 0.0%)
ⓘ Screening estimate from a state-policy table — verify with the county assessor before closing.
Nearby sold comps map
Loading sold comps map…
Walkable amenities ~0.75 mi
Loading nearby amenities…
Taxation est. · year 1
- Rental income
- $26,245
- − Mortgage interest
- −$16,245
- − Property taxes
- −$1,829
- − Insurance
- −$1,450
- − Repairs & maintenance
- −$2,100
- − Management
- −$2,100
- − HOA
- −$84
- − Depreciation
- −$8,436
- Taxable loss
- −$5,997
- Est. tax savings @ 24.0%
- +$1,439
- After-tax cash flow
- $561/yr
For passive investors: Depreciation is non-cash, so a rental often shows a tax loss while cash-flowing — sheltering income. Rental losses are passive: they offset passive income freely, and up to $25,000/yr can offset ordinary (W-2) income if you actively participate and your MAGI is under $100k (phasing out to $0 by $150k); unused losses carry forward. On sale, claimed depreciation is recaptured at up to 25%, and gains may owe capital-gains tax (a 1031 exchange can defer both). Figures are a year-1 estimate at your 24.0% rate — not tax advice; consult a CPA.
Schools (NCES district)
- District
- Huntsville City
- NCES district ID
- 0101800
- Math proficiency
- 21% ▼ -23.00%
- Reading proficiency
- 46% ▬ 0.00%
- Median HH income
- $48,264
- Composite
- 28.84/100
- National rank
- #6647
- State rank
- #48 of 129 in AL
Livability — Huntsville
- Score
- 82/100
- State rank
- #3
- US rank
- #1082
Category grades
Schools grade is shown separately in the Schools card above.
Census & demographics
- Census place
- Huntsville, AL
- County
- Madison County · 380,832 people
- City population
- 220,435
- Metro
- Huntsville, AL
- Population (ZIP)
- 30,710
- Household income
- $103,901
- Rent vs Own
- Severe rent burden
- 174.0
Population outlook (Limestone County) Hauer SSP2
- Today (2025)
- 111,441 people
- By 2030
- 121,272 · +8.8%
- By 2040
- 140,705 · +26.3%
- By 2050
- 159,069 · +42.7%
- By 2075
- 202,231 · +81.5%
- By 2100
- 230,608 · +106.9%
Race, ethnicity, and origin ACS 2023
- Neighborhood character
- Diverse neighborhood (Simpson 0.56)
- Race & ethnicity
- White 60% Black 29% Two or more races 7% Hispanic / Latino 4% Asian 2%
- Common ancestry
- Italian 2% Slovak 1% Serbian 1%
- Foreign-born
- 3% · Canada, South Korea
- Languages at home
- 95% English-only · Spanish 3% Korean 1% Other Indo-European 1%
Political lean MEDSL · Limestone
- 2024 margin
- Solid R (+43.9) · D 27.5% · R 71.4% · Other 1.2%
- 2008→2024 swing
- -2.0pp toward R · 2008: -41.9pp · 2024: -43.9pp
- All cycles
- 2024: R+43.9 2020: R+42.6 2016: R+49.5 2012: R+43.6 2008: R+41.9
Not yet ingested
- Civics
- —
Market trends
- HPI YoY
- ▼ -16.54%
- Current HPI
- 291.1184
- Rent YoY
- ▲ 0.81%
- Metro
- Huntsville, AL
- State GDP YoY
- ▲ 2.94%
- F500 in state
- 4
Industry mix (Fortune 500 HQ in AL)
| Industry | F500 HQs | Revenue |
|---|---|---|
| Financial Services | 1 | $8B |
|
||
| Healthcare | 1 | $5B |
|
||
Price history
+11.4% since first listed10 events — show timeline
- 2026-05-12 Contingent — VMLS
- 2026-04-30 Relisted — VMLS
- 2026-03-01 Pending — VMLS
- 2025-12-27 Listed $290,000 VMLS
- 2025-12-19 Rental Removed $1,850 VMLS
- 2025-11-20 Price Changed $1,850 VMLS
- 2025-11-13 Price Changed $1,950 VMLS
- 2025-11-11 Price Changed $1,750 VMLS
- 2025-11-01 Listed for Rent $1,950 VMLS
- 2021-09-10 Listed $260,225 VMLS
Property tax history
+7.0%/yrLatest (2025): $1,829 · +14.5% YoY. Source: county tax records.
Cash-flow waterfall
monthlySold comps — $/sqft
last 12 mo · ≤1 miLoading sold comps…