 Triplex
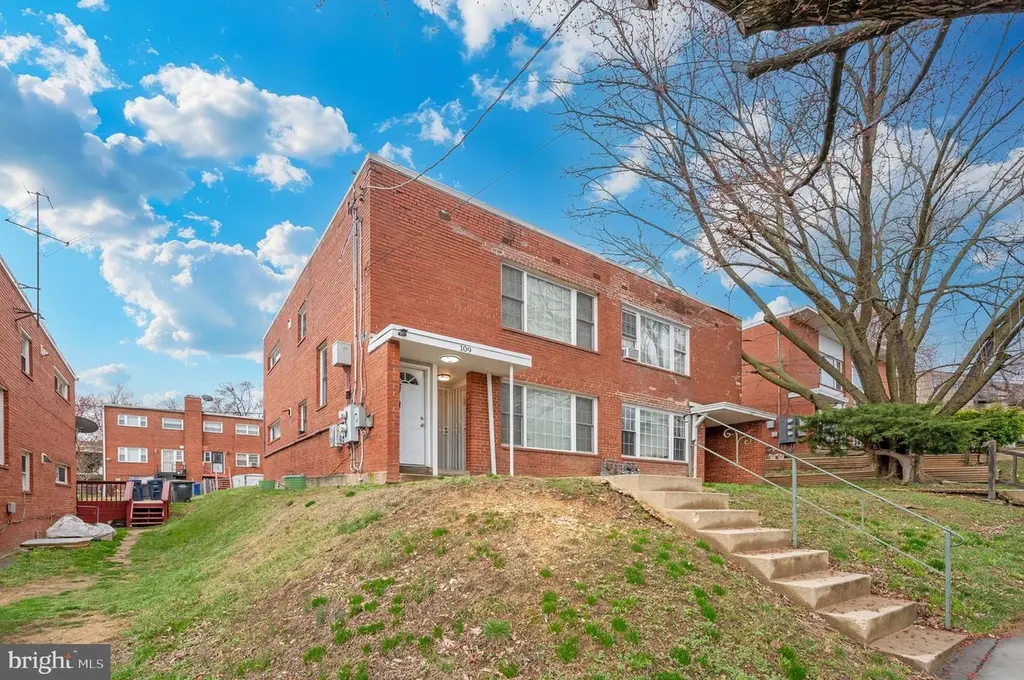
109 Webster St NE · Washington, DC
Flood risk 1/10 · Minimal
- FEMA flood zone
- X (unshaded)
- Chance of flooding over 30 yrs
- 0.0%
- Est. flood insurance / yr
- $473 – $860
Fire risk 1/10 · Minimal
- Est. fire insurance / yr
- $631 – $1,173
Heat risk 7/10 · Major
- Hot days now (above 104°F)
- 7 days/yr
- Hot days in 30 yrs
- 15 days/yr
Wind risk 4/10 · Minor
- Chance of severe wind over 30 yrs
- 19.0%
Air-quality risk 4/10 · Minor
- Unhealthy air days now
- 4 days/yr
- Unhealthy air days in 30 yrs
- 5 days/yr
Risk factors via First Street. Map © Google.
Why this score? — see what drove the C+ grade
The composite is a weighted blend of 9 inputs, each scored 0–100. Each bar is that input's sub-score; the figure is the points it added to the 100-point composite (weight × sub-score).
- Cash flow +28.7/30.0
- DSCR +10.0/10.0
- 1% rule +7.0/10.0
- ARV discount +4.1/15.0
- Livability +3.7/5.0
- Schools +3.6/10.0
- Rent growth +2.9/5.0
- Condition / age +2.5/5.0
- Appreciation +0.0/10.0
$650,000
🖨 Deal sheet 📄 Offer letter ✓ Due diligence
Multi-family units
County records classify this as Multi-Family (2-4 Unit). Listing-text estimate: 3 units. confirmed
Listing remarks MLS
Cash flow positive investment with C of O. The home conveys fee simple as one address but the owner has a C of O and rents the property as (2) one bedroom/one bath units. Each unit has its on HVAC system, metered electric, washer/dryer, kitchen, etc. and is the perfect rental with great value in a booming location. One of the units is occupied (#1) and the other (#2) is vacant but sum of rents exceeded $2750/mth. Great long-term upside with immediate cash flow that is updated and ready to be purchased. Open House Sat, February 8th from 12-3PM.
Key facts
- Owned solar panels
- Private parking
- New roof
Tags
Property features AI
Finance
- Other: Assessor-provided finished above-grade area: 1,350; Assessor-provided finished below-grade area: 650; Assessor-provided total below-grade area: 675; Unfinished below-grade area reported as 25; Year built source reported by assessor; Land and improvement assessed values recorded
- Financial info: Ownership is fee simple
Exterior
- Parking: Driveway parking; Off-site parking available; On-street parking
- Utilities: Public water; Public sewer; Electric service
- Home design: Semi-detached property
- Construction: Brick construction; Brick/mortar foundation; Above-grade and below-grade structures
- Exterior features: Public water and public sewer; No tidal water on the property; Below-grade finished space and unfinished area
Interior
- Bedrooms: Three one-bedroom units
- Heating & cooling: Central heating; Natural gas heating; Central air conditioning; Electric-powered cooling; Tankless hot water
- Interior features: Semi-detached structure with both above-grade and below-grade spaces; Total of 3 residential units (3 one-bedroom units); Two of the units currently leased
Neighborhood map
What this means for you Summary
Snapshot
- This is a 3 × 3-bed/1.0-bath units multifamily listed at $650k.
Deal economics
- At list price, monthly cash flow is $2k ($26k/yr) — positive. Per door: $724/mo.
- The deal already cash-flows at list — no discount required.
- Meets the 1% rule at list price ($8k rent vs $650k).
- Recommended offer: $611k (6.0% below list) — sets the bar for market timing.
- Cap rate 10.3% vs local median 2.5% in Washington — top-decile yield for the area; either an underpriced asset or a hidden risk that comps aren't pricing in. Stress-test before assuming the spread holds.
Location & tenants
- Location reads 73/100 on livability (#1 in DC) — a middle-class / working-renter tenant base. Strengths: amenities A+, commute A+, employment A+; Watch: crime F, cost of living F.
- District Of Columbia Public Schools (urban): math 33% / reading 40% proficiency, ranked #8 of 32 in DC (top 25%) — families likely to look elsewhere, expect single-tenant / working-renter base with shorter leases; 65% free/reduced lunch — lower-income household profile, screen leases tightly.
- Market conditions: Rents rising (+1.4%/yr); 370 active listings in the ZIP; 40 comparable units currently listed for rent nearby; rentals at typical pace (median 19d on market — plan ~3-4 weeks tenant-placement turnaround); high-income renter base; 1,737 units permitted in District of Columbia in 2024 (1,506 in 5+ unit buildings).
- At $7,808/mo this rent would consume 85% of the median local household income ($110k/yr) (locally 3020% of renters already pay >50% of income on rent) — very limited rent-growth headroom before tenants either downsize or default.
Forward outlook
- Local home prices are declining (-3.0%/yr); year-one equity from $4k of loan paydown is wiped out by about $20k of value loss. Plan a longer hold.
- District of Columbia County population projected at +50% by 2050 — long-run rental-demand tailwind backs the buy-and-hold thesis.
- At projected returns (-3.0% appreciation + 1.4% rent growth), your $182k cash investment doubles in ~10 years — after that, you're playing with house money.
Negotiation context
- It's been on market 87 days — a 6% lower offer ($611k) is reasonable based on typical stale-listing flexibility.
- 5 sale attempts since 18y ago with the ask held roughly flat each time — persistent listings suggest the price (not the market) is what's stuck; bring a comps-based counter.
- Current owner paid $400k; list at $650k implies a 63% gain — meaningful room to come down on a strong offer.
Risks & watch-outs
- Watch-outs: built in 1953 — expect roof / HVAC / electrical / plumbing capex.
- Climate carrying-cost: extreme-heat days projected 7→15/yr by 2055 (HVAC capex compounding) — expect insurance premiums to compound above CPI over the hold.
Questions for the listing agent
- It's been on market 87 days. Have you received any prior offers? Is the seller open to a 6% concession, seller financing, or rate buy-down credit?
- Can we see the unit-by-unit rent roll, current vacancy, and any below-market leases? What's the average tenancy length?
- What capital expenditures (roof, boiler, parking lot, exteriors) have been made in the last 5 years, and what's planned in the next 2?
- Built in 1953 — when were the roof, HVAC, electrical panel, plumbing, and water heater last replaced?
- Why hasn't it sold? Are there any deal-killer items the seller is aware of (foundation, flood, title, zoning, code violations)?
- Is there a deadline driving the sale (1031 exchange, divorce, estate, relocation)? That informs how much negotiation room exists.
- Crime grade is F in this area — have there been break-ins, vandalism, or insurance claims at this property in the last 3 years? What carrier currently insures it and at what premium?
- What's the average days-on-market for RENTAL listings here right now (not sales)? A rising rental-DOM trend means longer vacancies and softer asking-rent achievability than the comps imply.
- What's the recent tenant-quality profile in this submarket — average credit score on applications, eviction rate, late-payment / NSF rate, and stable-employment percentage? A property-management company in the area should have these aggregated.
- How much new apartment / multifamily construction is in the pipeline within 1–3 miles? Heavy new supply (>2% of stock underway) typically softens rents 12–24 months out; light construction supports rent growth.
Investment metrics
- 1% rule
- 1.20% ✓
- Cap rate
- 10.30%
- Cash-on-cash
- 14.33%
- DSCR
- 1.64
- GRM
- 6.9
CMA / ARV
- ARV (on-the-fly)
- $603,872
- Comps found
- 2
Show comp detail 2 sales within ~0.75 mi
| Address | Dist | Beds/Ba | Sqft | Sold | Price | $/sf | Match |
|---|---|---|---|---|---|---|---|
| 32 Varnum St NE | 0.11mi | 3/3.0 (+1) | 1,406 (+5%) | 2mo | $635,000 | $452 | 79 |
| 4034 7th St NE | 0.56mi | 2/— | 1,380 (+3%) | 2mo | $499,000 | $362 | 66 |
Match score weights: distance 35% · size 25% · config 20% · recency 20%. Top-matched comps best support the ARV.
Projected returns pro-forma
-3.0% appreciation · 1.45% rent growth · sell at horizon
- IRR
- 3.0%
- Equity multiple
- 1.11×
- Total profit
- $20,882
- Equity at exit
- $96,917
- IRR
- 11.1%
- Equity multiple
- 1.81×
- Total profit
- $147,922
- Equity at exit
- $56,200
Cash invested: $182,000 (down + closing). Projections, not guarantees.
Landlord ↔ Tenant lean methodology
- Overall (CITY)
- 0 Strongly Tenant-Friendly
- State District of Columbia
- 12 Strongly Tenant-Friendly · D+43
- County
- — inherits STATE
- City Washington
- 0 Strongly Tenant-Friendly · D+43
ZIP-level market 20011
- Rents YoY
- 1.4%
- Active inventory
- 370
- Price-to-rent
- 20.8×
Monthly cashflow live
- Estimated rent
- $7,808 medium interval (Pro) →
- Mortgage (P&I)
- −$3,409
- Tax from tax record
- −$316 /mo · $3,792/yr
- Insurance
- −$271
- HOA
- −$0
- Vacancy / Maint / Mgmt
- −$1,640
- Net cashflow
- $2,173
Break-even live
3-unit breakdown (identical units grouped — click to expand)
| Units | Beds | Baths | Est. rent |
|---|---|---|---|
| 3× units | 3 | 1 | $7,809 |
| #1 | 3 | 1 | $2,603 |
| #2 | 3 | 1 | $2,603 |
| #3 | 3 | 1 | $2,603 |
| Total (3 units) | $7,808 | ||
UW: 25.0% down · 7.5% · 30yr · 1.5% tax · 5.0% vac · 8.0% maint · 8.0% mgmt
Financing live
Cash to close
- Down payment
- $162,500
- Closing costs
- $19,500
- Reserves months
- —
- Total cash needed
- —
Loan-product check · same deal, 3 products live
Conventional
25% down · 7.5% · 30yr
- Down + closing
- —
- Monthly P&I
- —
- Monthly cashflow
- —
- DSCR
- —
- Eligible?
- —
Personal DTI + credit; lowest rate.
DSCR
20% down · 8.5% · 30yr
- Down + closing
- —
- Monthly P&I
- —
- Monthly cashflow
- —
- DSCR
- —
- Eligible?
- —
No personal income docs; deal must DSCR.
Hard money
10% down · 12.0% · 12mo
- Down + closing
- —
- Monthly P&I
- —
- Monthly cashflow
- —
- DSCR
- —
- Eligible?
- —
Short-term bridge; refi at stabilization.
Rent comps 40 comps
| Address | Beds | Baths | Sqft | Rent | $/sqft | DOM | Units | Dist |
|---|---|---|---|---|---|---|---|---|
| 126 Webster St NE Unit 1 Washington, DC | 1.0 | 1.0 | 1152 | $1,500 | $1.30 | 24d | 1 | 0.03mi |
| 139 Hawaii Ave NE Washington, DC | 3.0 | 2.0 | 1728 | $3,600 | $2.08 | 15d | 1 | 0.05mi |
| 4510 2nd St NE Washington, DC | 1.0–2.0 | 1.0 | 750 | $1,699 | $2.27 | 3d | 8 | 0.06mi |
| 213 Hawaii Ave NE Unit 1 Washington, DC | 2.0 | 1.5 | 1120 | $2,750 | $2.46 | 18d | 1 | 0.09mi |
| 66 Allison St NE Unit 66 Washington, DC | 3.0 | 2.0 | 1545 | $3,500 | $2.27 | 24d | 1 | 0.22mi |
| 400 Taylor St NE Washington, DC | 2.0 | 1.0–1.5 | 955 | $2,008 | $2.10 | 1d | 10 | 0.26mi |
| 12 Hawaii Ave NE Washington, DC | 3.0 | 2.0 | 1650 | $4,000 | $2.42 | 24d | 1 | 0.27mi |
| 4607 N Capitol St NE Washington, DC | 3.0 | 1.5 | 1536 | $2,975 | $1.94 | 24d | 1 | 0.31mi |
| 215 Upshur St NW #1 Washington, DC | 2.0 | 2.0 | 925 | $1,995 | $2.16 | 24d | 1 | 0.52mi |
| 4044 7th St NE Unit 4 Washington, DC | 2.0 | 1.0 | 900 | $1,998 | $2.22 | 22d | 1 | 0.54mi |
| 639 Emerson St NE Washington, DC | 2.0 | 1.0 | 900 | $2,195 | $2.44 | 17d | 1 | 0.57mi |
| 639 Emerson St NE Washington, DC | 2.0 | 1.0 | 900 | $2,195 | $2.44 | 5d | 1 | 0.57mi |
| 5009 1st St NW Unit 3 Washington, DC | 3.0 | 1.0 | 900 | $3,000 | $3.33 | 24d | 1 | 0.61mi |
| 5009 1st St NW Unit 4 Washington, DC | 3.0 | 1.0 | 900 | $2,500 | $2.78 | 24d | 1 | 0.61mi |
| 310 Taylor St NW Washington, DC | 3.0 | 2.0 | 1728 | $4,200 | $2.43 | 24d | 1 | 0.62mi |
| 632 Faraday Pl NE Washington, DC | 2.0 | 1.0 | 1224 | $2,650 | $2.17 | 5d | 1 | 0.64mi |
| 5210 3rd St NE Washington, DC | 2.0 | 1.0–2.0 | 862 | $2,475 | $2.87 | 1d | 28 | 0.65mi |
| 4312 10th St NE Washington, DC | 3.0 | 2.5 | 1602 | $3,900 | $2.43 | 7d | 1 | 0.66mi |
| 400 Galloway St NE Washington, DC | 2.0 | 1.0–2.0 | 716 | $2,754 | $3.84 | 2d | 26 | 0.72mi |
| 333 Delafield Pl NW Apt 1 Washington, DC | 3.0 | 2.0 | 900 | $3,950 | $4.39 | 7d | 1 | 0.74mi |
| 5119 2nd St NW Unit 4 Washington, DC | 2.0 | 1.0 | 900 | $2,050 | $2.28 | 24d | 1 | 0.76mi |
| 5042 8th St NE Washington, DC | 3.0 | 2.0 | 1479 | $3,295 | $2.23 | 24d | 1 | 0.77mi |
| 4411 1/2 Illinois Ave NW Unit B Washington, DC | 1.0 | 1.0 | 945 | $2,350 | $2.49 | 24d | 1 | 0.80mi |
| 440 Delafield Pl NW Washington, DC | 3.0 | 2.5 | 1564 | $3,400 | $2.17 | 18d | 1 | 0.82mi |
| 440 Delafield Pl NW Washington, DC | 3.0 | 3.5 | 1564 | $3,400 | $2.17 | 18d | 1 | 0.82mi |
| 4450 Joseph Pl NE Washington, DC | 3.0 | 2.5 | 1460 | $4,095 | $2.80 | 24d | 1 | 0.82mi |
| 1228 Wynton Pl NE Unit NA Washington, DC | 3.0 | 2.5 | 1500 | $3,950 | $2.63 | 18d | 1 | 0.87mi |
| 4969 12th St NE Washington, DC | 3.0 | 2.0 | 1674 | $2,900 | $1.73 | 24d | 1 | 0.89mi |
| 625 Monroe St NE Washington, DC | 2.0 | 1.0–2.0 | 829 | $3,648 | $4.40 | 2d | 26 | 0.94mi |
| 607 Jefferson St NE Washington, DC | 3.0 | 1.5 | 1200 | $3,295 | $2.75 | 4d | 1 | 0.95mi |
| 5661 3rd St NE Washington, DC | 2.0 | 1.0–2.0 | 749 | $2,641 | $3.52 | 3d | 28 | 0.98mi |
| 3626 12th St NE Washington, DC | 1.0 | 1.0 | 1336 | $1,450 | $1.09 | 24d | 1 | 0.99mi |
| 3614 12th St NE Washington, DC | 1.0–2.0 | 1.0–2.0 | 695 | $3,400 | $4.89 | 14d | 2 | 1.01mi |
| 3614 12th St NE #7 Washington, DC | 2.0 | 2.0 | 898 | $3,400 | $3.79 | 7d | 1 | 1.01mi |
| 118 Longfellow St NW Washington, DC | 3.0 | 2.5 | 1803 | $7,804 | $4.33 | 1d | 1 | 1.01mi |
| 811 Upshur St NW #1 Washington, DC | 2.0 | 2.0 | 920 | $2,650 | $2.88 | 24d | 1 | 1.03mi |
| 3573 Warder St NW Washington, DC | 2.0 | 2.0 | 1438 | $3,100 | $2.16 | 24d | 1 | 1.06mi |
| 811 Quincy St NW Washington, DC | 2.0 | 1.0 | 675 | $2,499 | $3.70 | 7d | 6 | 1.09mi |
| 3552 Warder St NW Washington, DC | 3.0 | 3.0 | 1240 | $3,995 | $3.22 | 24d | 1 | 1.11mi |
| 907 Webster St NW #1 Washington, DC | 2.0 | 1.0 | 900 | $2,400 | $2.67 | 24d | 1 | 1.11mi |
Listing history 26 events
-
2026-06-18days on market $650,000 Active 87 DOM
-
2026-06-17days on market $650,000 Active 86 DOM
-
2026-06-16days on market $650,000 Active 85 DOM
-
2026-06-15days on market $650,000 Active 84 DOM
-
2026-06-13remarks 699-char remark
-
2026-06-13days on market $650,000 Active 82 DOM
-
2026-06-09days on market $650,000 Active 78 DOM
-
2026-06-08days on market $650,000 Active 77 DOM
-
2026-06-07days on market $650,000 Active 76 DOM
-
2026-06-04days on market $650,000 Active 73 DOM
-
2026-06-03days on market $650,000 Active 72 DOM
-
2026-06-02days on market $650,000 Active 71 DOM
-
2026-06-01days on market $650,000 Active 70 DOM
-
2026-05-31days on market $650,000 Active 69 DOM
-
2026-03-23$650,000 Active
-
2026-02-28historical
-
2026-01-27price $700,000
-
2025-12-01$749,000 Active
-
2020-05-22soldstatus $399,999 Closed 549-char remark
Show marketing remark (549 chars)
Cash flow positive investment with C of O. The home conveys fee simple as one address but the owner has a C of O and rents the property as (2) one bedroom/one bath units. Each unit has its on HVAC system, metered electric, washer/dryer, kitchen, etc. and is the perfect rental with great value in a booming location. One of the units is occupied (#1) and the other (#2) is vacant but sum of rents exceeded $2750/mth. Great long-term upside with immediate cash flow that is updated and ready to be purchased. Open House Sat, February 8th from 12-3PM.
-
2020-03-27status Pending 549-char remark
Show marketing remark (549 chars)
Cash flow positive investment with C of O. The home conveys fee simple as one address but the owner has a C of O and rents the property as (2) one bedroom/one bath units. Each unit has its on HVAC system, metered electric, washer/dryer, kitchen, etc. and is the perfect rental with great value in a booming location. One of the units is occupied (#1) and the other (#2) is vacant but sum of rents exceeded $2750/mth. Great long-term upside with immediate cash flow that is updated and ready to be purchased. Open House Sat, February 8th from 12-3PM.
-
2020-03-20status Active 549-char remark
Show marketing remark (549 chars)
Cash flow positive investment with C of O. The home conveys fee simple as one address but the owner has a C of O and rents the property as (2) one bedroom/one bath units. Each unit has its on HVAC system, metered electric, washer/dryer, kitchen, etc. and is the perfect rental with great value in a booming location. One of the units is occupied (#1) and the other (#2) is vacant but sum of rents exceeded $2750/mth. Great long-term upside with immediate cash flow that is updated and ready to be purchased. Open House Sat, February 8th from 12-3PM.
-
2020-02-12status Pending 549-char remark
Show marketing remark (549 chars)
Cash flow positive investment with C of O. The home conveys fee simple as one address but the owner has a C of O and rents the property as (2) one bedroom/one bath units. Each unit has its on HVAC system, metered electric, washer/dryer, kitchen, etc. and is the perfect rental with great value in a booming location. One of the units is occupied (#1) and the other (#2) is vacant but sum of rents exceeded $2750/mth. Great long-term upside with immediate cash flow that is updated and ready to be purchased. Open House Sat, February 8th from 12-3PM.
-
2020-02-05$400,000 Active 549-char remark
Show marketing remark (549 chars)
Cash flow positive investment with C of O. The home conveys fee simple as one address but the owner has a C of O and rents the property as (2) one bedroom/one bath units. Each unit has its on HVAC system, metered electric, washer/dryer, kitchen, etc. and is the perfect rental with great value in a booming location. One of the units is occupied (#1) and the other (#2) is vacant but sum of rents exceeded $2750/mth. Great long-term upside with immediate cash flow that is updated and ready to be purchased. Open House Sat, February 8th from 12-3PM.
-
2008-07-24historical
-
2008-02-05
-
1991-01-09soldstatus $71,000
ⓘ Source: listings_history table (triggers on properties + properties_extension) + one-shot
backfill from property_details.listing_events for pre-trigger history.
Tax reassessment forecast DC · Partial reset (capped growth)
- Current annual tax
- $3,792 · $316/mo
- Projected year-2 tax
- $3,878 · $323/mo
- Expected delta
- +$87/yr (+$7/mo · 2.3%)
ⓘ Screening estimate from a state-policy table — verify with the county assessor before closing.
Climate risk First Street
- Flood 1/10 Low FEMA zone X (unshaded) · 0% chance over 30 yrs
- Wildfire 1/10 Low
- Heat 7/10 Severe 7 d/yr ≥104°F today · 15 d/yr by 30 yrs out
- Wind 4/10 Moderate 19% chance of damaging wind over 30 yrs
- Air quality 4/10 Moderate 4 unhealthy d/yr today · 5 by 30 yrs out
Nearby sold comps map
Loading sold comps map…
Walkable amenities ~0.75 mi
Loading nearby amenities…
Taxation est. · year 1
- Rental income
- $93,696
- − Mortgage interest
- −$36,410
- − Property taxes
- −$3,792
- − Insurance
- −$3,250
- − Repairs & maintenance
- −$7,496
- − Management
- −$7,496
- − Depreciation
- −$18,909
- Taxable income
- $16,344
- Est. tax owed @ 24.0%
- −$3,923
- After-tax cash flow
- $22,152/yr
For passive investors: Depreciation is non-cash, so a rental often shows a tax loss while cash-flowing — sheltering income. Rental losses are passive: they offset passive income freely, and up to $25,000/yr can offset ordinary (W-2) income if you actively participate and your MAGI is under $100k (phasing out to $0 by $150k); unused losses carry forward. On sale, claimed depreciation is recaptured at up to 25%, and gains may owe capital-gains tax (a 1031 exchange can defer both). Figures are a year-1 estimate at your 24.0% rate — not tax advice; consult a CPA.
Schools (NCES district)
- District
- District Of Columbia Public Schools
- NCES district ID
- 1100030
- Math proficiency
- 33% ▲ 3.00%
- Reading proficiency
- 40% ▲ 5.00%
- Median HH income
- $67,671
- Composite
- 35.84/100
- National rank
- #9606
- State rank
- #8 of 32 in DC
Livability — Washington
- Score
- 73/100
- State rank
- #1
- US rank
- #5327
Category grades
Schools grade is shown separately in the Schools card above.
Census & demographics
- Census place
- Washington, DC
- County
- District of Columbia · 671,873 people
- City population
- 671,873
- Metro
- Washington-Arlington-Alexandria, DC-VA-MD-WV
- Population (ZIP)
- 67,434
- Household income
- $110,309
- Rent vs Own
- Severe rent burden
- 3020.0
Population outlook (District of Columbia County) Hauer SSP2
- Today (2025)
- 821,926 people
- By 2030
- 899,517 · +9.4%
- By 2040
- 1,061,162 · +29.1%
- By 2050
- 1,231,493 · +49.8%
- By 2075
- 1,603,312 · +95.1%
- By 2100
- 1,847,141 · +124.7%
Race, ethnicity, and origin ACS 2023
- Neighborhood character
- Diverse neighborhood (Simpson 0.66)
- Race & ethnicity
- Black 50% Hispanic / Latino 23% White 20% Two or more races 10% Asian 2%
- Hispanic origin (detail)
- Mexican 2% Dominican 1%
- Common ancestry
- Lithuanian 1% Romanian 1% Slovak 1%
- Foreign-born
- 21% · Canada
- Languages at home
- 70% English-only · Spanish 20% French/Haitian/Cajun 2% Other Indo-European 1%
Political lean MEDSL · District of Columbia
- 2024 margin
- Solid D (+86.1) · D 91.2% · R 5.1% · Other 3.8%
- 2008→2024 swing
- +0.1pp no change · 2008: 85.9pp · 2024: 86.1pp
- All cycles
- 2024: D+86.1 2020: D+86.8 2016: D+88.7 2012: D+84.2 2008: D+85.9
Not yet ingested
- Civics
- —
Market trends
- HPI YoY
- ▼ -755.96%
- Current HPI
- 378.1083
- Rent YoY
- ▲ 1.45%
- Metro
- Washington-Arlington-Alexandria, DC-VA-MD-WV
- State GDP YoY
- ▲ 1.33%
- F500 in state
- 6
Industry mix (Fortune 500 HQ in DC)
| Industry | F500 HQs | Revenue |
|---|---|---|
| Financial Services | 1 | $153B |
|
||
| Life Sciences / Industrials | 1 | $25B |
|
||
| Industrial Machinery | 1 | $8B |
|
||
Price history
+815.5% since first listed12 events — show timeline
- 2026-03-23 Listed $650,000 BRIGHT MLS
- 2026-02-28 Listing Removed — BRIGHT MLS
- 2026-01-27 Price Changed $700,000 BRIGHT MLS
- 2025-12-01 Listed $749,000 BRIGHT MLS
- 2020-05-22 Sold (MLS) $399,999 BRIGHT MLS
- 2020-03-27 Pending — BRIGHT MLS
- 2020-03-20 Relisted — BRIGHT MLS
- 2020-02-12 Pending — BRIGHT MLS
- 2020-02-05 Listed $400,000 BRIGHT MLS
- 2008-07-24 Delisted — MRIS
- 2008-02-05 Listed — MRIS
- 1991-01-09 Sold (Public Records) $71,000 Public Records
Property tax history
+9.8%/yrLatest (2025): $3,792 · +1.3% YoY. Source: county tax records.
Cash-flow waterfall
monthlySold comps — $/sqft
last 12 mo · ≤1 miLoading sold comps…