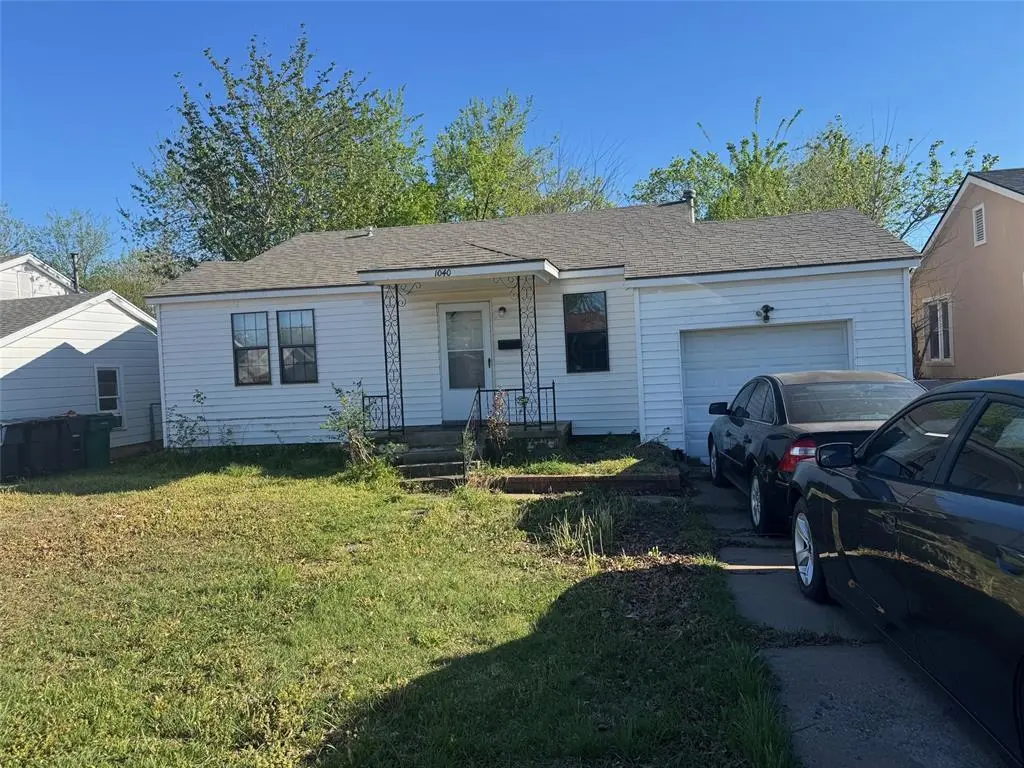
1040 SW 49 St · Oklahoma City, OK
Flood risk 1/10 · Minimal
- FEMA flood zone
- X (unshaded)
- Chance of flooding over 30 yrs
- 0.0%
- Est. flood insurance / yr
- $507 – $1,088
Fire risk 1/10 · Minimal
- Est. fire insurance / yr
- $2,463 – $4,575
Heat risk 6/10 · Moderate
- Hot days now (above 107°F)
- 7 days/yr
- Hot days in 30 yrs
- 18 days/yr
Wind risk 3/10 · Minor
- Chance of severe wind over 30 yrs
- 4.0%
Air-quality risk 1/10 · Minimal
- Unhealthy air days now
- 0 days/yr
- Unhealthy air days in 30 yrs
- 0 days/yr
Risk factors via First Street. Map © Google.
Why this score? — see what drove the D+ grade
The composite is a weighted blend of 9 inputs, each scored 0–100. Each bar is that input's sub-score; the figure is the points it added to the 100-point composite (weight × sub-score).
- Cash flow +13.3/30.0
- Appreciation +10.0/10.0
- ARV discount +8.1/15.0
- DSCR +4.0/10.0
- Livability +4.0/5.0
- 1% rule +3.6/10.0
- Rent growth +3.6/5.0
- Condition / age +2.5/5.0
- Schools +0.7/10.0
$115,000
🖨 Deal sheet (PDF) 📄 Offer letter ✓ Due diligence
Listing remarks MLS
Charming 2-bedroom, 2-bath home featuring updated bathrooms, neutral color tones, and durable laminate wood flooring throughout. The property includes central heating and air for year-round comfort. Priced to sell, this home is conveniently located near restaurants, shopping, and everyday amenities—making it a perfect choice for comfortable and accessible living.
Key facts
- Updated bathrooms
- 8,250 sq ft lot
- Garage
Tags
Neighborhood map
What this means for you Summary
Snapshot
- This is a 2-bed/2.0-bath single-family listed at $115k.
Deal economics
- At list price, monthly cash flow is $1 ($11/yr) — positive.
- The deal already cash-flows at list — no discount required.
- To meet the 1% rule (rent ≥ 1% of price), the offer needs to be $99k (14.2% below list).
- Recommended offer: $99k (14.2% below list) — sets the bar for 1% rule.
- Cap rate 6.3% vs local median 3.7% in Oklahoma City — top-decile yield for the area; either an underpriced asset or a hidden risk that comps aren't pricing in. Stress-test before assuming the spread holds.
Location & tenants
- Location reads 80/100 on livability (#3 in OK, #1,635 nationally) — a professional / high-income tenant draw. Strengths: amenities A+, commute A+, cost of living A+; Watch: schools F, crime F.
- Oklahoma City (urban): math 7% / reading 10% proficiency, ranked #254 of 270 in OK (top 94%) — low school quality limits family demand, transient renter base, plan for 1-2y turnover; 82% free/reduced lunch — lower-income household profile, screen leases tightly.
- Market conditions: Rents rising fast (+4.5%/yr); 83 active listings in the ZIP; 40 comparable units currently listed for rent nearby; rentals lingering (median 45d on market — plan ~5-8 weeks vacancy on turnover, expect pricing pressure); 50% of comp listings sitting > 30 days — soft ceiling on asking rent; lower-income renter base — watch delinquency; 5,365 units permitted in Oklahoma County in 2024 (569 in 5+ unit buildings).
Forward outlook
- In year one you build about $12k of equity ($795 loan paydown + $12k appreciation (10.0% local appreciation)).
- Oklahoma County population projected at +41% by 2050 — long-run rental-demand tailwind backs the buy-and-hold thesis.
- At projected returns (10.0% appreciation + 4.5% rent growth), your $32k cash investment doubles in ~3 years — after that, you're playing with house money.
- By year 3, paydown + projected appreciation supports a ~$31k cash-out refi (75% LTV) — recoverable capital for the next deal without selling this one.
Negotiation context
- It's been on market 72 days — a 6% lower offer ($108k) is reasonable based on typical stale-listing flexibility.
- 3 sale attempts since 12y ago; this cycle's ask has dropped $10k (8%) from the opening price — seller is motivated, your offer sets the floor, not the list.
Risks & watch-outs
- Watch-outs: built in 1950 — expect roof / HVAC / electrical / plumbing capex.
- Climate carrying-cost: extreme-heat days projected 7→18/yr by 2055 (HVAC capex compounding) — expect insurance premiums to compound above CPI over the hold.
Questions for the listing agent
- It's been on market 72 days. Have you received any prior offers? Is the seller open to a 14% concession, seller financing, or rate buy-down credit?
- Built in 1950 — when were the roof, HVAC, electrical panel, plumbing, and water heater last replaced?
- Why hasn't it sold? Are there any deal-killer items the seller is aware of (foundation, flood, title, zoning, code violations)?
- Is there a deadline driving the sale (1031 exchange, divorce, estate, relocation)? That informs how much negotiation room exists.
- Schools are F-rated, which usually means shorter tenancies and higher turnover. Who's the typical renter profile here, and what's been the actual vacancy rate?
- Crime grade is F in this area — have there been break-ins, vandalism, or insurance claims at this property in the last 3 years? What carrier currently insures it and at what premium?
- The area grade is low — what's the realistic commute time and amenity access for the typical tenant pool here? Any planned neighborhood developments (good or bad) we should know about?
- What's the average days-on-market for RENTAL listings here right now (not sales)? A rising rental-DOM trend means longer vacancies and softer asking-rent achievability than the comps imply.
- What's the recent tenant-quality profile in this submarket — average credit score on applications, eviction rate, late-payment / NSF rate, and stable-employment percentage? A property-management company in the area should have these aggregated.
- How much new for-sale + rental construction is in the pipeline within 1–3 miles? Heavy new supply typically softens prices + rents 12–24 months out; constrained supply supports both.
Investment metrics
- 1% rule
- 0.86% ✗
- Cap rate
- 6.30%
- Cash-on-cash
- 0.04%
- DSCR
- 1.00
- GRM
- 9.7
CMA / ARV
- ARV (median comp)
- $116,531
- List price
- $115,000
- Delta
- -1.31%
- Verdict
- FAIR
- Comps
- 20 within 1.0 mi
Show comp detail 12 sales within ~0.75 mi
| Address | Dist | Beds/Ba | Sqft | Sold | Price | $/sf | Match |
|---|---|---|---|---|---|---|---|
| 1420 Williams Dr | 0.46mi | 2/1.0 | 867 (-4%) | 2mo | $120,100 | $139 | 67 |
| 1116 SW 41st St | 0.50mi | 2/1.0 | 875 (-3%) | 2mo | $125,500 | $143 | 67 |
| 933 SW 50th St | 0.15mi | 3/1.0 (+1) | 953 (+6%) | 9mo | $144,000 | $151 | 66 |
| 1313 SW 45 St | 0.44mi | 3/1.0 (+1) | 888 (-1%) | 8mo | $147,900 | $167 | 63 |
| 1321 Williams Dr | 0.38mi | 3/1.0 (+1) | 948 (+6%) | 5mo | $125,000 | $132 | 60 |
| 1521 SW 45th St | 0.64mi | 2/1.0 | 916 (+2%) | 6mo | $101,000 | $110 | 58 |
| 541 SW 45th St | 0.69mi | 2/1.0 | 940 (+5%) | 1mo | $60,000 | $64 | 55 |
| 1440 SW 45th St | 0.55mi | 3/1.5 (+1) | 938 (+4%) | 6mo | $157,750 | $168 | 54 |
| 1112 SW 45th St | 0.27mi | 3/1.0 (+1) | 1,005 (+12%) | 7mo | $122,500 | $122 | 53 |
| 516 SW 46th St | 0.71mi | 2/1.0 | 855 (-5%) | 5mo | $30,000 | $35 | 50 |
| 1428 SW 44th St | 0.56mi | 3/1.0 (+1) | 992 (+10%) | 1mo | $132,400 | $133 | 47 |
| 620 SW 48th St | 0.56mi | 2/1.0 | 804 (-10%) | 8mo | $132,000 | $164 | 46 |
Match score weights: distance 35% · size 25% · config 20% · recency 20%. Top-matched comps best support the ARV.
Projected returns pro-forma
10.0% appreciation · 4.51% rent growth · sell at horizon
- IRR
- 24.8%
- Equity multiple
- 2.99×
- Total profit
- $64,219
- Equity at exit
- $103,601
- IRR
- 22.3%
- Equity multiple
- 6.97×
- Total profit
- $192,359
- Equity at exit
- $223,420
Cash invested: $32,200 (down + closing). Projections, not guarantees.
Landlord ↔ Tenant lean methodology
- Overall (STATE)
- 83 Strongly Landlord-Friendly
- State Oklahoma
- 83 Strongly Landlord-Friendly · R+20
- County
- — inherits STATE
- City
- — inherits STATE
ZIP-level market 73109
- Home prices YoY
- 9.5%
- Rents YoY
- 4.5%
- Active inventory
- 83
- Price-to-rent
- 9.7×
Monthly cashflow live
- Estimated rent
- $987 high interval (Pro) →
- Mortgage (P&I)
- −$603
- Tax from tax record
- −$128 /mo · $1,530/yr
- Insurance
- −$48
- HOA
- −$0
- Vacancy / Maint / Mgmt
- −$207
- Net cashflow
- $1
Break-even live
Sensitivity live
| Price | -10% $66 | -5% $33 | +0% $1 | +5% $-32 | +10% $-64 |
|---|---|---|---|---|---|
| Rent | -10% $-77 | -5% $-38 | +0% $1 | +5% $40 | +10% $79 |
| Rate | -1.0pp $59 | -0.5pp $30 | base $1 | +0.5pp $-29 | +1.0pp $-59 |
UW: 25.0% down · 7.5% · 30yr · 1.5% tax · 5.0% vac · 8.0% maint · 8.0% mgmt
Financing live
Cash to close
- Down payment
- $28,750
- Closing costs
- $3,450
- Reserves months
- —
- Total cash needed
- —
Loan-product check · same deal, 3 products live
Conventional
25% down · 7.5% · 30yr
- Down + closing
- —
- Monthly P&I
- —
- Monthly cashflow
- —
- DSCR
- —
- Eligible?
- —
Personal DTI + credit; lowest rate.
DSCR
20% down · 8.5% · 30yr
- Down + closing
- —
- Monthly P&I
- —
- Monthly cashflow
- —
- DSCR
- —
- Eligible?
- —
No personal income docs; deal must DSCR.
Hard money
10% down · 12.0% · 12mo
- Down + closing
- —
- Monthly P&I
- —
- Monthly cashflow
- —
- DSCR
- —
- Eligible?
- —
Short-term bridge; refi at stabilization.
Rent comps 40 comps
| Address | Beds | Baths | Sqft | Rent | $/sqft | DOM | Units | Dist |
|---|---|---|---|---|---|---|---|---|
| 1004 SW 45th St Oklahoma City, OK | 2.0 | 1.0 | 756 | $950 | $1.26 | 24d | 1 | 0.25mi |
| 1338 South Dr Oklahoma City, OK | 2.0 | 1.0 | 720 | $1,150 | $1.60 | 16d | 1 | 0.38mi |
| 800 SW 52nd St Oklahoma City, OK | 2.0 | 1.0 | 920 | $995 | $1.08 | 24d | 1 | 0.40mi |
| 620 SW 50th St Oklahoma City, OK | 2.0 | 1.0 | 977 | $1,100 | $1.13 | 3d | 1 | 0.53mi |
| 632 SW 44th St Oklahoma City, OK | 2.0 | 1.0 | 958 | $1,000 | $1.04 | 4d | 1 | 0.59mi |
| 1116 SW 59th St Oklahoma City, OK | 1.0 | 1.0 | 750 | $850 | $1.13 | 44d | 1 | 0.70mi |
| 6111 S Klein Ave Oklahoma City, OK | 2.0–3.0 | 1.0 | 617 | $850 | $1.38 | 4d | 3 | 0.78mi |
| 5909 S Lee Ave Oklahoma City, OK | 1.0–2.0 | 1.0 | 775 | $980 | $1.26 | 4d | 5 | 0.82mi |
| 1402 SW 59th St Unit 3202 Oklahoma City, OK | 2.0 | 1.0 | 950 | $865 | $0.91 | 24d | 1 | 0.83mi |
| 1402 SW 59th St Apt 3201 Oklahoma City, OK | 2.0 | 1.0 | 950 | $865 | $0.91 | 44d | 1 | 0.83mi |
| 1402 SW 59th St Apt 1112 Oklahoma City, OK | 2.0 | 1.5 | 925 | $980 | $1.06 | 44d | 1 | 0.85mi |
| 6210 S Douglas Ave Oklahoma City, OK | 1.0 | 1.0 | 650 | $660 | $1.02 | 4d | 1 | 0.85mi |
| 2116 SW 51st St Oklahoma City, OK | 1.0 | 1.0 | 558 | $675 | $1.21 | 44d | 1 | 0.86mi |
| 616 SW 59th St Unit 43 Oklahoma City, OK | 2.0 | 1.0 | 775 | $900 | $1.16 | 44d | 1 | 0.88mi |
| 1004 SW 62nd St Oklahoma City, OK | 3.0 | 1.0 | 968 | $1,295 | $1.34 | 4d | 1 | 0.89mi |
| 5542 S Walker Ave Oklahoma City, OK | 2.0 | 1.0 | 681 | $920 | $1.35 | 3d | 1 | 0.90mi |
| 1329 SW Grand Blvd Oklahoma City, OK | 2.0 | 1.0 | 858 | $1,050 | $1.22 | 44d | 1 | 0.93mi |
| 1433 SW 60th St Oklahoma City, OK | 3.0 | 2.0 | 942 | $1,400 | $1.49 | 44d | 1 | 0.94mi |
| 5113 S Sage Ave Oklahoma City, OK | 3.0 | 1.5 | 996 | $1,025 | $1.03 | 2d | 1 | 0.95mi |
| 4330 S Barnes Ave Oklahoma City, OK | 1.0–3.0 | 1.0–2.0 | 860 | $937 | $1.09 | 4d | 9 | 0.97mi |
| 2128 SW 41st St Oklahoma City, OK | 2.0 | 1.0 | 860 | $820 | $0.95 | 3d | 1 | 1.01mi |
| 1344 SW 62nd St Oklahoma City, OK | 3.0 | 1.0 | 878 | $1,300 | $1.48 | 3d | 1 | 1.04mi |
| 1432 SW 61st Ter Oklahoma City, OK | 3.0 | 1.5 | 891 | $1,145 | $1.29 | 44d | 1 | 1.05mi |
| 3616 S Lee Ave Oklahoma City, OK | 1.0 | 1.0 | 760 | $775 | $1.02 | 44d | 1 | 1.06mi |
| 3618 S Lee Ave Oklahoma City, OK | 1.0 | 1.0 | 760 | $850 | $1.12 | 44d | 1 | 1.06mi |
| 3906 S Hudson Ave Oklahoma City, OK | 1.0 | 1.0 | 700 | $750 | $1.07 | 24d | 1 | 1.08mi |
| 1020 SW 65th St Oklahoma City, OK | 3.0 | 1.0 | 956 | $1,330 | $1.39 | 44d | 1 | 1.09mi |
| 5804 S Harvey Ave Oklahoma City, OK | 1.0 | 1.0 | 780 | $675 | $0.87 | 22d | 1 | 1.11mi |
| 2119 SW 39th St Oklahoma City, OK | 1.0–2.0 | 1.0 | 675 | $909 | $1.35 | 44d | 1 | 1.11mi |
| 3913 S Harvey Ave Unit 2 Oklahoma City, OK | 1.0 | 1.0 | 568 | $900 | $1.58 | 44d | 1 | 1.12mi |
| 3407 S Lee Ave Oklahoma City, OK | 2.0 | 1.0 | 900 | $980 | $1.09 | 44d | 1 | 1.18mi |
| 449 SW 63rd Pl Unit 6400 S Byers Oklahoma City, OK | 3.0 | 1.0 | 775 | $850 | $1.10 | 24d | 1 | 1.19mi |
| 2412 SW 47th St Oklahoma City, OK | 3.0 | 1.0 | 638 | $1,150 | $1.80 | 24d | 1 | 1.20mi |
| 2120 SW 61st St Oklahoma City, OK | 3.0 | 1.0 | 1101 | $1,200 | $1.09 | 44d | 1 | 1.21mi |
| 6050 S Harvey Ave Apt 103 Oklahoma City, OK | 2.0 | 1.0 | 780 | $929 | $1.19 | 24d | 1 | 1.24mi |
| 6050 S Harvey Ave Oklahoma City, OK | 2.0 | 1.0 | 780 | $929 | $1.19 | 44d | 1 | 1.25mi |
| 2140 SW 35th St Oklahoma City, OK | 3.0 | 2.0 | 976 | $1,300 | $1.33 | 44d | 1 | 1.26mi |
| 2500 SW 48th St Oklahoma City, OK | 2.0 | 1.0 | 1096 | $1,050 | $0.96 | 44d | 1 | 1.30mi |
| 220 SW 34th St Oklahoma City, OK | 1.0 | 1.0 | 625 | $725 | $1.16 | 44d | 1 | 1.36mi |
| 2336 SW Grand Blvd Oklahoma City, OK | 2.0 | 1.0 | 770 | $995 | $1.29 | 44d | 1 | 1.39mi |
Listing history 22 events
-
2026-06-18days on market $115,000 Active 72 DOM
-
2026-06-17days on market $115,000 Active 71 DOM
-
2026-06-16days on market $115,000 Active 70 DOM
-
2026-06-15days on market $115,000 Active 69 DOM
-
2026-06-13days on market $115,000 Active 67 DOM
-
2026-06-09days on market $115,000 Active 63 DOM
-
2026-06-08days on market $115,000 Active 62 DOM
-
2026-06-07days on market $115,000 Active 61 DOM
-
2026-06-05days on market $115,000 Active 58 DOM
-
2026-06-03days on market $115,000 Active 57 DOM
-
2026-06-02days on market $115,000 Active 56 DOM
-
2026-06-01days on market $115,000 Active 55 DOM
-
2026-05-31days on market $115,000 Active 54 DOM
-
2026-05-03price $115,000 371-char remark
Show marketing remark (371 chars)
Charming 2-bedroom, 2-bath home featuring updated bathrooms, neutral color tones, and durable laminate wood flooring throughout. The property includes central heating and air for year-round comfort. Priced to sell, this home is conveniently located near restaurants, shopping, and everyday amenities—making it a perfect choice for comfortable and accessible living.
-
2026-04-07$125,000 Active 371-char remark
Show marketing remark (371 chars)
Charming 2-bedroom, 2-bath home featuring updated bathrooms, neutral color tones, and durable laminate wood flooring throughout. The property includes central heating and air for year-round comfort. Priced to sell, this home is conveniently located near restaurants, shopping, and everyday amenities—making it a perfect choice for comfortable and accessible living.
-
2023-01-03soldstatus $110,000
-
2022-12-27soldstatus $110,000 Closed 324-char remark
Show marketing remark (324 chars)
Large bedrooms with good closet space. If a 3rd bedroom is needed garage could be easily converted to a bedroom making the second bath in suite. Kitchen has ample counter space with plenty of cabinet storage. Updated laminate flooring throught the house. Large fenced back yard. This one has lots of potential. See it Today!
-
2022-11-22status Pending 324-char remark
Show marketing remark (324 chars)
Large bedrooms with good closet space. If a 3rd bedroom is needed garage could be easily converted to a bedroom making the second bath in suite. Kitchen has ample counter space with plenty of cabinet storage. Updated laminate flooring throught the house. Large fenced back yard. This one has lots of potential. See it Today!
-
2022-11-19$109,900 Active 324-char remark
Show marketing remark (324 chars)
Large bedrooms with good closet space. If a 3rd bedroom is needed garage could be easily converted to a bedroom making the second bath in suite. Kitchen has ample counter space with plenty of cabinet storage. Updated laminate flooring throught the house. Large fenced back yard. This one has lots of potential. See it Today!
-
2015-02-03soldstatus $50,000
-
2015-01-29soldstatus $50,000
-
2014-10-02$52,900
ⓘ Source: listings_history table (triggers on properties + properties_extension) + one-shot
backfill from property_details.listing_events for pre-trigger history.
Tax reassessment forecast OK · Resets to sale price
- Current annual tax
- $1,530 · $128/mo
- Projected year-2 tax
- $1,530 · $128/mo
- Expected delta
- $0/yr ($0/mo · 0.0%)
ⓘ Screening estimate from a state-policy table — verify with the county assessor before closing.
Climate risk First Street
- Flood 1/10 Low FEMA zone X (unshaded) · 0% chance over 30 yrs
- Wildfire 1/10 Low
- Heat 6/10 Major 7 d/yr ≥107°F today · 18 d/yr by 30 yrs out
- Wind 3/10 Moderate 4% chance of damaging wind over 30 yrs
- Air quality 1/10 Low 0 unhealthy d/yr today · 0 by 30 yrs out
Nearby sold comps map
Loading sold comps map…
Walkable amenities ~0.75 mi
Loading nearby amenities…
Taxation est. · year 1
- Rental income
- $11,840
- − Mortgage interest
- −$6,442
- − Property taxes
- −$1,530
- − Insurance
- −$575
- − Repairs & maintenance
- −$947
- − Management
- −$947
- − Depreciation
- −$3,345
- Taxable loss
- −$1,947
- Est. tax savings @ 24.0%
- +$467
- After-tax cash flow
- $479/yr
For passive investors: Depreciation is non-cash, so a rental often shows a tax loss while cash-flowing — sheltering income. Rental losses are passive: they offset passive income freely, and up to $25,000/yr can offset ordinary (W-2) income if you actively participate and your MAGI is under $100k (phasing out to $0 by $150k); unused losses carry forward. On sale, claimed depreciation is recaptured at up to 25%, and gains may owe capital-gains tax (a 1031 exchange can defer both). Figures are a year-1 estimate at your 24.0% rate — not tax advice; consult a CPA.
Schools (NCES district)
- District
- Oklahoma City
- NCES district ID
- 4022770
- Math proficiency
- 7% ▼ -5.00%
- Reading proficiency
- 10% ▼ -6.00%
- Median HH income
- $35,606
- Composite
- 7.0/100
- National rank
- #9970
- State rank
- #254 of 270 in OK
Livability — Oklahoma City
- Score
- 80/100
- State rank
- #3
- US rank
- #1635
Category grades
Schools grade is shown separately in the Schools card above.
Census & demographics
- Census place
- Oklahoma City, OK
- County
- Oklahoma County · 771,644 people
- City population
- 498,656
- Metro
- Oklahoma City, OK
- Population (ZIP)
- 21,378
- Household income
- $43,133
- Rent vs Own
- Severe rent burden
- 1473.0
Population outlook (Oklahoma County) Hauer SSP2
- Today (2025)
- 911,875 people
- By 2030
- 982,413 · +7.7%
- By 2040
- 1,130,468 · +24.0%
- By 2050
- 1,288,422 · +41.3%
- By 2075
- 1,711,482 · +87.7%
- By 2100
- 2,088,448 · +129.0%
Race, ethnicity, and origin ACS 2023
- Neighborhood character
- Diverse neighborhood (Simpson 0.55)
- Race & ethnicity
- Hispanic / Latino 62% Two or more races 24% White 23% Black 9% Native American 5%
- Hispanic origin (detail)
- Mexican 58%
- Common ancestry
- Italian 1% Hispanic 1% Scottish 1%
- Foreign-born
- 26% · Canada
- Languages at home
- 49% English-only · Spanish 50% Other Asian/Pacific 0%
Political lean MEDSL · Oklahoma
- 2024 margin
- Toss-up / Even · D 48.0% · R 49.7% · Other 2.3%
- 2008→2024 swing
- +15.1pp toward D · 2008: -16.8pp · 2024: -1.7pp
- All cycles
- 2024: R+1.7 2020: R+1.1 2016: R+10.5 2012: R+16.7 2008: R+16.8
Not yet ingested
- Civics
- —
Market trends
- HPI YoY
- ▲ 23.48%
- Current HPI
- 270.5333
- Rent YoY
- ▲ 4.51%
- Metro
- Oklahoma City, OK
- State GDP YoY
- ▲ 1.55%
- F500 in state
- 6
Industry mix (Fortune 500 HQ in OK)
| Industry | F500 HQs | Revenue |
|---|---|---|
| Energy | 3 | $48B |
|
||
Price history
+117.4% since first listed9 events — show timeline
- 2026-05-03 Price Changed $115,000 MLSOK
- 2026-04-07 Listed $125,000 MLSOK
- 2023-01-03 Sold (Public Records) $110,000 Public Records
- 2022-12-27 Sold (MLS) $110,000 MLSOK
- 2022-11-22 Pending — MLSOK
- 2022-11-19 Listed $109,900 MLSOK
- 2015-02-03 Sold (Public Records) $50,000 Public Records
- 2015-01-29 Sold (MLS) $50,000 MLSOK
- 2014-10-02 Listed $52,900 MLSOK
Property tax history
+8.5%/yrLatest (2025): $1,530 · +4.4% YoY. Source: county tax records.
Cash-flow waterfall
monthlySold comps — $/sqft
last 12 mo · ≤1 miLoading sold comps…