 🔨 Auction
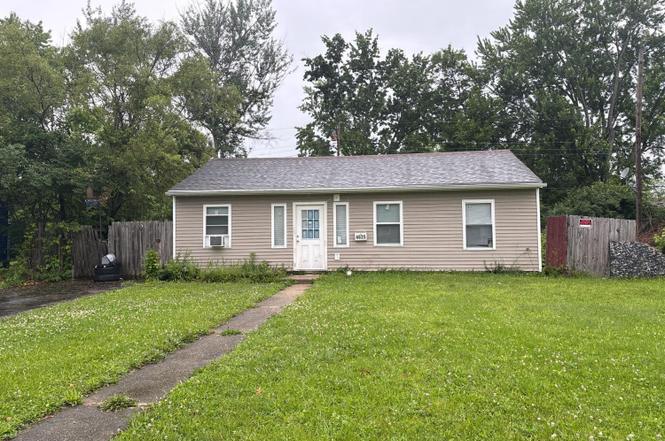
4625 Freudenberger Ave · Trotwood, OH
Flood risk 1/10 · Minimal
- FEMA flood zone
- X (unshaded)
- Chance of flooding over 30 yrs
- 0.0%
- Est. flood insurance / yr
- $507 – $1,088
Fire risk 1/10 · Minimal
- Est. fire insurance / yr
- $713 – $1,323
Heat risk 3/10 · Minor
- Hot days now (above 104°F)
- 7 days/yr
- Hot days in 30 yrs
- 19 days/yr
Wind risk 2/10 · Minimal
- Chance of severe wind over 30 yrs
- 1.0%
Air-quality risk 3/10 · Minor
- Unhealthy air days now
- 3 days/yr
- Unhealthy air days in 30 yrs
- 4 days/yr
Risk factors via First Street. Map © Google.
Why this score? — see what drove the F grade
The composite is a weighted blend of 9 inputs, each scored 0–100. Each bar is that input's sub-score; the figure is the points it added to the 100-point composite (weight × sub-score).
- Cash flow +10.4/30.0
- ARV discount +7.5/15.0
- Rent growth +3.5/5.0
- 1% rule +3.1/10.0
- DSCR +3.0/10.0
- Livability +3.0/5.0
- Condition / age +2.5/5.0
- Schools +1.2/10.0
- Appreciation +0.0/10.0
$1
🖨 Deal sheet 📄 Offer letter ✓ Due diligence
Listing remarks
Court Ordered Sale by Private Selling Officer. Auction ends on June 24, 2026. All information we have on the property is included. We have no additional information, property condition is unknown. NO SHOWINGS, NO trespassing for any reason. Information is thought to be correct but not guaranteed. 10% Buyer Premium added to the high bid, $5,000 deposit is due within 24 hours of bidding end.
Key facts
- 7,841 sq ft lot
- Built 1956
- Listed 3 days
Property features AI
Finance
- Other: Auction listing
- HOA & community: No HOA
Exterior
- Utilities: Public water; Public sewer; Natural gas
- Home design: Ranch-style single family home; One level (single-story); Slab foundation
- Construction: Built with vinyl siding; Shingle roof; Slab foundation
- Exterior features: Vinyl windows; Shingle roof; Vinyl siding
Interior
- Kitchen: Kitchen measures about 9 x 9
- Bedrooms: Three bedrooms total; Primary bedroom is 10 x 10 on the main level; Second bedroom is 10 x 10 on the main level; Third bedroom is 9 x 9 on the main level
- Bathrooms: One full bathroom on the main level with a shower
- Heating & cooling: Central air conditioning; Forced air heating; Water heating: Other
- Interior features: Five total rooms
Neighborhood map
What this means for you Summary
Snapshot
- This is a 3-bed/1.0-bath single-family listed at $1.
Deal economics
- At list price, monthly cash flow is $-74 ($-882/yr) — negative.
- The deal already cash-flows at list — no discount required.
- Meets the 1% rule at list price ($1k rent vs $1).
Location & tenants
- Location reads 59/100 on livability (#1,014 in OH) — a working-class tenant base; expect higher turnover. Strengths: cost of living A+, housing A; Watch: employment D, schools F, crime F.
- Trotwood-Madison City (suburban): math 9% / reading 21% proficiency, ranked #645 of 656 in OH (top 98%) — low school quality limits family demand, transient renter base, plan for 1-2y turnover; 78% free/reduced lunch — lower-income household profile, screen leases tightly.
- Market conditions: Rents rising fast (+4.1%/yr); 135 active listings in the ZIP; 33 comparable units currently listed for rent nearby; rentals at typical pace (median 24d on market — plan ~3-4 weeks tenant-placement turnaround); 42% of comp listings sitting > 30 days — soft ceiling on asking rent; lower-income renter base — watch delinquency; 907 units permitted in Montgomery County in 2024 (416 in 5+ unit buildings).
- This rent runs 37% of the median local income ($37k/yr) — at the standard rent-burdened threshold; future hikes will face affordability resistance.
Forward outlook
- Local home prices are declining (-3.0%/yr); year-one equity from $971 of loan paydown is wiped out by about $4k of value loss. Plan a longer hold.
- Montgomery County population projected at -10% by 2050 — secular population decline; favor cash flow + early exit over multi-decade hold.
Negotiation context
- Only 3 days on market — expect competitive offers; lowballing is unlikely to land.
Risks & watch-outs
- Watch-outs: property tax is 210600.0% of price; built in 1956 — expect roof / HVAC / electrical / plumbing capex.
Questions for the listing agent
- What do current leases actually rent for vs. the listed asking? Can we see a recent rent roll and the last 12 months of T-12 income?
- Built in 1956 — when were the roof, HVAC, electrical panel, plumbing, and water heater last replaced?
- Property tax is high relative to price — has the assessment been appealed recently, and will the sale trigger a re-assessment?
- Is there a deadline driving the sale (1031 exchange, divorce, estate, relocation)? That informs how much negotiation room exists.
- Schools are F-rated, which usually means shorter tenancies and higher turnover. Who's the typical renter profile here, and what's been the actual vacancy rate?
- Crime grade is F in this area — have there been break-ins, vandalism, or insurance claims at this property in the last 3 years? What carrier currently insures it and at what premium?
- The area grade is low — what's the realistic commute time and amenity access for the typical tenant pool here? Any planned neighborhood developments (good or bad) we should know about?
- What's the average days-on-market for RENTAL listings here right now (not sales)? A rising rental-DOM trend means longer vacancies and softer asking-rent achievability than the comps imply.
- What's the recent tenant-quality profile in this submarket — average credit score on applications, eviction rate, late-payment / NSF rate, and stable-employment percentage? A property-management company in the area should have these aggregated.
- How much new for-sale + rental construction is in the pipeline within 1–3 miles? Heavy new supply typically softens prices + rents 12–24 months out; constrained supply supports both.
Investment metrics
- 1% rule
- 0.81% ✗
- Cap rate
- 5.66%
- Cash-on-cash
- -2.24%
- DSCR
- 0.90
- GRM
- 10.3
CMA / ARV
- ARV (on-the-fly)
- $140,400
- Comps found
- 12
Show comp detail 12 sales within ~0.75 mi
| Address | Dist | Beds/Ba | Sqft | Sold | Price | $/sf | Match |
|---|---|---|---|---|---|---|---|
| 4482 Gaiter Ln | 0.25mi | 3/1.0 | 962 (-11%) | 1mo | $125,000 | $130 | 70 |
| 5157 Osceola Dr | 0.60mi | 3/2.0 | 1,089 (+1%) | 1mo | $149,900 | $138 | 66 |
| 1310 Honeybee Dr | 0.16mi | 3/1.0 | 960 (-11%) | 11mo | $73,000 | $76 | 65 |
| 4722 Hollister Ave | 0.71mi | 3/1.0 | 1,096 (+2%) | 9mo | $206,000 | $188 | 56 |
| 924 Almond Ave | 0.54mi | 3/1.0 | 1,026 (-5%) | 12mo | $135,000 | $132 | 56 |
| 4901 Gardendale Ave | 0.43mi | 4/1.0 (+1) | 960 (-11%) | 3mo | $99,000 | $103 | 54 |
| 4845 Little Richmond Rd | 0.64mi | 3/1.5 | 1,134 (+5%) | 9mo | $100,000 | $88 | 53 |
| 683 Tyson Ave | 0.72mi | 3/1.0 | 1,050 (-3%) | 11mo | $139,000 | $132 | 53 |
| 5009 Yalecrest Dr | 0.71mi | 3/1.0 | 1,000 (-7%) | 5mo | $91,000 | $91 | 51 |
| 731 Whitmore Ave | 0.63mi | 3/1.0 | 925 (-14%) | 8mo | $65,000 | $70 | 40 |
| 4126 Kammer Ave | 0.74mi | 2/1.0 (-1) | 984 (-9%) | 8mo | $143,000 | $145 | 39 |
| 5015 Yalecrest Dr | 0.71mi | 3/1.5 | 1,231 (+14%) | 9mo | $132,000 | $107 | 34 |
Match score weights: distance 35% · size 25% · config 20% · recency 20%. Top-matched comps best support the ARV.
Projected returns pro-forma
-3.0% appreciation · 4.06% rent growth · sell at horizon
- IRR
- -18.8%
- Equity multiple
- 0.33×
- Total profit
- $-26,192
- Equity at exit
- $20,934
- IRR
- -9.3%
- Equity multiple
- 0.40×
- Total profit
- $-23,637
- Equity at exit
- $12,139
Cash invested: $39,312 (down + closing). Projections, not guarantees.
Landlord ↔ Tenant lean methodology
- Overall (STATE)
- 73 Landlord-Friendly
- State Ohio
- 73 Landlord-Friendly · R+6
- County
- — inherits STATE
- City
- — inherits STATE
ZIP-level market 45417
- Home prices YoY
- -32.3%
- Rents YoY
- 4.1%
- Active inventory
- 135
Monthly cashflow live
- Estimated rent
- $1,135 high interval (Pro) →
- Mortgage (P&I)
- −$736
- Tax est. 1.5%
- −$176 /mo · $2,106/yr
- Insurance
- −$58
- HOA
- −$0
- Vacancy / Maint / Mgmt
- −$238
- Net cashflow
- $-74
Break-even live
UW: 25.0% down · 7.5% · 30yr · 1.5% tax · 5.0% vac · 8.0% maint · 8.0% mgmt
Financing live
Cash to close
- Down payment
- $35,100
- Closing costs
- $4,212
- Reserves months
- —
- Total cash needed
- —
Loan-product check · same deal, 3 products live
Conventional
25% down · 7.5% · 30yr
- Down + closing
- —
- Monthly P&I
- —
- Monthly cashflow
- —
- DSCR
- —
- Eligible?
- —
Personal DTI + credit; lowest rate.
DSCR
20% down · 8.5% · 30yr
- Down + closing
- —
- Monthly P&I
- —
- Monthly cashflow
- —
- DSCR
- —
- Eligible?
- —
No personal income docs; deal must DSCR.
Hard money
10% down · 12.0% · 12mo
- Down + closing
- —
- Monthly P&I
- —
- Monthly cashflow
- —
- DSCR
- —
- Eligible?
- —
Short-term bridge; refi at stabilization.
Rent comps 33 comps
| Address | Beds | Baths | Sqft | Rent | $/sqft | DOM | Units | Dist |
|---|---|---|---|---|---|---|---|---|
| 4625 Gardendale Ave Dayton, OH | 3.0 | 1.0 | 864 | $1,150 | $1.33 | 2d | 1 | 0.09mi |
| 4576 Live Oak Dr Dayton, OH | 3.0 | 1.0 | 864 | $1,400 | $1.62 | 43d | 1 | 0.18mi |
| 1498 Elaine St Dayton, OH | 3.0 | 1.0 | 864 | $1,025 | $1.19 | 2d | 1 | 0.29mi |
| 4914 Gardendale Ave Dayton, OH | 4.0 | 1.0 | 960 | $1,125 | $1.17 | 43d | 1 | 0.32mi |
| 1595 Elaine St Dayton, OH | 3.0 | 1.0 | 864 | $950 | $1.10 | 2d | 1 | 0.34mi |
| 1427 Stuben Dr Dayton, OH | 3.0 | 1.0 | 957 | $900 | $0.94 | 2d | 1 | 0.52mi |
| 3925 Hoover Ave Dayton, OH | 2.0 | 1.0 | 936 | $1,100 | $1.18 | 2d | 1 | 0.86mi |
| 5336 Rockport Ave Dayton, OH | 3.0 | 1.0 | 925 | $1,025 | $1.11 | 43d | 1 | 0.99mi |
| 863 N Upland Ave Dayton, OH | 3.0 | 1.0 | 1042 | $1,200 | $1.15 | 43d | 1 | 1.00mi |
| 1816 N James H McGee Blvd Apt B Dayton, OH | 3.0 | 1.0 | 950 | $1,150 | $1.21 | 43d | 1 | 1.10mi |
| 1816 N James H McGee Blvd Unit C Dayton, OH | 3.0 | 1.0 | 950 | $1,150 | $1.21 | 2d | 1 | 1.10mi |
| 1816 N James H McGee Blvd Apt A Dayton, OH | 3.0 | 1.0 | 950 | $1,200 | $1.26 | 2d | 1 | 1.10mi |
| 4629 Queens Ave Dayton, OH | 2.0 | 1.0 | 900 | $1,100 | $1.22 | 43d | 1 | 1.15mi |
| 828 Walton Ave Unit 832 Walton Dayton, OH | 2.0 | 1.0 | 750 | $795 | $1.06 | 23d | 1 | 1.18mi |
| 4109 Midway Ave Dayton, OH | 3.0 | 1.0 | 971 | $1,000 | $1.03 | 3d | 1 | 1.18mi |
| 3672 Karwin Dr Unit 3672 Dayton, OH | 2.0 | 1.0 | 1500 | $995 | $0.66 | 43d | 1 | 1.20mi |
| 1732 Harold Dr Dayton, OH | 2.0 | 1.0 | 805 | $925 | $1.15 | 43d | 1 | 1.21mi |
| 920 Huron Ave Dayton, OH | 2.0 | 1.0 | 950 | $995 | $1.05 | 3d | 1 | 1.21mi |
| 3668 Karwin Dr Unit 3672 Dayton, OH | 2.0 | 1.0 | 1500 | $995 | $0.66 | 23d | 1 | 1.21mi |
| 3552 Stanford Pl Dayton, OH | 2.0 | 1.0 | 800 | $800 | $1.00 | 23d | 1 | 1.22mi |
| 3552 Stanford Pl Unit 3552 Dayton, OH | 2.0 | 1.0 | 800 | $800 | $1.00 | 43d | 1 | 1.22mi |
| 3652 Otterbein Ave Unit 3652 Dayton, OH | 2.0 | 1.0 | 700 | $800 | $1.14 | 2d | 1 | 1.25mi |
| 3650 Otterbein Ave Unit 3650 Dayton, OH | 2.0 | 1.0 | 900 | $800 | $0.89 | 2d | 1 | 1.25mi |
| 2014 Hickorydale Dr Unit 2016 Dayton, OH | 2.0 | 1.0 | 800 | $900 | $1.12 | 43d | 1 | 1.25mi |
| 3222 Athens Ave Unit C Dayton, OH | 2.0 | 1.0 | 700 | $700 | $1.00 | 43d | 1 | 1.28mi |
| 3220 Princeton Dr Dayton, OH | 3.0 | 1.0 | 900 | $1,000 | $1.11 | 43d | 1 | 1.30mi |
| 617 Westwood Ave Dayton, OH | 3.0 | 1.0 | 1304 | $1,050 | $0.81 | 43d | 1 | 1.31mi |
| 2002 Val Vista Ct Dayton, OH | 3.0 | 1.0 | 975 | $1,095 | $1.12 | 21d | 1 | 1.32mi |
| 3537 Otterbein Ave Unit d Dayton, OH | 2.0 | 1.0 | 900 | $925 | $1.03 | 43d | 1 | 1.40mi |
| 4446 Waymire Ave Dayton, OH | 3.0 | 1.0 | 1100 | $1,100 | $1.00 | 21d | 1 | 1.40mi |
| 3207 Cornell Dr Dayton, OH | 3.0 | 1.0 | 1168 | $1,000 | $0.86 | 3d | 1 | 1.41mi |
| 1720 Kings Mill Ct Dayton, OH | 2.0 | 1.5 | 975 | $925 | $0.95 | 23d | 1 | 1.42mi |
| 660 Gramont Ave Dayton, OH | 3.0 | 1.0 | 1142 | $1,050 | $0.92 | 3d | 1 | 1.48mi |
Listing history 4 events
-
2026-06-18days on market $1 Active 3 DOM
-
2026-06-17days on market $1 Active 2 DOM
-
2026-06-15remarks 392-char remark
-
2026-06-15$1 Active 1 DOM
ⓘ Source: listings_history table (triggers on properties + properties_extension) + one-shot
backfill from property_details.listing_events for pre-trigger history.
Climate risk First Street
- Flood 1/10 Low FEMA zone X (unshaded) · 0% chance over 30 yrs
- Wildfire 1/10 Low
- Heat 3/10 Moderate 7 d/yr ≥104°F today · 19 d/yr by 30 yrs out
- Wind 2/10 Low 100% chance of damaging wind over 30 yrs
- Air quality 3/10 Moderate 3 unhealthy d/yr today · 4 by 30 yrs out
Nearby sold comps map
Loading sold comps map…
Walkable amenities ~0.75 mi
Loading nearby amenities…
Taxation est. · year 1
- Rental income
- $13,622
- − Mortgage interest
- −$7,865
- − Property taxes
- −$2,106
- − Insurance
- −$702
- − Repairs & maintenance
- −$1,090
- − Management
- −$1,090
- − Depreciation
- −$4,084
- Taxable loss
- −$3,315
- Est. tax savings @ 24.0%
- +$796
- After-tax cash flow
- $-87/yr
For passive investors: Depreciation is non-cash, so a rental often shows a tax loss while cash-flowing — sheltering income. Rental losses are passive: they offset passive income freely, and up to $25,000/yr can offset ordinary (W-2) income if you actively participate and your MAGI is under $100k (phasing out to $0 by $150k); unused losses carry forward. On sale, claimed depreciation is recaptured at up to 25%, and gains may owe capital-gains tax (a 1031 exchange can defer both). Figures are a year-1 estimate at your 24.0% rate — not tax advice; consult a CPA.
Schools (NCES district)
- District
- Trotwood-Madison City
- NCES district ID
- 3904869
- Math proficiency
- 9% ▼ -15.00%
- Reading proficiency
- 21% ▼ -11.00%
- Median HH income
- $33,529
- Composite
- 12.15/100
- National rank
- #9651
- State rank
- #645 of 656 in OH
Livability — Trotwood
- Score
- 59/100
- State rank
- #1014
- US rank
- #20073
Category grades
Schools grade is shown separately in the Schools card above.
Census & demographics
- Census place
- Trotwood, OH
- County
- Montgomery County · 459,541 people
- City population
- 19,754
- Metro
- Dayton-Kettering, OH
- Population (ZIP)
- 28,186
- Household income
- $36,945
- Rent vs Own
- Severe rent burden
- 1822.0
Population outlook (Montgomery County) Hauer SSP2
- Today (2025)
- 523,241 people
- By 2030
- 514,948 · -1.6%
- By 2040
- 493,378 · -5.7%
- By 2050
- 469,639 · -10.2%
- By 2075
- 418,360 · -20.0%
- By 2100
- 353,315 · -32.5%
Race, ethnicity, and origin ACS 2023
- Neighborhood character
- Predominantly Black (71%)
- Race & ethnicity
- Black 71% White 20% Two or more races 8% Hispanic / Latino 3%
- Common ancestry
- Romanian 0%
- Foreign-born
- 3% · Canada
- Languages at home
- 96% English-only · Spanish 2% French/Haitian/Cajun 1%
Political lean MEDSL · Montgomery
- 2024 margin
- Toss-up / Even · D 49.8% · R 49.3%
- 2008→2024 swing
- -5.8pp toward R · 2008: 6.2pp · 2024: 0.5pp
- All cycles
- 2024: D+0.5 2020: D+2.2 2016: R+1.2 2012: D+3.1 2008: D+6.2
Not yet ingested
- Civics
- —
Market trends
- HPI YoY
- ▼ -92.43%
- Current HPI
- 193.4175
- Rent YoY
- ▲ 4.06%
- Metro
- Dayton-Kettering, OH
- State GDP YoY
- ▲ 1.98%
- F500 in state
- 48
Industry mix (Fortune 500 HQ in OH)
| Industry | F500 HQs | Revenue |
|---|---|---|
| Insurance | 3 | $145B |
|
||
| Industrial Machinery | 3 | $49B |
|
||
| Financial Services | 3 | $24B |
|
||
| Consumer Goods | 2 | $93B |
|
||
| Aerospace / Defense | 2 | $47B |
|
||
| Utilities | 2 | $33B |
|
||
Property tax history
+20.7%/yrLatest (2025): $1,424 · +61.9% YoY. Source: county tax records.
Cash-flow waterfall
monthlySold comps — $/sqft
last 12 mo · ≤1 miLoading sold comps…