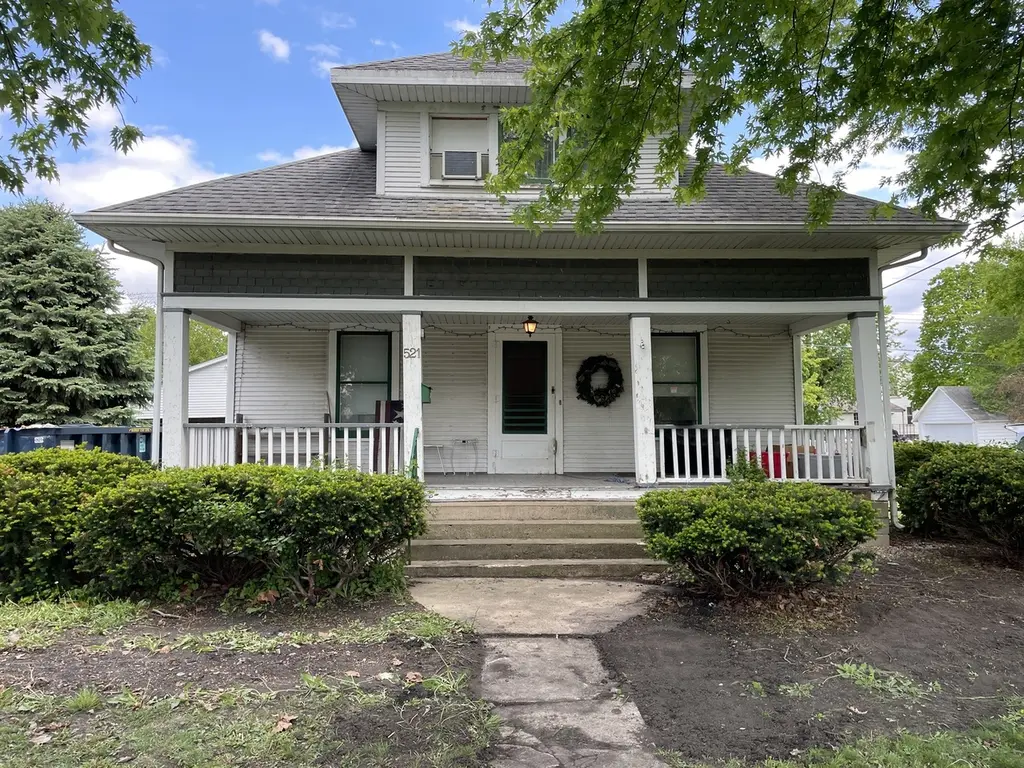
521 S Central St · Gilman, IL
Flood risk 5/10 · Moderate
- FEMA flood zone
- X (unshaded)
- Chance of flooding over 30 yrs
- 0.66%
- Est. flood insurance / yr
- $473 – $860
Fire risk 1/10 · Minimal
- Est. fire insurance / yr
- $804 – $1,492
Heat risk 3/10 · Minor
- Hot days now (above 104°F)
- 7 days/yr
- Hot days in 30 yrs
- 17 days/yr
Wind risk 2/10 · Minimal
- Chance of severe wind over 30 yrs
- 1.0%
Air-quality risk 2/10 · Minimal
- Unhealthy air days now
- 1 days/yr
- Unhealthy air days in 30 yrs
- 1 days/yr
Risk factors via First Street. Map © Google.
Why this score? — see what drove the B+ grade
The composite is a weighted blend of 9 inputs, each scored 0–100. Each bar is that input's sub-score; the figure is the points it added to the 100-point composite (weight × sub-score).
- Cash flow +29.4/30.0
- ARV discount +15.0/15.0
- 1% rule +10.0/10.0
- DSCR +10.0/10.0
- Livability +3.1/5.0
- Schools +2.6/10.0
- Rent growth +2.5/5.0
- Condition / age +2.5/5.0
- Appreciation +0.0/10.0
$60,000
🖨 Deal sheet 📄 Offer letter ✓ Due diligence
Listing remarks
Opportunity awaits in this 3 bedroom, 1 bath home situated on a corner lot in Gilman. Featuring a main floor bedroom and full basement, this property offers a functional layout with great potential for renovation or investment. The home includes a spacious covered front porch, ideal for relaxing or enhancing curb appeal, along with a 2.5 car detached garage providing ample storage and parking. Interior features suggest the possibility of original woodwork that could be restored to highlight the home's character. With solid bones and a desirable lot, this property is well-suited for investors, rehabbers, or buyers looking to build equity through updates and improvements. Property is being so
Key facts
- Covered front porch
- Full basement
- Original woodwork
Tags
Property features AI
Finance
- Other: Zoning: single-family; Lot size less than 0.25 acre; Directions: Crescent to Wenona to Central (corner)
- HOA & community: No master association fee required
Exterior
- Parking: Detached garage providing approximately 2.5 garage/parking spaces
- Utilities: Public water; Public sewer
- Home design: Detached single-family home; 1.5-story design; Fee simple ownership; Property is over 100 years old; Built before 1978; School bus service available
- Construction: Aluminum siding
- Exterior features: Porch; Corner lot
Interior
- Kitchen: Kitchen on main level with linoleum flooring
- Bedrooms: Three bedrooms (master bedroom on main level; two additional bedrooms on second level)
- Flooring: Hardwood flooring in living room, master bedroom, and two upstairs bedrooms; Linoleum flooring in kitchen; Other flooring in dining room
- Bathrooms: One full bathroom
- Heating & cooling: Natural gas heating; Window air conditioning units
- Interior features: Six total rooms; Full unfinished basement
- Laundry & utility: Laundry room
Neighborhood map
What this means for you Summary
Snapshot
- This is a 3-bed/1.0-bath single-family listed at $60k.
Deal economics
- At list price, monthly cash flow is $213 ($3k/yr) — positive.
- The deal already cash-flows at list — no discount required.
- Meets the 1% rule at list price ($904 rent vs $60k).
Location & tenants
- Location reads 61/100 on livability (#912 in IL) — a middle-class / working-renter tenant base. Strengths: crime A+, cost of living A+, housing A+; Watch: employment C-, schools D-, amenities F.
- Iroquois West CUSD 10 (town): math 29% / reading 30% proficiency, ranked #255 of 620 in IL (top 41%) — low school quality limits family demand, transient renter base, plan for 1-2y turnover.
- Market conditions: 14 active listings in the ZIP; 14 units permitted in Iroquois County in 2024 (0 in 5+ unit buildings).
Forward outlook
- Local home prices are declining (-3.0%/yr); year-one equity from $415 of loan paydown is wiped out by about $2k of value loss. Plan a longer hold.
- Iroquois County population projected at -20% by 2050 — secular population decline; favor cash flow + early exit over multi-decade hold.
- At projected returns (-3.0% appreciation + 3.0% rent growth), your $17k cash investment doubles in ~8 years — after that, you're playing with house money.
Negotiation context
- Only 10 days on market — expect competitive offers; lowballing is unlikely to land.
Risks & watch-outs
- Watch-outs: property tax is 3.2% of price; built in 1920 — expect roof / HVAC / electrical / plumbing capex.
- Climate carrying-cost: moderate flood risk — expect insurance premiums to compound above CPI over the hold.
Questions for the listing agent
- Built in 1920 — when were the roof, HVAC, electrical panel, plumbing, and water heater last replaced?
- Property tax is high relative to price — has the assessment been appealed recently, and will the sale trigger a re-assessment?
- Is there a deadline driving the sale (1031 exchange, divorce, estate, relocation)? That informs how much negotiation room exists.
- Schools are D-rated, which usually means shorter tenancies and higher turnover. Who's the typical renter profile here, and what's been the actual vacancy rate?
- What's the average days-on-market for RENTAL listings here right now (not sales)? A rising rental-DOM trend means longer vacancies and softer asking-rent achievability than the comps imply.
- What's the recent tenant-quality profile in this submarket — average credit score on applications, eviction rate, late-payment / NSF rate, and stable-employment percentage? A property-management company in the area should have these aggregated.
- How much new for-sale + rental construction is in the pipeline within 1–3 miles? Heavy new supply typically softens prices + rents 12–24 months out; constrained supply supports both.
Investment metrics
- 1% rule
- 1.51% ✓
- Cap rate
- 10.55%
- Cash-on-cash
- 15.20%
- DSCR
- 1.68
- GRM
- 5.5
CMA / ARV
- ARV (median comp)
- $101,219
- List price
- $60,000
- Delta
- -40.72%
- Verdict
- UNDERPRICED
- Comps
- 12 within 1.0 mi
Show comp detail 2 sales within ~0.75 mi
| Address | Dist | Beds/Ba | Sqft | Sold | Price | $/sf | Match |
|---|---|---|---|---|---|---|---|
| 521 S Central St | 0.00mi | 3/1.0 | 826 (0%) | 1mo | $60,000 | $73 | 100 |
| 618 S Thomas St | 0.13mi | 2/1.0 (-1) | 936 (+13%) | 0mo | $154,900 | $165 | 66 |
Match score weights: distance 35% · size 25% · config 20% · recency 20%. Top-matched comps best support the ARV.
Projected returns pro-forma
-3.0% appreciation · 3.0% rent growth · sell at horizon
- IRR
- 6.0%
- Equity multiple
- 1.23×
- Total profit
- $3,898
- Equity at exit
- $8,946
- IRR
- 15.4%
- Equity multiple
- 2.26×
- Total profit
- $21,119
- Equity at exit
- $5,188
Cash invested: $16,800 (down + closing). Projections, not guarantees.
Landlord ↔ Tenant lean methodology
- Overall (STATE)
- 43 Moderately Tenant-Leaning
- State Illinois
- 43 Moderately Tenant-Leaning · D+7
- County
- — inherits STATE
- City
- — inherits STATE
ZIP-level market 60938
- Home prices YoY
- -16.4%
- Active inventory
- 14
- Price-to-rent
- 5.5×
Monthly cashflow live
- Estimated rent
- $904 medium interval (Pro) →
- Mortgage (P&I)
- −$315
- Tax from tax record
- −$162 /mo · $1,944/yr
- Insurance
- −$25
- HOA
- −$0
- Vacancy / Maint / Mgmt
- −$190
- Net cashflow
- $213
Break-even live
UW: 25.0% down · 7.5% · 30yr · 1.5% tax · 5.0% vac · 8.0% maint · 8.0% mgmt
Financing live
Cash to close
- Down payment
- $15,000
- Closing costs
- $1,800
- Reserves months
- —
- Total cash needed
- —
Loan-product check · same deal, 3 products live
Conventional
25% down · 7.5% · 30yr
- Down + closing
- —
- Monthly P&I
- —
- Monthly cashflow
- —
- DSCR
- —
- Eligible?
- —
Personal DTI + credit; lowest rate.
DSCR
20% down · 8.5% · 30yr
- Down + closing
- —
- Monthly P&I
- —
- Monthly cashflow
- —
- DSCR
- —
- Eligible?
- —
No personal income docs; deal must DSCR.
Hard money
10% down · 12.0% · 12mo
- Down + closing
- —
- Monthly P&I
- —
- Monthly cashflow
- —
- DSCR
- —
- Eligible?
- —
Short-term bridge; refi at stabilization.
Listing history 2 events
-
2026-05-15status Pending 710-char remark
-
2026-05-05$60,000 Active 710-char remark
ⓘ Source: listings_history table (triggers on properties + properties_extension) + one-shot
backfill from property_details.listing_events for pre-trigger history.
Tax reassessment forecast IL · Partial reset (capped growth)
- Current annual tax
- $1,944 · $162/mo
- Projected year-2 tax
- $1,944 · $162/mo
- Expected delta
- $0/yr ($0/mo · 0.0%)
ⓘ Screening estimate from a state-policy table — verify with the county assessor before closing.
Climate risk First Street
- Flood 5/10 Major FEMA zone X (unshaded) · 66% chance over 30 yrs
- Wildfire 1/10 Low
- Heat 3/10 Moderate 7 d/yr ≥104°F today · 17 d/yr by 30 yrs out
- Wind 2/10 Low 100% chance of damaging wind over 30 yrs
- Air quality 2/10 Low 1 unhealthy d/yr today · 1 by 30 yrs out
Nearby sold comps map
Loading sold comps map…
Walkable amenities ~0.75 mi
Loading nearby amenities…
Taxation est. · year 1
- Rental income
- $10,853
- − Mortgage interest
- −$3,361
- − Property taxes
- −$1,944
- − Insurance
- −$300
- − Repairs & maintenance
- −$868
- − Management
- −$868
- − Depreciation
- −$1,745
- Taxable income
- $1,766
- Est. tax owed @ 24.0%
- −$424
- After-tax cash flow
- $2,130/yr
For passive investors: Depreciation is non-cash, so a rental often shows a tax loss while cash-flowing — sheltering income. Rental losses are passive: they offset passive income freely, and up to $25,000/yr can offset ordinary (W-2) income if you actively participate and your MAGI is under $100k (phasing out to $0 by $150k); unused losses carry forward. On sale, claimed depreciation is recaptured at up to 25%, and gains may owe capital-gains tax (a 1031 exchange can defer both). Figures are a year-1 estimate at your 24.0% rate — not tax advice; consult a CPA.
Schools (NCES district)
- District
- Iroquois West CUSD 10
- NCES district ID
- 1720180
- Math proficiency
- 29% ▼ -1.00%
- Reading proficiency
- 30% ▼ -9.00%
- Median HH income
- $47,456
- Composite
- 25.55/100
- National rank
- #7428
- State rank
- #255 of 620 in IL
Livability — Gilman
- Score
- 61/100
- State rank
- #912
- US rank
- #17705
Category grades
Schools grade is shown separately in the Schools card above.
Census & demographics
- Census place
- Gilman, IL
- City population
- 1,973
- Population (ZIP)
- 1,973
Population outlook (Iroquois County) Hauer SSP2
- Today (2025)
- 26,826 people
- By 2030
- 25,771 · -3.9%
- By 2040
- 23,589 · -12.1%
- By 2050
- 21,523 · -19.8%
- By 2075
- 17,998 · -32.9%
- By 2100
- 14,979 · -44.2%
Race, ethnicity, and origin ACS 2023
- Neighborhood character
- Predominantly White (79%)
- Race & ethnicity
- White 79% Hispanic / Latino 19% Two or more races 5%
- Hispanic origin (detail)
- Mexican 17%
- Common ancestry
- Iranian 5% Lithuanian 4% Romanian 2%
- Foreign-born
- 9% · Canada
- Languages at home
- 85% English-only · Spanish 15%
Political lean MEDSL · Iroquois
- 2024 margin
- Solid R (+57.3) · D 20.6% · R 78.0% · Other 1.4%
- 2008→2024 swing
- -27.5pp toward R · 2008: -29.8pp · 2024: -57.3pp
- All cycles
- 2024: R+57.3 2020: R+56.7 2016: R+56.0 2012: R+44.7 2008: R+29.8
Not yet ingested
- Civics
- —
Market trends
- HPI YoY
- ▼ -32.31%
- Current HPI
- 164.857
- Rent YoY
- —
- Metro
- —
- State GDP YoY
- ▲ 1.59%
- F500 in state
- 60
Industry mix (Fortune 500 HQ in IL)
| Industry | F500 HQs | Revenue |
|---|---|---|
| Insurance | 4 | $201B |
|
||
| Consumer Goods | 4 | $87B |
|
||
| Industrial Machinery | 3 | $64B |
|
||
| Healthcare | 2 | $55B |
|
||
| Retail / Pharmacy | 1 | $148B |
|
||
| Agriculture / Food | 1 | $86B |
|
||
Price history
+0.0% since first listed3 events — show timeline
- 2026-06-02 Sold (MLS) $60,000 MRED as Distributed by MLS Grid
- 2026-05-15 Pending — MRED as Distributed by MLS Grid
- 2026-05-05 Listed $60,000 MRED as Distributed by MLS Grid
Property tax history
+61.5%/yrLatest (2024): $1,944 · +20.4% YoY. Source: county tax records.
Cash-flow waterfall
monthlySold comps — $/sqft
last 12 mo · ≤1 miLoading sold comps…