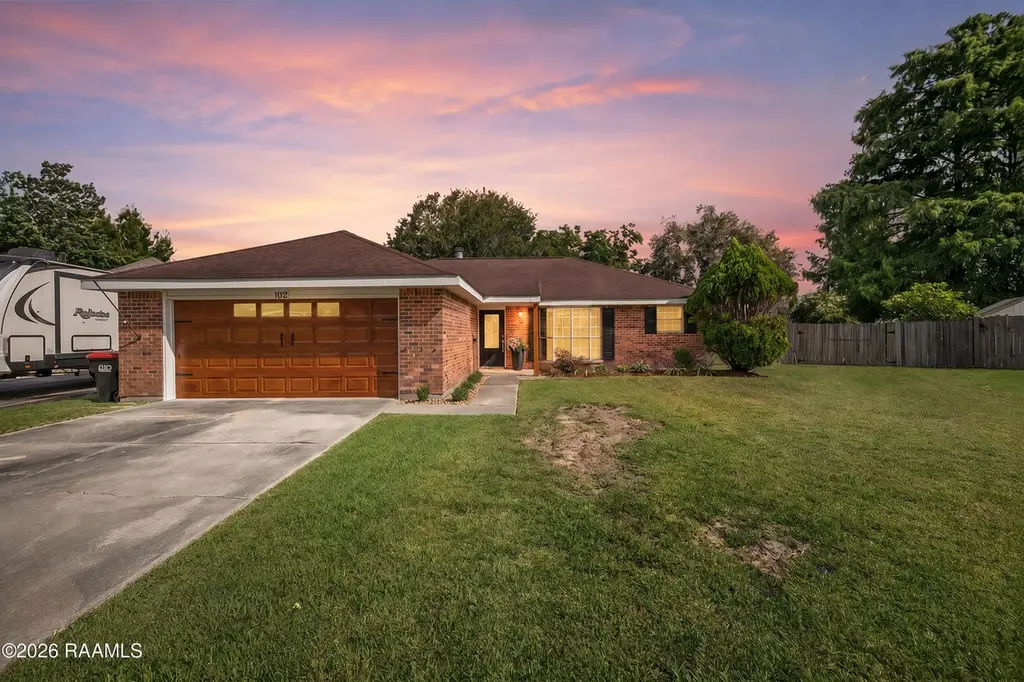
102 Albania Ct · Lafayette, LA
Flood risk 1/10 · Minimal
- FEMA flood zone
- X (unshaded)
- Chance of flooding over 30 yrs
- 0.0%
- Est. flood insurance / yr
- $507 – $1,088
Fire risk 2/10 · Minimal
- Est. fire insurance / yr
- $1,269 – $2,357
Heat risk 9/10 · Severe
- Hot days now (above 109°F)
- 7 days/yr
- Hot days in 30 yrs
- 21 days/yr
Wind risk 9/10 · Severe
- Chance of severe wind over 30 yrs
- 99.0%
Air-quality risk 1/10 · Minimal
- Unhealthy air days now
- 0 days/yr
- Unhealthy air days in 30 yrs
- 0 days/yr
Risk factors via First Street. Map © Google.
Why this score? — see what drove the D+ grade
The composite is a weighted blend of 9 inputs, each scored 0–100. Each bar is that input's sub-score; the figure is the points it added to the 100-point composite (weight × sub-score).
- ARV discount +15.0/15.0
- Cash flow +13.2/30.0
- DSCR +4.0/10.0
- Schools +3.6/10.0
- Livability +3.5/5.0
- 1% rule +3.0/10.0
- Rent growth +2.6/5.0
- Condition / age +2.5/5.0
- Appreciation +0.0/10.0
$240,000
🖨 Deal sheet 📄 Offer letter ✓ Due diligence
Listing remarks MLS
sold before listing
Key facts
- Open layout
- Recessed lighting
- Exposed beams
Tags
Property features AI
Exterior
- Parking: 2 total parking spaces; 2 covered garage spaces
- Utilities: Public sewer; City electric
- Home design: Single family residence
- Construction: Brick veneer and frame construction; Composition roof
- Exterior features: Exterior lighting; Covered, screened porch; Workshop (outbuilding); Full wood fencing with gate; Cul-de-sac frontage
Interior
- Kitchen: Dishwasher; Disposal; Electric stove/oven; Refrigerator; Cultured marble and Formica countertops
- Flooring: Carpet; Vinyl
- Bathrooms: 2 full bathrooms
- Heating & cooling: Central heating (electric); Central air conditioning
- Interior features: Cathedral ceilings; Crown molding; Double vanity; Dual closets; Varied ceiling heights; Walk-in closet(s); Cultured marble counters; Formica counters; Wood-burning fireplace (1)
- Laundry & utility: Washer hookup; Electric dryer hookup
Neighborhood map
What this means for you Summary
Snapshot
- This is a 3-bed/2.0-bath single-family listed at $240k.
Deal economics
- At list price, monthly cash flow is $-4 ($-45/yr) — negative.
- To cash-flow at today's rent, offer at most $239k (0.3% below list).
- To meet the 1% rule (rent ≥ 1% of price), the offer needs to be $193k (19.8% below list).
- Recommended offer: $193k (19.8% below list) — sets the bar for 1% rule.
- Cap rate 6.3% vs local median 4.7% in Lafayette — top-decile yield for the area; either an underpriced asset or a hidden risk that comps aren't pricing in. Stress-test before assuming the spread holds.
Location & tenants
- Location reads 70/100 on livability (#63 in LA) — a middle-class / working-renter tenant base. Strengths: cost of living A+, housing A+, health & safety A+; Watch: amenities C-, employment C-, crime F.
- Lafayette Parish (urban): math 38% / reading 46% proficiency, ranked #19 of 98 in LA (top 19%) — families likely to look elsewhere, expect single-tenant / working-renter base with shorter leases.
- Zoned schools: Broadmoor Elementary School (math 62% / reading 65%, grade B, #47 of 646 statewide, top 7%, 801 students, 54% FRL); Edgar Martin Middle School (math 40% / reading 53%, grade D+, #41 of 218 statewide, top 19%, 490 students, 59% FRL); O. Comeaux High School (math 38% / reading 40%, grade F, #86 of 265 statewide, top 33%, 1,098 students, 56% FRL) — zoned schools at 56% FRL track the district average.
- Market conditions: Rents flat; 235 active listings in the ZIP; 20 comparable units currently listed for rent nearby; rentals at typical pace (median 21d on market — plan ~3-4 weeks tenant-placement turnaround); solid renter incomes; 1,585 units permitted in Lafayette Parish in 2024 (10 in 5+ unit buildings).
Forward outlook
- Local home prices are declining (-3.0%/yr); year-one equity from $2k of loan paydown is wiped out by about $7k of value loss. Plan a longer hold.
- Lafayette County population projected at +34% by 2050 — long-run rental-demand tailwind backs the buy-and-hold thesis.
Negotiation context
- Only 5 days on market — expect competitive offers; lowballing is unlikely to land.
- 3 sale attempts since 27y ago with the ask held roughly flat each time — persistent listings suggest the price (not the market) is what's stuck; bring a comps-based counter.
- Current owner paid $195k; 23% above their basis — modest negotiation headroom, anchor on the comps not their cost.
Risks & watch-outs
- Climate carrying-cost: severe wind risk, 99% chance of damaging wind over 30y; extreme-heat days projected 7→21/yr by 2055 (HVAC capex compounding) — expect insurance premiums to compound above CPI over the hold.
Questions for the listing agent
- What do current leases actually rent for vs. the listed asking? Can we see a recent rent roll and the last 12 months of T-12 income?
- Built in 1979 — when were the roof, HVAC, electrical panel, plumbing, and water heater last replaced?
- Is there a deadline driving the sale (1031 exchange, divorce, estate, relocation)? That informs how much negotiation room exists.
- Schools are B-rated — typically a magnet for longer-tenancy family renters. What's the average tenant stay here, and is there a school-zone premium baked into asking?
- Crime grade is F in this area — have there been break-ins, vandalism, or insurance claims at this property in the last 3 years? What carrier currently insures it and at what premium?
- The area grade is low — what's the realistic commute time and amenity access for the typical tenant pool here? Any planned neighborhood developments (good or bad) we should know about?
- What's the average days-on-market for RENTAL listings here right now (not sales)? A rising rental-DOM trend means longer vacancies and softer asking-rent achievability than the comps imply.
- What's the recent tenant-quality profile in this submarket — average credit score on applications, eviction rate, late-payment / NSF rate, and stable-employment percentage? A property-management company in the area should have these aggregated.
- How much new for-sale + rental construction is in the pipeline within 1–3 miles? Heavy new supply typically softens prices + rents 12–24 months out; constrained supply supports both.
Investment metrics
- 1% rule
- 0.80% ✗
- Cap rate
- 6.27%
- Cash-on-cash
- -0.07%
- DSCR
- 1.00
- GRM
- 10.4
CMA / ARV
- ARV (on-the-fly)
- $338,200
- Comps found
- 12
Show comp detail 12 sales within ~0.75 mi
| Address | Dist | Beds/Ba | Sqft | Sold | Price | $/sf | Match |
|---|---|---|---|---|---|---|---|
| 201 B Camino Real Rd | 0.08mi | 3/2.0 | 1,616 (-9%) | 4mo | $190,000 | $118 | 78 |
| 205 Fillmore Way | 0.52mi | 3/2.0 | 1,767 (-1%) | 8mo | $339,500 | $192 | 68 |
| 203 Fillmore Way | 0.53mi | 3/2.0 | 1,730 (-3%) | 6mo | $334,000 | $193 | 65 |
| 121 Pleasant View Dr | 0.60mi | 3/2.0 | 1,850 (+4%) | 2mo | $250,000 | $135 | 64 |
| 209 Fillmore Way | 0.51mi | 3/2.0 | 1,852 (+4%) | 6mo | $360,000 | $194 | 64 |
| 619 Canberra Rd | 0.48mi | 3/2.0 | 1,568 (-12%) | 1mo | $219,900 | $140 | 57 |
| 102 Sun Vista Ln | 0.67mi | 3/2.5 | 1,843 (+4%) | 4mo | $352,900 | $191 | 57 |
| 508 Capstone Xing | 0.64mi | 3/2.0 | 1,905 (+7%) | 2mo | $374,500 | $197 | 57 |
| 201 Fillmore Way | 0.53mi | 4/2.0 (+1) | 1,887 (+6%) | 4mo | $358,900 | $190 | 56 |
| 135 Pleasant View Dr | 0.68mi | 3/2.0 | 1,686 (-5%) | 4mo | $230,000 | $136 | 56 |
| 600 Capstone Xing | 0.61mi | 4/2.0 (+1) | 1,887 (+6%) | 5mo | $358,900 | $190 | 53 |
| 914 Rosedown Ln | 0.74mi | 3/2.0 | 1,651 (-7%) | 5mo | $235,000 | $142 | 49 |
Match score weights: distance 35% · size 25% · config 20% · recency 20%. Top-matched comps best support the ARV.
Projected returns pro-forma
-3.0% appreciation · 0.36% rent growth · sell at horizon
- IRR
- -19.2%
- Equity multiple
- 0.34×
- Total profit
- $-44,168
- Equity at exit
- $35,785
- IRR
- -17.9%
- Equity multiple
- 0.13×
- Total profit
- $-58,384
- Equity at exit
- $20,751
Cash invested: $67,200 (down + closing). Projections, not guarantees.
Landlord ↔ Tenant lean methodology
- Overall (STATE)
- 90 Strongly Landlord-Friendly
- State Louisiana
- 90 Strongly Landlord-Friendly · R+12
- County
- — inherits STATE
- City
- — inherits STATE
ZIP-level market 70503
- Home prices YoY
- -34.0%
- Rents YoY
- 0.4%
- Active inventory
- 235
- Price-to-rent
- 10.4×
Monthly cashflow live
- Estimated rent
- $1,926 high interval (Pro) →
- Mortgage (P&I)
- −$1,259
- Tax from tax record
- −$166 /mo · $1,997/yr
- Insurance
- −$100
- HOA
- −$0
- Vacancy / Maint / Mgmt
- −$404
- Net cashflow
- $-4
Break-even live
UW: 25.0% down · 7.5% · 30yr · 1.5% tax · 5.0% vac · 8.0% maint · 8.0% mgmt
Financing live
Cash to close
- Down payment
- $60,000
- Closing costs
- $7,200
- Reserves months
- —
- Total cash needed
- —
Loan-product check · same deal, 3 products live
Conventional
25% down · 7.5% · 30yr
- Down + closing
- —
- Monthly P&I
- —
- Monthly cashflow
- —
- DSCR
- —
- Eligible?
- —
Personal DTI + credit; lowest rate.
DSCR
20% down · 8.5% · 30yr
- Down + closing
- —
- Monthly P&I
- —
- Monthly cashflow
- —
- DSCR
- —
- Eligible?
- —
No personal income docs; deal must DSCR.
Hard money
10% down · 12.0% · 12mo
- Down + closing
- —
- Monthly P&I
- —
- Monthly cashflow
- —
- DSCR
- —
- Eligible?
- —
Short-term bridge; refi at stabilization.
Rent comps 20 comps
| Address | Beds | Baths | Sqft | Rent | $/sqft | DOM | Units | Dist |
|---|---|---|---|---|---|---|---|---|
| 330 Dunvegan Ct Lafayette, LA | 3.0 | 2.5 | 1848 | $2,400 | $1.30 | 43d | 1 | 0.35mi |
| 709 Rosedown Ln Lafayette, LA | 3.0 | 2.0 | 1800 | $1,700 | $0.94 | 43d | 1 | 0.48mi |
| 104 Marblehead Ave Lafayette, LA | 2.0–3.0 | 2.0–2.5 | 1448 | $2,668 | $1.84 | 13d | 126 | 0.71mi |
| 6000 Johnston St Lafayette, LA | 1.0–3.0 | 1.0–2.0 | 1093 | $1,740 | $1.59 | 13d | 20 | 0.84mi |
| 903 Canberra Rd Lafayette, LA | 3.0 | 2.0 | 1752 | $1,975 | $1.13 | 21d | 1 | 0.91mi |
| 201 Finsbury Ln Lafayette, LA | 3.0 | 2.0 | 1730 | $2,575 | $1.49 | 21d | 1 | 0.91mi |
| 1200 Robley Dr Lafayette, LA | 1.0–3.0 | 1.0–2.0 | 965 | $1,674 | $1.73 | 13d | 18 | 0.97mi |
| 225 Shadowbrush Bnd Lafayette, LA | 3.0 | 2.0 | 1585 | $1,700 | $1.07 | 43d | 1 | 1.04mi |
| 1100 Robley Dr Lafayette, LA | 1.0–3.0 | 1.0–2.0 | 1057 | $1,802 | $1.70 | 13d | 17 | 1.08mi |
| 600 Glade Blvd Lafayette, LA | 3.0 | 2.0 | 1617 | $1,695 | $1.05 | 13d | 1 | 1.09mi |
| 303 Belle Grove Blvd Lafayette, LA | 3.0 | 2.0 | 1700 | $1,700 | $1.00 | 21d | 1 | 1.15mi |
| 1630 Rue du Belier Lafayette, LA | 1.0–3.0 | 1.0–2.0 | 1060 | $1,600 | $1.51 | 13d | 25 | 1.18mi |
| 115 Hermitage Ave Lafayette, LA | 3.0 | 2.0 | 2190 | $2,000 | $0.91 | 13d | 1 | 1.22mi |
| 221 Wakely CT Lafayette, LA | 3.0 | 2.0 | 1659 | $1,975 | $1.19 | 13d | 1 | 1.23mi |
| 106 Shadow Springs Dr Lafayette, LA | 3.0 | 2.0 | 1850 | $2,295 | $1.24 | 43d | 1 | 1.28mi |
| 106 Braddish Ct Lafayette, LA | 3.0 | 2.0 | 1659 | $1,900 | $1.15 | 21d | 1 | 1.29mi |
| 2339 Robley Dr Lafayette, LA | 3.0 | 2.0 | 1428 | $1,395 | $0.98 | 13d | 1 | 1.32mi |
| 304 Tall Meadows Ln Lafayette, LA | 3.0 | 2.0 | 1689 | $1,850 | $1.10 | 43d | 1 | 1.44mi |
| 303 Tall Meadows Ln Lafayette, LA | 3.0 | 2.0 | 1522 | $2,000 | $1.31 | 21d | 1 | 1.44mi |
| 105 Alpine Meadows Ln Lafayette, LA | 3.0 | 2.0 | 1629 | $1,945 | $1.19 | 21d | 1 | 1.49mi |
Listing history 6 events
-
2026-06-17status $240,000 Pending 5 DOM
-
2026-06-17days on market $240,000 Active 5 DOM
-
2026-06-16days on market $240,000 Active 4 DOM
-
2026-06-15days on market $240,000 Active 3 DOM
-
2026-06-13remarks 699-char remark
-
2026-06-13$240,000 Active 1 DOM
ⓘ Source: listings_history table (triggers on properties + properties_extension) + one-shot
backfill from property_details.listing_events for pre-trigger history.
Tax reassessment forecast LA · Resets to sale price
- Current annual tax
- $1,997 · $166/mo
- Projected year-2 tax
- $1,997 · $166/mo
- Expected delta
- $0/yr ($0/mo · 0.0%)
ⓘ Screening estimate from a state-policy table — verify with the county assessor before closing.
Climate risk First Street
- Flood 1/10 Low FEMA zone X (unshaded) · 0% chance over 30 yrs
- Wildfire 2/10 Low
- Heat 9/10 Extreme 7 d/yr ≥109°F today · 21 d/yr by 30 yrs out
- Wind 9/10 Extreme 99% chance of damaging wind over 30 yrs
- Air quality 1/10 Low 0 unhealthy d/yr today · 0 by 30 yrs out
Nearby sold comps map
Loading sold comps map…
Walkable amenities ~0.75 mi
Loading nearby amenities…
Taxation est. · year 1
- Rental income
- $23,107
- − Mortgage interest
- −$13,444
- − Property taxes
- −$1,997
- − Insurance
- −$1,200
- − Repairs & maintenance
- −$1,849
- − Management
- −$1,849
- − Depreciation
- −$6,982
- Taxable loss
- −$4,213
- Est. tax savings @ 24.0%
- +$1,011
- After-tax cash flow
- $966/yr
For passive investors: Depreciation is non-cash, so a rental often shows a tax loss while cash-flowing — sheltering income. Rental losses are passive: they offset passive income freely, and up to $25,000/yr can offset ordinary (W-2) income if you actively participate and your MAGI is under $100k (phasing out to $0 by $150k); unused losses carry forward. On sale, claimed depreciation is recaptured at up to 25%, and gains may owe capital-gains tax (a 1031 exchange can defer both). Figures are a year-1 estimate at your 24.0% rate — not tax advice; consult a CPA.
Schools (NCES district)
- District
- Lafayette Parish
- NCES district ID
- 2200870
- Math proficiency
- 38% ▼ -32.00%
- Reading proficiency
- 46% ▼ -24.00%
- Median HH income
- $50,238
- Composite
- 36.15/100
- National rank
- #4741
- State rank
- #19 of 98 in LA
Livability — Lafayette
- Score
- 70/100
- State rank
- #63
- US rank
- #8133
Category grades
Schools grade is shown separately in the Schools card above.
Census & demographics
- Census place
- Lafayette, LA
- County
- Lafayette Parish · 207,544 people
- City population
- 158,114
- Metro
- Lafayette, LA
- Population (ZIP)
- 28,643
- Household income
- $94,688
- Rent vs Own
- Severe rent burden
- 769.0
Population outlook (Lafayette County) Hauer SSP2
- Today (2025)
- 280,930 people
- By 2030
- 301,092 · +7.2%
- By 2040
- 339,456 · +20.8%
- By 2050
- 375,156 · +33.5%
- By 2075
- 451,672 · +60.8%
- By 2100
- 497,203 · +77.0%
Race, ethnicity, and origin ACS 2023
- Neighborhood character
- Predominantly White (74%)
- Race & ethnicity
- White 74% Black 10% Hispanic / Latino 8% Two or more races 6% Asian 3%
- Hispanic origin (detail)
- Mexican 3%
- Common ancestry
- Lithuanian 23% Slovak 2% Italian 2%
- Foreign-born
- 6% · Canada, Vietnam, China
- Languages at home
- 88% English-only · Spanish 5% French/Haitian/Cajun 3% Other Indo-European 1%
Political lean MEDSL · Lafayette
- 2024 margin
- Solid R (+31.4) · D 33.5% · R 64.8% · Other 1.7%
- 2008→2024 swing
- -0.1pp no change · 2008: -31.3pp · 2024: -31.4pp
- All cycles
- 2024: R+31.4 2020: R+28.7 2016: R+33.6 2012: R+33.7 2008: R+31.3
Not yet ingested
- Civics
- —
Market trends
- HPI YoY
- ▼ -81.65%
- Current HPI
- 158.7094
- Rent YoY
- ▲ 0.36%
- Metro
- Lafayette, LA
- State GDP YoY
- ▲ 3.29%
- F500 in state
- 10
Industry mix (Fortune 500 HQ in LA)
| Industry | F500 HQs | Revenue |
|---|---|---|
| Telecommunications | 2 | $23B |
|
||
| Utilities | 1 | $12B |
|
||
| Wholesale / Distribution | 1 | $5B |
|
||
| Advertising | 1 | $2B |
|
||
Price history
+118.2% since first listed6 events — show timeline
- 2026-06-11 Listed $240,000 AcadianaMLS
- 2024-05-30 Sold (Public Records) $195,000 Public Records
- 2024-05-29 Sold (MLS) $195,000 AcadianaMLS
- 2024-03-11 Listed $215,000 AcadianaMLS
- 1999-06-04 Sold (MLS) $105,000 AcadianaMLS
- 1999-01-04 Listed $110,000 AcadianaMLS
Property tax history
+9.3%/yrLatest (2025): $1,997 · -1.1% YoY. Source: county tax records.
Cash-flow waterfall
monthlySold comps — $/sqft
last 12 mo · ≤1 miLoading sold comps…