701 Cassel Rd #105 · York Haven, PA
Flood risk 1/10 · Minimal
- FEMA flood zone
- X (unshaded)
- Chance of flooding over 30 yrs
- 0.0%
- Est. flood insurance / yr
- $507 – $1,088
Fire risk 1/10 · Minimal
- Est. fire insurance / yr
- $511 – $949
Heat risk 5/10 · Moderate
- Hot days now (above 101°F)
- 7 days/yr
- Hot days in 30 yrs
- 15 days/yr
Wind risk 4/10 · Minor
- Chance of severe wind over 30 yrs
- 9.0%
Air-quality risk 3/10 · Minor
- Unhealthy air days now
- 3 days/yr
- Unhealthy air days in 30 yrs
- 4 days/yr
Risk factors via First Street. Map © Google.
Why this score? — see what drove the B grade
The composite is a weighted blend of 9 inputs, each scored 0–100. Each bar is that input's sub-score; the figure is the points it added to the 100-point composite (weight × sub-score).
- Cash flow +30.0/30.0
- 1% rule +10.0/10.0
- DSCR +10.0/10.0
- ARV discount +8.9/15.0
- Schools +4.7/10.0
- Livability +3.3/5.0
- Rent growth +2.5/5.0
- Condition / age +2.2/5.0
- Appreciation +0.0/10.0
$92,900
🖨 Deal sheet (PDF) 📄 Offer letter ✓ Due diligence
Listing remarks
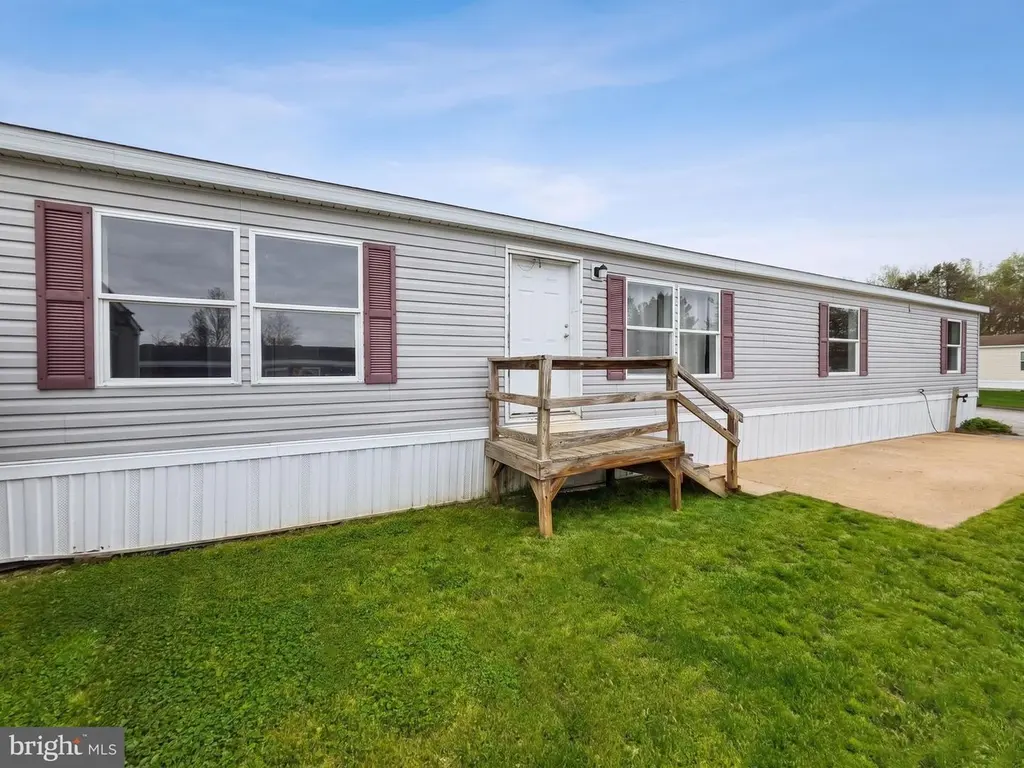
Don’t miss your chance to own this stunning 4-bedroom, 2-bathroom home offering over 1,750 square feet of modern, open-concept living. Located in the desirable Newberry Farms community, this spacious double-wide has been extensively upgraded with brand-new flooring, fresh interior paint, and new exterior skirting. The bright and airy layout features a large kitchen and dining area that flows seamlessly into a living room anchored by a cozy fireplace, making it the perfect space for both daily relaxation and effortless entertaining. The living space extends outdoors to a private deck and a sprawling backyard, offering plenty of room for gardening, outdoor dining, or weekend recreation.
Key facts
- Built 2006
- Listed 9 days
Property features AI
Finance
- Financial info: Property manager present; Lease not considered; Annual ground rent (listed under income/expense)
Exterior
- Parking: Driveway
- Utilities: Public water; Public sewer; Electric available; Propane available
- Home design: Manufactured home; Fee simple ownership; Very good condition; Year built estimated
- Construction: Vinyl siding; Aluminum siding; Asphalt roof
- Exterior features: Patio(s); Deck(s); Shed; Ground rent exists; Rural location in Newberry Farms
Interior
- Kitchen: Refrigerator; Gas oven/range; Dishwasher
- Bedrooms: Four bedrooms on main level; Master bedroom
- Flooring: Vinyl and luxury vinyl plank flooring
- Bathrooms: Two full bathrooms (both on main level)
- Heating & cooling: Forced air heating; Propane (owned) heating fuel; Central air conditioning (electric); Electric hot water
- Interior features: Estimated living area; Gas/Propane fireplace (1)
Neighborhood map
What this means for you Summary
Snapshot
- This is a 4-bed/2.0-bath single-family listed at $93k. Condition is rated fair.
Deal economics
- At list price, monthly cash flow is $817 ($10k/yr) — positive.
- The deal already cash-flows at list — no discount required.
- Meets the 1% rule at list price ($2k rent vs $93k).
Location & tenants
- Location reads 66/100 on livability (#1,044 in PA) — a middle-class / working-renter tenant base. Strengths: cost of living A+, housing A+; Watch: amenities F, commute F, employment D-.
- Northeastern York SD (suburban): math 45% / reading 63% proficiency, ranked #119 of 539 in PA (top 22%) — acceptable for families but not a draw, mixed tenant base, ~2y average lease.
- Zoned schools: York Haven El Sch (math 74% / reading 74%, grade A, #89 of 1,518 statewide, top 7%, 273 students, 50% FRL); Northeastern Ms (math 35% / reading 60%, grade C-, #156 of 512 statewide, top 32%, 653 students, 44% FRL); Northeastern Shs (math 73% / reading 50%, grade B-, #74 of 437 statewide, top 17%, 1,175 students, 41% FRL).
- Market conditions: 39 active listings in the ZIP; 1,328 units permitted in York County in 2024 (338 in 5+ unit buildings).
Forward outlook
- Local home prices are declining (-3.0%/yr); year-one equity from $642 of loan paydown is wiped out by about $3k of value loss. Plan a longer hold.
- At projected returns (-3.0% appreciation + 3.0% rent growth), your $26k cash investment doubles in ~4 years — after that, you're playing with house money.
Negotiation context
- Only 9 days on market — expect competitive offers; lowballing is unlikely to land.
- 3 sale attempts with the ask held roughly flat each time — persistent listings suggest the price (not the market) is what's stuck; bring a comps-based counter.
Risks & watch-outs
- Climate carrying-cost: extreme-heat days projected 7→15/yr by 2055 (HVAC capex compounding) — expect insurance premiums to compound above CPI over the hold.
Questions for the listing agent
- Have any recent inspections been done? Can we get a copy of the seller's disclosures and any deferred-maintenance estimates?
- Is there a deadline driving the sale (1031 exchange, divorce, estate, relocation)? That informs how much negotiation room exists.
- Schools are B-rated — typically a magnet for longer-tenancy family renters. What's the average tenant stay here, and is there a school-zone premium baked into asking?
- What's the average days-on-market for RENTAL listings here right now (not sales)? A rising rental-DOM trend means longer vacancies and softer asking-rent achievability than the comps imply.
- What's the recent tenant-quality profile in this submarket — average credit score on applications, eviction rate, late-payment / NSF rate, and stable-employment percentage? A property-management company in the area should have these aggregated.
- How much new for-sale + rental construction is in the pipeline within 1–3 miles? Heavy new supply typically softens prices + rents 12–24 months out; constrained supply supports both.
Investment metrics
- 1% rule
- 1.99% ✓
- Cap rate
- 16.85%
- Cash-on-cash
- 37.71%
- DSCR
- 2.68
- GRM
- 4.2
CMA / ARV
- ARV (median comp)
- $95,895
- List price
- $92,900
- Delta
- -3.12%
- Verdict
- FAIR
- Comps
- 20 within 1.0 mi
Show comp detail 7 sales within ~0.75 mi
| Address | Dist | Beds/Ba | Sqft | Sold | Price | $/sf | Match |
|---|---|---|---|---|---|---|---|
| 701 Cassel Rd #105 | 0.00mi | 4/2.0 | 1,792 (0%) | 1mo | $93,000 | $52 | 99 |
| 701 Cassel Rd | 0.00mi | 3/2.0 (-1) | 1,792 (0%) | 4mo | $95,000 | $53 | 92 |
| 701 Cassel Rd #59 | 0.02mi | 3/2.0 (-1) | 1,620 (-10%) | 6mo | $105,500 | $65 | 73 |
| 1635 Conewago Creek Rd | 0.66mi | 3/2.0 (-1) | 1,812 (+1%) | 1mo | $315,000 | $174 | 61 |
| 1370 Conewago Creek Rd | 0.66mi | 3/2.0 (-1) | 1,830 (+2%) | 6mo | $285,000 | $156 | 55 |
| 677 Cassel Rd Lot 169 | 0.33mi | 4/2.0 | 1,944 (+8%) | 22mo | $138,700 | $71 | 52 |
| 1510 Conewago Ave | 0.71mi | 3/2.0 (-1) | 1,880 (+5%) | 16mo | $312,000 | $166 | 41 |
Match score weights: distance 35% · size 25% · config 20% · recency 20%. Top-matched comps best support the ARV.
Projected returns pro-forma
-3.0% appreciation · 3.0% rent growth · sell at horizon
- IRR
- 33.7%
- Equity multiple
- 2.42×
- Total profit
- $37,039
- Equity at exit
- $13,852
- IRR
- 40.7%
- Equity multiple
- 4.82×
- Total profit
- $99,409
- Equity at exit
- $8,032
Cash invested: $26,012 (down + closing). Projections, not guarantees.
Landlord ↔ Tenant lean methodology
- Overall (STATE)
- 62 Landlord-Friendly
- State Pennsylvania
- 62 Landlord-Friendly · EVEN
- County
- — inherits STATE
- City
- — inherits STATE
ZIP-level market 17345
- Home prices YoY
- -16.8%
- Active inventory
- 39
- Price-to-rent
- 4.2×
Monthly cashflow live
- Estimated rent
- $1,847 medium interval (Pro) →
- Mortgage (P&I)
- −$487
- Tax est. 1.5%
- −$116 /mo · $1,394/yr
- Insurance
- −$39
- HOA
- −$0
- Vacancy / Maint / Mgmt
- −$388
- Net cashflow
- $817
Break-even live
Sensitivity live
| Price | -10% $882 | -5% $850 | +0% $817 | +5% $785 | +10% $753 |
|---|---|---|---|---|---|
| Rent | -10% $672 | -5% $745 | +0% $817 | +5% $890 | +10% $963 |
| Rate | -1.0pp $864 | -0.5pp $841 | base $817 | +0.5pp $793 | +1.0pp $769 |
UW: 25.0% down · 7.5% · 30yr · 1.5% tax · 5.0% vac · 8.0% maint · 8.0% mgmt
Financing live
Cash to close
- Down payment
- $23,225
- Closing costs
- $2,787
- Reserves months
- —
- Total cash needed
- —
Loan-product check · same deal, 3 products live
Conventional
25% down · 7.5% · 30yr
- Down + closing
- —
- Monthly P&I
- —
- Monthly cashflow
- —
- DSCR
- —
- Eligible?
- —
Personal DTI + credit; lowest rate.
DSCR
20% down · 8.5% · 30yr
- Down + closing
- —
- Monthly P&I
- —
- Monthly cashflow
- —
- DSCR
- —
- Eligible?
- —
No personal income docs; deal must DSCR.
Hard money
10% down · 12.0% · 12mo
- Down + closing
- —
- Monthly P&I
- —
- Monthly cashflow
- —
- DSCR
- —
- Eligible?
- —
Short-term bridge; refi at stabilization.
Listing history 10 events
-
2026-05-09status Pending 934-char remark
-
2026-05-01$92,900 Active 934-char remark
-
2026-04-29historical $92,900 934-char remark
-
2026-04-06historical
-
2025-12-31price $98,995
-
2025-11-09status Active
-
2025-10-31historical
-
2025-09-10price $99,995
-
2025-08-31$100,000 Active
-
2025-07-02historical
ⓘ Source: listings_history table (triggers on properties + properties_extension) + one-shot
backfill from property_details.listing_events for pre-trigger history.
Climate risk First Street
- Flood 1/10 Low FEMA zone X (unshaded) · 0% chance over 30 yrs
- Wildfire 1/10 Low
- Heat 5/10 Major 7 d/yr ≥101°F today · 15 d/yr by 30 yrs out
- Wind 4/10 Moderate 9% chance of damaging wind over 30 yrs
- Air quality 3/10 Moderate 3 unhealthy d/yr today · 4 by 30 yrs out
Nearby sold comps map
Loading sold comps map…
Walkable amenities ~0.75 mi
Loading nearby amenities…
Taxation est. · year 1
- Rental income
- $22,169
- − Mortgage interest
- −$5,204
- − Property taxes
- −$1,394
- − Insurance
- −$464
- − Repairs & maintenance
- −$1,774
- − Management
- −$1,774
- − Depreciation
- −$2,703
- Taxable income
- $8,858
- Est. tax owed @ 24.0%
- −$2,126
- After-tax cash flow
- $7,684/yr
For passive investors: Depreciation is non-cash, so a rental often shows a tax loss while cash-flowing — sheltering income. Rental losses are passive: they offset passive income freely, and up to $25,000/yr can offset ordinary (W-2) income if you actively participate and your MAGI is under $100k (phasing out to $0 by $150k); unused losses carry forward. On sale, claimed depreciation is recaptured at up to 25%, and gains may owe capital-gains tax (a 1031 exchange can defer both). Figures are a year-1 estimate at your 24.0% rate — not tax advice; consult a CPA.
Condition & rehab AI · 1 photo
This home requires moderate repairs to its exterior and siding, but has good interior and structural conditions. Painting and repairing the exterior would significantly enhance its resale value.
Repairs flagged
- Major exterior siding — Significant wear and peeling
- Major exterior paint — Peeling and faded
Value-add opportunities
- Resale paint exterior — Fresh paint enhances curb appeal
- Resale repair exterior siding — New siding improves home's appearance and value
- Rental landscaping — Well-maintained landscaping increases rental appeal
Renovation cost estimate screening
| Repair item | Severity | Est. cost |
|---|---|---|
| exterior siding · Significant wear and peeling | Major | $15,000–50,000 |
| exterior paint · Peeling and faded | Major | $15,000–50,000 |
| Total estimated repair cost · 2 items | $30,000–100,000 |
Value-add ROI direction
- Resale paint exterior — Fresh paint enhances curb appeal ↑
- Resale repair exterior siding — New siding improves home's appearance and value ↑
- Rental landscaping — Well-maintained landscaping increases rental appeal ↑
ⓘ Cost ranges are severity-bucket heuristics (US national rule-of-thumb). Get contractor quotes + a written scope before underwriting a rehab budget.
Schools (NCES district)
- District
- Northeastern York SD
- NCES district ID
- 4217520
- Math proficiency
- 45% ▼ -12.00%
- Reading proficiency
- 63% ▼ -10.00%
- Median HH income
- $60,807
- Composite
- 47.06/100
- National rank
- #2338
- State rank
- #119 of 539 in PA
Livability — York Haven
- Score
- 66/100
- State rank
- #1044
- US rank
- #11680
Category grades
Schools grade is shown separately in the Schools card above.
Census & demographics
- Population (ZIP)
- 8,106
Population outlook (York County) Hauer SSP2
- Today (2025)
- 454,205 people
- By 2030
- 457,407 · +0.7%
- By 2040
- 457,529 · +0.7%
- By 2050
- 448,261 · -1.3%
- By 2075
- 427,388 · -5.9%
- By 2100
- 384,218 · -15.4%
Race, ethnicity, and origin ACS 2023
- Neighborhood character
- Predominantly White (83%)
- Race & ethnicity
- White 83% Hispanic / Latino 9% Black 4% Two or more races 3% Asian 1%
- Hispanic origin (detail)
- Puerto Rican 4% Dominican 5%
- Common ancestry
- Slovak 4% Romanian 3% Lithuanian 2%
- Foreign-born
- 5% · Canada, Vietnam
- Languages at home
- 91% English-only · Spanish 6% Other Indo-European 1%
Political lean MEDSL · York
- 2024 margin
- Strong R (+25.3) · D 36.9% · R 62.1%
- 2008→2024 swing
- -11.7pp toward R · 2008: -13.6pp · 2024: -25.3pp
- All cycles
- 2024: R+25.3 2020: R+24.6 2016: R+29.3 2012: R+21.2 2008: R+13.6
Not yet ingested
- Civics
- —
Market trends
- HPI YoY
- ▼ -52.05%
- Current HPI
- 258.0184
- Rent YoY
- —
- Metro
- —
- State GDP YoY
- ▲ 1.68%
- F500 in state
- 34
Industry mix (Fortune 500 HQ in PA)
| Industry | F500 HQs | Revenue |
|---|---|---|
| Healthcare | 2 | $309B |
|
||
| Insurance | 2 | $27B |
|
||
| Telecommunications / Media | 1 | $124B |
|
||
| Industrial Distribution | 1 | $22B |
|
||
| Financial Services | 1 | $20B |
|
||
| Chemicals / Materials | 1 | $18B |
|
||
Price history
-7.0% since first listed11 events — show timeline
- 2026-05-26 Sold (MLS) $93,000 BRIGHT MLS
- 2026-05-09 Pending — BRIGHT MLS
- 2026-05-01 Listed $92,900 BRIGHT MLS
- 2026-04-29 Coming Soon $92,900 BRIGHT MLS
- 2026-04-06 Listing Removed — BRIGHT MLS
- 2025-12-31 Price Changed $98,995 BRIGHT MLS
- 2025-11-09 Relisted — BRIGHT MLS
- 2025-10-31 Listing Removed — BRIGHT MLS
- 2025-09-10 Price Changed $99,995 BRIGHT MLS
- 2025-08-31 Listed $100,000 BRIGHT MLS
- 2025-07-02 Coming Soon — BRIGHT MLS
Cash-flow waterfall
monthlySold comps — $/sqft
last 12 mo · ≤1 miLoading sold comps…