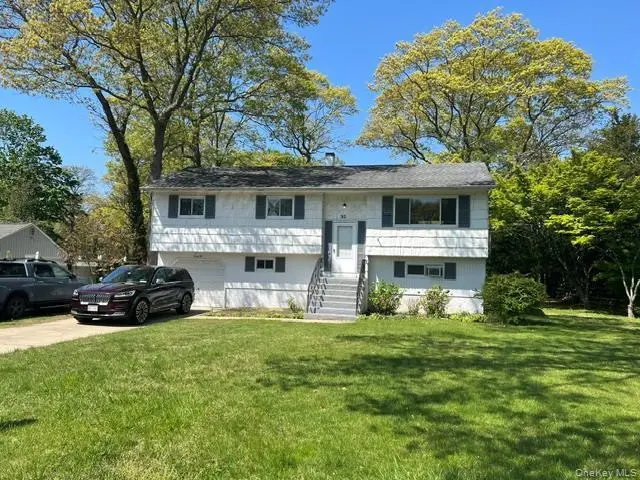
32 Vautrin Ave · Holtsville, NY
Flood risk 1/10 · Minimal
- FEMA flood zone
- X (unshaded)
- Chance of flooding over 30 yrs
- 0.0%
- Est. flood insurance / yr
- $507 – $1,088
Fire risk 1/10 · Minimal
- Est. fire insurance / yr
- $691 – $1,283
Heat risk 4/10 · Minor
- Hot days now (above 94°F)
- 7 days/yr
- Hot days in 30 yrs
- 17 days/yr
Wind risk 6/10 · Moderate
- Chance of severe wind over 30 yrs
- 77.0%
Air-quality risk 3/10 · Minor
- Unhealthy air days now
- 3 days/yr
- Unhealthy air days in 30 yrs
- 4 days/yr
Risk factors via First Street. Map © Google.
Why this score? — see what drove the D grade
The composite is a weighted blend of 9 inputs, each scored 0–100. Each bar is that input's sub-score; the figure is the points it added to the 100-point composite (weight × sub-score).
- ARV discount +14.1/15.0
- Cash flow +7.5/30.0
- Schools +6.6/10.0
- Livability +3.6/5.0
- 1% rule +2.7/10.0
- Rent growth +2.5/5.0
- Condition / age +2.5/5.0
- DSCR +1.6/10.0
- Appreciation +0.0/10.0
$625,000
🖨 Deal sheet 📄 Offer letter ✓ Due diligence
Listing remarks
Tucked away on a shy half-acre in Holtsville, this unique Hi-Ranch offers a rare combination of space, flexibility, and future potential. Tax records classify the property as a Single-Family Residence with an Associated Apartment designation, while a CO is already in place for the conversion of the attached garage to living area. This unique setup presents exciting possibilities for extended family accommodations, guest quarters, a home office, or other future living arrangements (buyer to verify all uses, permits, and requirements with the Town of Brookhaven). The upper level offers bright, sun-filled living spaces, hardwood floors, and comfortable everyday living. Outside, you'll find a s
Key facts
- Half acre
- Spacious backyard
- Near the lie
Tags
Property features AI
Exterior
- Parking: Driveway; Garage (1 car)
- Utilities: Cesspool sewer; Cable available; Electricity connected; Phone available; Public trash collection; Water connected
- Home design: Single family residence; Living area reported from public records; Property condition: Actual
- Construction: Frame construction
- Exterior features: Frame construction; Not waterfront
Interior
- Kitchen: Electric oven; Refrigerator
- Bedrooms: Total rooms: 8
- Flooring: Hardwood floors
- Bathrooms: 2 full bathrooms; 1 half bathroom
- Heating & cooling: Oil heating; Wall/window air conditioning units
- Interior features: Double vanity; Eat-in kitchen; Formal dining room; In-law floorplan; Washer/dryer hookup
- Laundry & utility: Washer/dryer hookup
Neighborhood map
What this means for you Summary
Snapshot
- This is a 3-bed/2.5-bath other listed at $625k.
Deal economics
- At list price, monthly cash flow is $-773 ($-9k/yr) — negative.
- To cash-flow at today's rent, offer at most $488k (21.8% below list).
- To meet the 1% rule (rent ≥ 1% of price), the offer needs to be $482k (22.9% below list).
- Recommended offer: $482k (22.9% below list) — sets the bar for 1% rule.
- Cap rate 4.8% vs local median 3.5% in Holtsville — top-decile yield for the area; either an underpriced asset or a hidden risk that comps aren't pricing in. Stress-test before assuming the spread holds.
Location & tenants
- Location reads 71/100 on livability (#414 in NY) — a middle-class / working-renter tenant base. Strengths: employment A+, housing A+, health & safety B; Watch: amenities F, commute F, cost of living F.
- Sachem Central School District (suburban): math 69% / reading 76% proficiency, ranked #86 of 590 in NY (top 15%) — strong family-tenant draw, lease renewals of 3-5y typical; only 15% free/reduced lunch — higher-income household profile.
- Zoned schools: Waverly Avenue School (math 62% / reading 62%, grade B, #675 of 2,108 statewide, top 35%, 463 students, 26% FRL); Sagamore Middle School (math 44% / reading 57%, grade C, #259 of 729 statewide, top 36%, 933 students, 30% FRL); Sachem High School East (math 94% / reading 93%, grade A+, #131 of 1,100 statewide, top 13%, 2,082 students, 28% FRL).
- Market conditions: 64 active listings in the ZIP; 4 comparable units currently listed for rent nearby; rentals leasing fast (median 5d on market — plan ~1-2 weeks tenant-placement turnaround); 1,366 units permitted in Suffolk County in 2024 (216 in 5+ unit buildings).
Forward outlook
- Local home prices are declining (-3.0%/yr); year-one equity from $4k of loan paydown is wiped out by about $19k of value loss. Plan a longer hold.
- Suffolk County population projected to shrink 5% by 2050 — rents likely to lag national; underwrite the cash flow, not the appreciation.
Negotiation context
- Only 6 days on market — expect competitive offers; lowballing is unlikely to land.
- 2 sale attempts with the ask held roughly flat each time — persistent listings suggest the price (not the market) is what's stuck; bring a comps-based counter.
- Current owner paid $150k; list at $625k implies a 317% gain — meaningful room to come down on a strong offer.
Risks & watch-outs
- Climate carrying-cost: major wind risk, 77% chance of damaging wind over 30y — expect insurance premiums to compound above CPI over the hold.
Questions for the listing agent
- What do current leases actually rent for vs. the listed asking? Can we see a recent rent roll and the last 12 months of T-12 income?
- Built in 1973 — when were the roof, HVAC, electrical panel, plumbing, and water heater last replaced?
- Is there a deadline driving the sale (1031 exchange, divorce, estate, relocation)? That informs how much negotiation room exists.
- The area grade is low — what's the realistic commute time and amenity access for the typical tenant pool here? Any planned neighborhood developments (good or bad) we should know about?
- What's the average days-on-market for RENTAL listings here right now (not sales)? A rising rental-DOM trend means longer vacancies and softer asking-rent achievability than the comps imply.
- What's the recent tenant-quality profile in this submarket — average credit score on applications, eviction rate, late-payment / NSF rate, and stable-employment percentage? A property-management company in the area should have these aggregated.
- How much new for-sale + rental construction is in the pipeline within 1–3 miles? Heavy new supply typically softens prices + rents 12–24 months out; constrained supply supports both.
Investment metrics
- 1% rule
- 0.77% ✗
- Cap rate
- 4.81%
- Cash-on-cash
- -5.30%
- DSCR
- 0.76
- GRM
- 10.8
CMA / ARV
- ARV (median comp)
- $731,489
- List price
- $625,000
- Delta
- -5.67%
- Verdict
- FAIR
- Comps
- 20 within 1.0 mi
Projected returns pro-forma
-3.0% appreciation · 3.0% rent growth · sell at horizon
- IRR
- -25.3%
- Equity multiple
- 0.14×
- Total profit
- $-150,263
- Equity at exit
- $93,190
- IRR
- -21.3%
- Equity multiple
- -0.10×
- Total profit
- $-193,279
- Equity at exit
- $54,039
Cash invested: $175,000 (down + closing). Projections, not guarantees.
Landlord ↔ Tenant lean methodology
- Overall (STATE)
- 15 Strongly Tenant-Friendly
- State New York
- 15 Strongly Tenant-Friendly · D+10
- County
- — inherits STATE
- City
- — inherits STATE
ZIP-level market 11742
- Home prices YoY
- -27.9%
- Active inventory
- 64
- Price-to-rent
- 10.8×
Monthly cashflow live
- Estimated rent
- $4,818 medium interval (Pro) →
- Mortgage (P&I)
- −$3,278
- Tax from tax record
- −$1,041 /mo · $12,496/yr
- Insurance
- −$260
- HOA
- −$0
- Vacancy / Maint / Mgmt
- −$1,012
- Net cashflow
- $-773
Break-even live
UW: 25.0% down · 7.5% · 30yr · 1.5% tax · 5.0% vac · 8.0% maint · 8.0% mgmt
Financing live
Cash to close
- Down payment
- $156,250
- Closing costs
- $18,750
- Reserves months
- —
- Total cash needed
- —
Loan-product check · same deal, 3 products live
Conventional
25% down · 7.5% · 30yr
- Down + closing
- —
- Monthly P&I
- —
- Monthly cashflow
- —
- DSCR
- —
- Eligible?
- —
Personal DTI + credit; lowest rate.
DSCR
20% down · 8.5% · 30yr
- Down + closing
- —
- Monthly P&I
- —
- Monthly cashflow
- —
- DSCR
- —
- Eligible?
- —
No personal income docs; deal must DSCR.
Hard money
10% down · 12.0% · 12mo
- Down + closing
- —
- Monthly P&I
- —
- Monthly cashflow
- —
- DSCR
- —
- Eligible?
- —
Short-term bridge; refi at stabilization.
Rent comps 4 comps
| Address | Beds | Baths | Sqft | Rent | $/sqft | DOM | Units | Dist |
|---|---|---|---|---|---|---|---|---|
| 20 Maple Ln Farmingville, NY | 2.0–3.0 | 2.0–2.5 | 1869 | $5,984 | $3.20 | 1d | 13 | 0.56mi |
| 73 Cherry Ave Holtsville, NY | 3.0 | 2.0 | 1452 | $3,400 | $2.34 | 1d | 1 | 0.93mi |
| 39 Elder Ave Unit 1st level Farmingville, NY | 3.0 | 1.5 | 2492 | $4,300 | $1.73 | 4d | 1 | 1.27mi |
| 132 Fairfield Dr Holbrook, NY | 3.0 | 2.5 | 2200 | $4,200 | $1.91 | 24d | 1 | 1.29mi |
Listing history 10 events
-
2026-06-18days on market $625,000 Active 6 DOM
-
2026-06-17days on market $625,000 Active 5 DOM
-
2026-06-16days on market $625,000 Active 4 DOM
-
2026-06-15days on market $625,000 Active 3 DOM
-
2026-06-13remarks 699-char remark
-
2026-06-13pricedays on market $625,000 Active 1 DOM
-
2026-06-01days on market $690,000 Active 26 DOM
-
2026-05-31days on market $690,000 Active 25 DOM
-
2026-05-06$690,000 Active 431-char remark
-
1988-05-23soldstatus $150,000
ⓘ Source: listings_history table (triggers on properties + properties_extension) + one-shot
backfill from property_details.listing_events for pre-trigger history.
Tax reassessment forecast NY · Partial reset (capped growth)
- Current annual tax
- $12,496 · $1,041/mo
- Projected year-2 tax
- $12,496 · $1,041/mo
- Expected delta
- $0/yr ($0/mo · 0.0%)
ⓘ Screening estimate from a state-policy table — verify with the county assessor before closing.
Climate risk First Street
- Flood 1/10 Low FEMA zone X (unshaded) · 0% chance over 30 yrs
- Wildfire 1/10 Low
- Heat 4/10 Moderate 7 d/yr ≥94°F today · 17 d/yr by 30 yrs out
- Wind 6/10 Major 77% chance of damaging wind over 30 yrs
- Air quality 3/10 Moderate 3 unhealthy d/yr today · 4 by 30 yrs out
Nearby sold comps map
Loading sold comps map…
Walkable amenities ~0.75 mi
Loading nearby amenities…
Taxation est. · year 1
- Rental income
- $57,821
- − Mortgage interest
- −$35,010
- − Property taxes
- −$12,496
- − Insurance
- −$3,125
- − Repairs & maintenance
- −$4,626
- − Management
- −$4,626
- − Depreciation
- −$18,182
- Taxable loss
- −$20,243
- Est. tax savings @ 24.0%
- +$4,858
- After-tax cash flow
- $-4,415/yr
For passive investors: Depreciation is non-cash, so a rental often shows a tax loss while cash-flowing — sheltering income. Rental losses are passive: they offset passive income freely, and up to $25,000/yr can offset ordinary (W-2) income if you actively participate and your MAGI is under $100k (phasing out to $0 by $150k); unused losses carry forward. On sale, claimed depreciation is recaptured at up to 25%, and gains may owe capital-gains tax (a 1031 exchange can defer both). Figures are a year-1 estimate at your 24.0% rate — not tax advice; consult a CPA.
Schools (NCES district)
- District
- Sachem Central School District
- NCES district ID
- 3625350
- Math proficiency
- 69% ▬ 0.00%
- Reading proficiency
- 76% ▲ 12.00%
- Median HH income
- $92,968
- Composite
- 65.53/100
- National rank
- #472
- State rank
- #86 of 590 in NY
Livability — Holtsville
- Score
- 71/100
- State rank
- #414
- US rank
- #7194
Category grades
Schools grade is shown separately in the Schools card above.
Census & demographics
- Census place
- Holtsville, NY
- City population
- 13,194
- Population (ZIP)
- 13,194
Population outlook (Suffolk County) Hauer SSP2
- Today (2025)
- 1,505,262 people
- By 2030
- 1,498,318 · -0.5%
- By 2040
- 1,471,101 · -2.3%
- By 2050
- 1,424,848 · -5.3%
- By 2075
- 1,337,157 · -11.2%
- By 2100
- 1,217,720 · -19.1%
Race, ethnicity, and origin ACS 2023
- Neighborhood character
- Predominantly White (73%)
- Race & ethnicity
- White 73% Hispanic / Latino 16% Black 6% Two or more races 5% Asian 4% Native American 1%
- Hispanic origin (detail)
- Puerto Rican 8% Cuban 2%
- Common ancestry
- Romanian 6% Lithuanian 2% Slovak 2%
- Foreign-born
- 12% · Canada, China, Jamaica
- Languages at home
- 83% English-only · Spanish 7% Other Indo-European 5% Russian/Polish/Slavic 1%
Political lean MEDSL · Suffolk
- 2024 margin
- Lean R (+10.0) · D 45.0% · R 55.0%
- 2008→2024 swing
- -16.0pp toward R · 2008: 6.0pp · 2024: -10.0pp
- All cycles
- 2024: R+10.0 2020: R+0.0 2016: R+8.2 2012: D+2.9 2008: D+6.0
Not yet ingested
- Civics
- —
Market trends
- HPI YoY
- ▼ -128.81%
- Current HPI
- 331.9816
- Rent YoY
- —
- Metro
- —
- State GDP YoY
- ▲ 2.60%
- F500 in state
- 92
Industry mix (Fortune 500 HQ in NY)
| Industry | F500 HQs | Revenue |
|---|---|---|
| Financial Services | 10 | $950B |
|
||
| Consumer Goods | 9 | $162B |
|
||
| Insurance | 4 | $225B |
|
||
| Telecommunications | 2 | $144B |
|
||
| Pharmaceuticals | 2 | $112B |
|
||
| Media / Entertainment | 2 | $69B |
|
||
Price history
+316.7% since first listed4 events — show timeline
- 2026-06-03 Listed $625,000 OneKey® MLS as Distributed by MLS Grid
- 2026-06-01 Listing Removed — OneKey® MLS as Distributed by MLS Grid
- 2026-05-06 Listed $690,000 OneKey® MLS as Distributed by MLS Grid
- 1988-05-23 Sold (Public Records) $150,000 Public Records
Property tax history
+2.3%/yrLatest (2025): $12,496 · +0.0% YoY. Source: county tax records.
Cash-flow waterfall
monthlySold comps — $/sqft
last 12 mo · ≤1 miLoading sold comps…