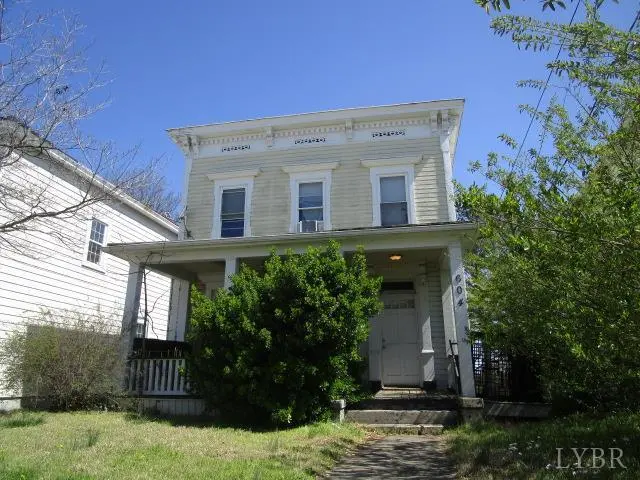
604 Worsham St · Danville, VA
Flood risk 1/10 · Minimal
- FEMA flood zone
- X (unshaded)
- Chance of flooding over 30 yrs
- 0.0%
- Est. flood insurance / yr
- $507 – $1,088
Fire risk 1/10 · Minimal
- Est. fire insurance / yr
- $666 – $1,236
Heat risk 6/10 · Moderate
- Hot days now (above 105°F)
- 7 days/yr
- Hot days in 30 yrs
- 18 days/yr
Wind risk 4/10 · Minor
- Chance of severe wind over 30 yrs
- 8.0%
Air-quality risk 2/10 · Minimal
- Unhealthy air days now
- 0 days/yr
- Unhealthy air days in 30 yrs
- 1 days/yr
Risk factors via First Street. Map © Google.
Why this score? — see what drove the B- grade
The composite is a weighted blend of 9 inputs, each scored 0–100. Each bar is that input's sub-score; the figure is the points it added to the 100-point composite (weight × sub-score).
- Cash flow +28.4/30.0
- DSCR +10.0/10.0
- 1% rule +7.8/10.0
- ARV discount +7.5/15.0
- Livability +3.9/5.0
- Schools +3.0/10.0
- Rent growth +2.5/5.0
- Condition / age +2.5/5.0
- Appreciation +0.0/10.0
$110,000
🖨 Deal sheet (PDF) 📄 Offer letter ✓ Due diligence
Listing remarks MLS
Two story home with wood work designs. Property has tenant and is occupied. Income generating. Conveniently located near North Main Street, shopping and the Dan River and YMCA. Easy access to Casino and parks. Covered porch and level lot. Tenant rights. Appointment Required. Unknown year built. All information to be verified by purchaser.
Key facts
- Covered porch
- Level lot
- Income generating
Tags
Neighborhood map
What this means for you Summary
Snapshot
- This is a 3-bed/1.0-bath single-family listed at $110k.
Deal economics
- At list price, monthly cash flow is $355 ($4k/yr) — positive.
- The deal already cash-flows at list — no discount required.
- Meets the 1% rule at list price ($1k rent vs $110k).
- Recommended offer: $97k (12.0% below list) — sets the bar for market timing.
- Cap rate 10.2% vs local median 5.2% in Danville — top-decile yield for the area; either an underpriced asset or a hidden risk that comps aren't pricing in. Stress-test before assuming the spread holds.
Location & tenants
- Location reads 77/100 on livability (#91 in VA, #2,952 nationally) — a middle-class / working-renter tenant base. Strengths: cost of living A+, housing A+, health & safety A+; Watch: amenities D+, crime D-, commute F.
- Danville City Public School District (town): math 30% / reading 44% proficiency, ranked #128 of 131 in VA (top 98%) — families likely to look elsewhere, expect single-tenant / working-renter base with shorter leases; 71% free/reduced lunch — lower-income household profile, screen leases tightly.
- Zoned schools: Woodberry Hills Elementary (math 5% / reading 34%, grade F, #1,082 of 1,108 statewide, top 98%, 394 students, 98% FRL); Westwood Middle (math 22% / reading 40%, grade F, #333 of 342 statewide, top 97%, 609 students, 90% FRL); George Washington High (math 44% / reading 54%, grade D, #300 of 319 statewide, top 94%, 1,309 students, 88% FRL) — zoned schools average 92% FRL vs 71% district-wide (21 pts higher); higher-poverty schools than district average — tighter screening recommended.
- Market conditions: 212 active listings in the ZIP; 6 comparable units currently listed for rent nearby; rentals lingering (median 46d on market — plan ~5-8 weeks vacancy on turnover, expect pricing pressure); 83% of comp listings sitting > 30 days — soft ceiling on asking rent; 54 units permitted in Danville city in 2024 (40 in 5+ unit buildings).
- This rent runs 35% of the median local income ($48k/yr) — at the standard rent-burdened threshold; future hikes will face affordability resistance.
Forward outlook
- Local home prices are declining (-3.0%/yr); year-one equity from $761 of loan paydown is wiped out by about $3k of value loss. Plan a longer hold.
- Danville County population projected to shrink 7% by 2050 — rents likely to lag national; underwrite the cash flow, not the appreciation.
- At projected returns (-3.0% appreciation + 3.0% rent growth), your $31k cash investment doubles in ~9 years — after that, you're playing with house money.
Negotiation context
- It's been on market 282 days — a 12% lower offer ($97k) is reasonable based on typical stale-listing flexibility.
- 2 sale attempts with the ask held roughly flat each time — persistent listings suggest the price (not the market) is what's stuck; bring a comps-based counter.
Risks & watch-outs
- Watch-outs: built in 1918 — expect roof / HVAC / electrical / plumbing capex.
- Climate carrying-cost: extreme-heat days projected 7→18/yr by 2055 (HVAC capex compounding) — expect insurance premiums to compound above CPI over the hold.
Questions for the listing agent
- It's been on market 282 days. Have you received any prior offers? Is the seller open to a 12% concession, seller financing, or rate buy-down credit?
- Built in 1918 — when were the roof, HVAC, electrical panel, plumbing, and water heater last replaced?
- Why hasn't it sold? Are there any deal-killer items the seller is aware of (foundation, flood, title, zoning, code violations)?
- Is there a deadline driving the sale (1031 exchange, divorce, estate, relocation)? That informs how much negotiation room exists.
- Schools are B-rated — typically a magnet for longer-tenancy family renters. What's the average tenant stay here, and is there a school-zone premium baked into asking?
- Crime grade is D in this area — have there been break-ins, vandalism, or insurance claims at this property in the last 3 years? What carrier currently insures it and at what premium?
- What's the average days-on-market for RENTAL listings here right now (not sales)? A rising rental-DOM trend means longer vacancies and softer asking-rent achievability than the comps imply.
- What's the recent tenant-quality profile in this submarket — average credit score on applications, eviction rate, late-payment / NSF rate, and stable-employment percentage? A property-management company in the area should have these aggregated.
- How much new for-sale + rental construction is in the pipeline within 1–3 miles? Heavy new supply typically softens prices + rents 12–24 months out; constrained supply supports both.
Investment metrics
- 1% rule
- 1.28% ✓
- Cap rate
- 10.16%
- Cash-on-cash
- 13.82%
- DSCR
- 1.62
- GRM
- 6.5
CMA / ARV
- ARV (median comp)
- $55,337
- List price
- $110,000
- Delta
- 98.78%
- Verdict
- OVERPRICED
- Comps
- 20 within 1.0 mi
Show comp detail 12 sales within ~0.75 mi
| Address | Dist | Beds/Ba | Sqft | Sold | Price | $/sf | Match |
|---|---|---|---|---|---|---|---|
| 133 W Thomas St #0 | 0.24mi | 3/1.0 | 1,771 (-1%) | 0mo | $50,000 | $28 | 87 |
| 119 Moffett St | 0.43mi | 3/1.0 | 1,806 (+1%) | 2mo | $140,000 | $78 | 76 |
| 815 Wyllie Ave | 0.20mi | 3/1.5 | 1,632 (-9%) | 6mo | $12,100 | $7 | 69 |
| 806 N Main St | 0.21mi | 3/2.0 | 1,907 (+7%) | 13mo | $62,500 | $33 | 64 |
| 794 Washington St | 0.37mi | 3/2.0 | 1,722 (-4%) | 11mo | $59,900 | $35 | 64 |
| 1108 Wyllie Ave #1 | 0.44mi | 4/2.0 (+1) | 1,943 (+9%) | 5mo | $39,900 | $21 | 51 |
| 210 Baugh St | 0.27mi | 2/1.0 (-1) | 1,530 (-14%) | 9mo | $25,000 | $16 | 51 |
| 169 Forestlawn Dr | 0.62mi | 4/1.0 (+1) | 1,693 (-5%) | 11mo | $95,000 | $56 | 49 |
| 226 W James St | 0.49mi | 4/2.0 (+1) | 1,872 (+5%) | 19mo | $129,900 | $69 | 44 |
| 1103 Washington St | 0.55mi | 4/1.0 (+1) | 1,556 (-13%) | 11mo | $74,000 | $48 | 38 |
| 197 Sunset Dr | 0.64mi | 2/1.0 (-1) | 1,634 (-8%) | 20mo | $135,000 | $83 | 34 |
| 318 Farrar St | 0.57mi | 4/3.0 (+1) | 2,040 (+14%) | 8mo | $156,000 | $76 | 29 |
Match score weights: distance 35% · size 25% · config 20% · recency 20%. Top-matched comps best support the ARV.
Projected returns pro-forma
-3.0% appreciation · 3.0% rent growth · sell at horizon
- IRR
- 4.0%
- Equity multiple
- 1.16×
- Total profit
- $4,792
- Equity at exit
- $16,401
- IRR
- 13.5%
- Equity multiple
- 2.08×
- Total profit
- $33,355
- Equity at exit
- $9,511
Cash invested: $30,800 (down + closing). Projections, not guarantees.
Landlord ↔ Tenant lean methodology
- Overall (STATE)
- 55 Moderately Landlord-Leaning
- State Virginia
- 55 Moderately Landlord-Leaning · D+2
- County
- — inherits STATE
- City
- — inherits STATE
ZIP-level market 24540
- Home prices YoY
- -20.0%
- Active inventory
- 212
- Price-to-rent
- 6.5×
Monthly cashflow live
- Estimated rent
- $1,411 high interval (Pro) →
- Mortgage (P&I)
- −$577
- Tax est. 1.5%
- −$138 /mo · $1,650/yr
- Insurance
- −$46
- HOA
- −$0
- Lot rent
- −$0
- Vacancy / Maint / Mgmt
- −$296
- Net cashflow
- $355
Break-even live
Sensitivity live
| Price | -10% $431 | -5% $393 | +0% $355 | +5% $317 | +10% $279 |
|---|---|---|---|---|---|
| Rent | -10% $243 | -5% $299 | +0% $355 | +5% $411 | +10% $466 |
| Rate | -1.0pp $410 | -0.5pp $383 | base $355 | +0.5pp $326 | +1.0pp $297 |
UW: 25.0% down · 7.5% · 30yr · 1.5% tax · 5.0% vac · 8.0% maint · 8.0% mgmt
Financing live
Cash to close
- Down payment
- $27,500
- Closing costs
- $3,300
- Reserves months
- —
- Total cash needed
- —
Loan-product check · same deal, 3 products live
Conventional
25% down · 7.5% · 30yr
- Down + closing
- —
- Monthly P&I
- —
- Monthly cashflow
- —
- DSCR
- —
- Eligible?
- —
Personal DTI + credit; lowest rate.
DSCR
20% down · 8.5% · 30yr
- Down + closing
- —
- Monthly P&I
- —
- Monthly cashflow
- —
- DSCR
- —
- Eligible?
- —
No personal income docs; deal must DSCR.
Hard money
10% down · 12.0% · 12mo
- Down + closing
- —
- Monthly P&I
- —
- Monthly cashflow
- —
- DSCR
- —
- Eligible?
- —
Short-term bridge; refi at stabilization.
Rent comps 6 comps
| Address | Beds | Baths | Sqft | Rent | $/sqft | DOM | Units | Dist |
|---|---|---|---|---|---|---|---|---|
| 124 Moffett St Danville, VA | 4.0 | 1.5 | 1564 | $1,150 | $0.74 | 46d | 1 | 0.37mi |
| 601 Bridge St Unit 116 Danville, VA | 2.0 | 1.0 | 1294 | $1,575 | $1.22 | 46d | 1 | 0.54mi |
| 601 Bridge St Unit 15 Danville, VA | 2.0 | 1.0 | 1294 | $1,400 | $1.08 | 46d | 1 | 0.54mi |
| 601 Bridge St Unit 117 Danville, VA | 2.0 | 2.0 | 1294 | $1,650 | $1.28 | 23d | 1 | 0.54mi |
| 717 Temple Ave Danville, VA | 3.0 | 1.5 | 1327 | $1,179 | $0.89 | 46d | 1 | 1.08mi |
| 134 Hartford St Danville, VA | 4.0 | 1.0 | 1325 | $1,350 | $1.02 | 46d | 1 | 1.40mi |
Listing history 20 events
-
2026-06-22days on market $110,000 Active 282 DOM
-
2026-06-21days on market $110,000 Active 281 DOM
-
2026-06-19days on market $110,000 Active 279 DOM
-
2026-06-18days on market $110,000 Active 278 DOM
-
2026-06-17days on market $110,000 Active 277 DOM
-
2026-06-16days on market $110,000 Active 276 DOM
-
2026-06-15days on market $110,000 Active 275 DOM
-
2026-06-14days on market $110,000 Active 273 DOM
-
2026-06-13days on market $110,000 Active 272 DOM
-
2026-06-10days on market $110,000 Active 270 DOM
-
2026-06-09days on market $110,000 Active 269 DOM
-
2026-06-08days on market $110,000 Active 268 DOM
-
2026-06-07days on market $110,000 Active 267 DOM
-
2026-06-05days on market $110,000 Active 264 DOM
-
2026-06-02days on market $110,000 Active 262 DOM
-
2026-06-01days on market $110,000 Active 261 DOM
-
2026-05-31days on market $110,000 Active 260 DOM
-
2026-05-30days on market $110,000 Active 259 DOM
-
2026-03-14status Active 340-char remark
Show marketing remark (340 chars)
Two story home with wood work designs. Property has tenant and is occupied. Income generating. Conveniently located near North Main Street, shopping and the Dan River and YMCA. Easy access to Casino and parks. Covered porch and level lot. Tenant rights. Appointment Required. Unknown year built. All information to be verified by purchaser.
-
2025-09-11$110,000 Active 340-char remark
Show marketing remark (340 chars)
Two story home with wood work designs. Property has tenant and is occupied. Income generating. Conveniently located near North Main Street, shopping and the Dan River and YMCA. Easy access to Casino and parks. Covered porch and level lot. Tenant rights. Appointment Required. Unknown year built. All information to be verified by purchaser.
ⓘ Source: listings_history table (triggers on properties + properties_extension) + one-shot
backfill from property_details.listing_events for pre-trigger history.
Climate risk First Street
- Flood 1/10 Low FEMA zone X (unshaded) · 0% chance over 30 yrs
- Wildfire 1/10 Low
- Heat 6/10 Major 7 d/yr ≥105°F today · 18 d/yr by 30 yrs out
- Wind 4/10 Moderate 8% chance of damaging wind over 30 yrs
- Air quality 2/10 Low 0 unhealthy d/yr today · 1 by 30 yrs out
Nearby sold comps map
Loading sold comps map…
Walkable amenities ~0.75 mi
Loading nearby amenities…
Taxation est. · year 1
- Rental income
- $16,936
- − Mortgage interest
- −$6,162
- − Property taxes
- −$1,650
- − Insurance
- −$550
- − Repairs & maintenance
- −$1,355
- − Management
- −$1,355
- − Depreciation
- −$3,200
- Taxable income
- $2,665
- Est. tax owed @ 24.0%
- −$640
- After-tax cash flow
- $3,618/yr
For passive investors: Depreciation is non-cash, so a rental often shows a tax loss while cash-flowing — sheltering income. Rental losses are passive: they offset passive income freely, and up to $25,000/yr can offset ordinary (W-2) income if you actively participate and your MAGI is under $100k (phasing out to $0 by $150k); unused losses carry forward. On sale, claimed depreciation is recaptured at up to 25%, and gains may owe capital-gains tax (a 1031 exchange can defer both). Figures are a year-1 estimate at your 24.0% rate — not tax advice; consult a CPA.
Schools (NCES district)
- District
- Danville City Public School District
- NCES district ID
- 5101110
- Math proficiency
- 30% ▼ -22.00%
- Reading proficiency
- 44% ▼ -8.00%
- Median HH income
- $31,952
- Composite
- 30.23/100
- National rank
- #6298
- State rank
- #128 of 131 in VA
Livability — Danville
- Score
- 77/100
- State rank
- #91
- US rank
- #2952
Category grades
Schools grade is shown separately in the Schools card above.
Census & demographics
- Census place
- Danville, VA
- County
- Danville City · 59,055 people
- City population
- 59,055
- Metro
- Danville, VA
- Population (ZIP)
- 31,013
- Household income
- $47,924
- Rent vs Own
- Severe rent burden
- 1170.0
Population outlook (Danville County) Hauer SSP2
- Today (2025)
- 40,989 people
- By 2030
- 40,432 · -1.4%
- By 2040
- 39,255 · -4.2%
- By 2050
- 38,035 · -7.2%
- By 2075
- 35,612 · -13.1%
- By 2100
- 30,365 · -25.9%
Race, ethnicity, and origin ACS 2023
- Neighborhood character
- Diverse neighborhood (Simpson 0.57)
- Race & ethnicity
- White 50% Black 42% Two or more races 5% Hispanic / Latino 4%
- Common ancestry
- Slovak 1% Lithuanian 1% Serbian 1%
- Foreign-born
- 2% · Canada
- Languages at home
- 97% English-only · Spanish 2%
Political lean MEDSL · Danville
- 2024 margin
- Strong D (+21.1) · D 60.1% · R 39.0%
- 2008→2024 swing
- +1.9pp toward D · 2008: 19.1pp · 2024: 21.1pp
- All cycles
- 2024: D+21.1 2020: D+22.1 2016: D+19.9 2012: D+22.1 2008: D+19.1
Not yet ingested
- Civics
- —
Market trends
- HPI YoY
- ▼ -58.79%
- Current HPI
- 235.1746
- Rent YoY
- —
- Metro
- Danville, VA
- State GDP YoY
- ▲ 2.40%
- F500 in state
- 50
Industry mix (Fortune 500 HQ in VA)
| Industry | F500 HQs | Revenue |
|---|---|---|
| Aerospace / Defense | 4 | $236B |
|
||
| Technology / Defense | 3 | $32B |
|
||
| Financial Services | 2 | $176B |
|
||
| Utilities | 2 | $27B |
|
||
| Insurance | 2 | $25B |
|
||
| Technology | 2 | $15B |
|
||
Price history
2 events — show timeline
- 2026-03-14 Relisted — LMLS
- 2025-09-11 Listed $110,000 LMLS
Property tax history
+3.2%/yrLatest (2025): $144 · +0.0% YoY. Source: county tax records.
Cash-flow waterfall
monthlySold comps — $/sqft
last 12 mo · ≤1 miLoading sold comps…