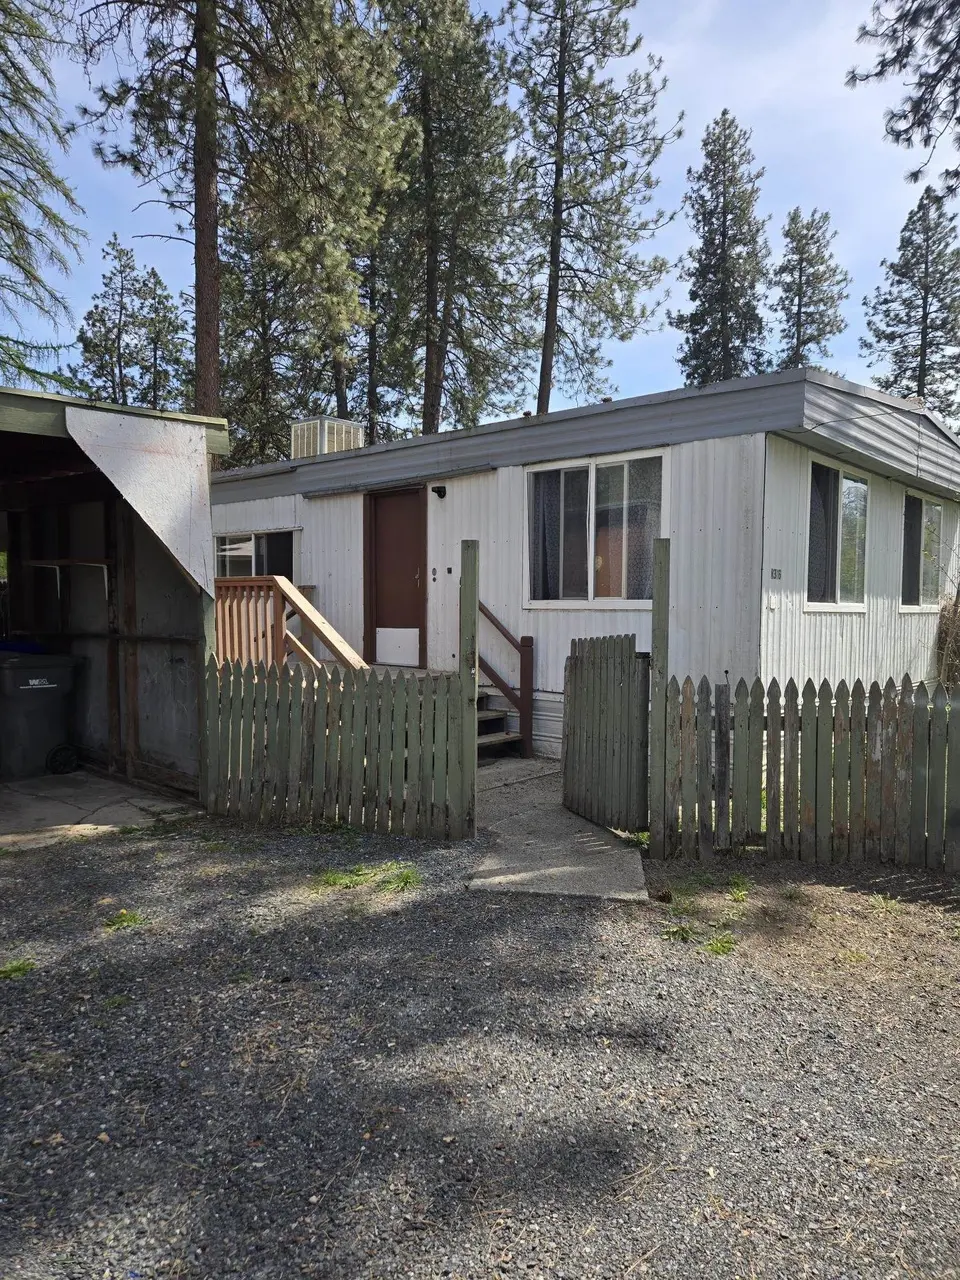
316 N Colville Rd · Deer Park, WA
Flood risk 1/10 · Minimal
- FEMA flood zone
- X (unshaded)
- Chance of flooding over 30 yrs
- 0.0%
- Est. flood insurance / yr
- $507 – $1,088
Fire risk 7/10 · Major
- Est. fire insurance / yr
- $604 – $1,122
Heat risk 2/10 · Minimal
- Hot days now (above 94°F)
- 6 days/yr
- Hot days in 30 yrs
- 11 days/yr
Wind risk 1/10 · Minimal
- Chance of severe wind over 30 yrs
- —
Air-quality risk 9/10 · Severe
- Unhealthy air days now
- 14 days/yr
- Unhealthy air days in 30 yrs
- 17 days/yr
Risk factors via First Street. Map © Google.
Why this score? — see what drove the B- grade
The composite is a weighted blend of 9 inputs, each scored 0–100. Each bar is that input's sub-score; the figure is the points it added to the 100-point composite (weight × sub-score).
- Cash flow +27.0/30.0
- ARV discount +10.3/15.0
- DSCR +9.4/10.0
- 1% rule +6.3/10.0
- Schools +5.2/10.0
- Livability +2.9/5.0
- Rent growth +2.5/5.0
- Condition / age +2.5/5.0
- Appreciation +0.0/10.0
$150,000
🖨 Deal sheet (PDF) 📄 Offer letter ✓ Due diligence
Listing remarks
If you are looking for affordable housing in Deer Park here it is. This is not a trailer in a trailer park. It has its own lot and is not leased. Terms are Cash and Owner Contract. 1970 Boise Cascade Doublewide. 3 bedroom 2 bath with 960 sq ft. Home has Gas Furnace, fridge, Stove, w/ d hookups. Outside has Carport and Storage Shed. Lot is 3/4 fenced. Contract terms are 150k purchase price, 25k down, 8% interest, 1500/month PITI. Agent is related to Seller. I have more of these coming up for sale.
Key facts
- Gas furnace
- Carport
- Storage shed
Tags
Property features AI
Finance
- Other: Lot approx. 0.16 acre (about 120' x 59')
Exterior
- Parking: 2-space carport
- Utilities: Public records list living area and building area as 960 (per public records)
- Home design: Manufactured on land (Boise Cascade); Residential property; Manufactured house
- Construction: Steel frame construction; Skirted foundation with block and vapor barrier; Roof: see remarks
- Exterior features: Fenced yard; Level lot; City bus service within about 6 blocks; City street and paved road frontage
Interior
- Kitchen: Free-standing range; Refrigerator
- Bedrooms: 3 bedrooms
- Heating & cooling: Natural gas heating; Forced air
- Interior features: Pantry; Utility room
Neighborhood map
What this means for you Summary
Snapshot
- This is a 3-bed/1.0-bath manufactured listed at $150k.
Deal economics
- At list price, monthly cash flow is $421 ($5k/yr) — positive.
- The deal already cash-flows at list — no discount required.
- Meets the 1% rule at list price ($2k rent vs $150k).
- Recommended offer: $146k (3.0% below list) — sets the bar for market timing.
- Cap rate 9.7% vs local median 2.4% in Deer Park — top-decile yield for the area; either an underpriced asset or a hidden risk that comps aren't pricing in. Stress-test before assuming the spread holds.
Location & tenants
- Location reads 57/100 on livability (#531 in WA) — a working-class tenant base; expect higher turnover. Strengths: housing A+, cost of living B+; Watch: amenities F, commute F, employment D-.
- Deer Park School District (rural): math 52% / reading 66% proficiency, ranked #74 of 291 in WA (top 25%) — acceptable for families but not a draw, mixed tenant base, ~2y average lease.
- Market conditions: 364 active listings in the ZIP; 3 comparable units currently listed for rent nearby; rentals at typical pace (median 15d on market — plan ~3-4 weeks tenant-placement turnaround); 3,608 units permitted in Spokane County in 2024 (1,792 in 5+ unit buildings).
Forward outlook
- Local home prices are declining (-3.0%/yr); year-one equity from $1k of loan paydown is wiped out by about $4k of value loss. Plan a longer hold.
- Spokane County population projected at +13% by 2050 — modest demand growth; plan on rents tracking national, not racing it.
- At projected returns (-3.0% appreciation + 3.0% rent growth), your $42k cash investment doubles in ~10 years — after that, you're playing with house money.
Negotiation context
- It's been on market 51 days — a 3% lower offer ($146k) is reasonable based on typical stale-listing flexibility.
- 2 sale attempts since 2y ago with the ask held roughly flat each time — persistent listings suggest the price (not the market) is what's stuck; bring a comps-based counter.
- Current owner paid $26k; list at $150k implies a 477% gain — meaningful room to come down on a strong offer.
Risks & watch-outs
- Climate carrying-cost: major wildfire risk — expect insurance premiums to compound above CPI over the hold.
Questions for the listing agent
- It's been on market 51 days. Have you received any prior offers? Is the seller open to a 3% concession, seller financing, or rate buy-down credit?
- Built in 1970 — when were the roof, HVAC, electrical panel, plumbing, and water heater last replaced?
- Is there a deadline driving the sale (1031 exchange, divorce, estate, relocation)? That informs how much negotiation room exists.
- What's the average days-on-market for RENTAL listings here right now (not sales)? A rising rental-DOM trend means longer vacancies and softer asking-rent achievability than the comps imply.
- What's the recent tenant-quality profile in this submarket — average credit score on applications, eviction rate, late-payment / NSF rate, and stable-employment percentage? A property-management company in the area should have these aggregated.
- How much new for-sale + rental construction is in the pipeline within 1–3 miles? Heavy new supply typically softens prices + rents 12–24 months out; constrained supply supports both.
Investment metrics
- 1% rule
- 1.13% ✓
- Cap rate
- 9.66%
- Cash-on-cash
- 12.04%
- DSCR
- 1.54
- GRM
- 7.4
CMA / ARV
- ARV (median comp)
- $160,000
- List price
- $150,000
- Delta
- -6.25%
- Verdict
- FAIR
- Comps
- 5 within 1.0 mi
Show comp detail 6 sales within ~0.75 mi
| Address | Dist | Beds/Ba | Sqft | Sold | Price | $/sf | Match |
|---|---|---|---|---|---|---|---|
| 312 N Colville Rd | 0.01mi | 3/2.0 | 960 (0%) | 2mo | $150,000 | $156 | 94 |
| 312 N Stevens St | 0.11mi | 3/2.0 | 980 (+2%) | 9mo | $324,000 | $331 | 80 |
| 426 E 6th Ave | 0.15mi | 3/1.0 | 980 (+2%) | 23mo | $260,000 | $265 | 71 |
| 518 E 2nd Ave | 0.13mi | 2/1.0 (-1) | 896 (-7%) | 8mo | $130,000 | $145 | 71 |
| 422 E B St | 0.41mi | 3/2.0 | 840 (-12%) | 16mo | $100,000 | $119 | 42 |
| 113 S Stevens St | 0.37mi | 2/1.0 (-1) | 840 (-12%) | 18mo | $175,000 | $208 | 42 |
Match score weights: distance 35% · size 25% · config 20% · recency 20%. Top-matched comps best support the ARV.
Projected returns pro-forma
-3.0% appreciation · 3.0% rent growth · sell at horizon
- IRR
- 1.5%
- Equity multiple
- 1.06×
- Total profit
- $2,477
- Equity at exit
- $22,365
- IRR
- 11.1%
- Equity multiple
- 1.87×
- Total profit
- $36,516
- Equity at exit
- $12,969
Cash invested: $42,000 (down + closing). Projections, not guarantees.
Landlord ↔ Tenant lean methodology
- Overall (STATE)
- 28 Tenant-Leaning
- State Washington
- 28 Tenant-Leaning · D+8
- County
- — inherits STATE
- City
- — inherits STATE
ZIP-level market 99006
- Home prices YoY
- -17.4%
- Active inventory
- 364
- Price-to-rent
- 7.4×
Monthly cashflow live
- Estimated rent
- $1,698 medium interval (Pro) →
- Mortgage (P&I)
- −$787
- Tax from tax record
- −$71 /mo · $851/yr
- Insurance
- −$62
- HOA
- −$0
- Vacancy / Maint / Mgmt
- −$357
- Net cashflow
- $421
Break-even live
Sensitivity live
| Price | -10% $506 | -5% $464 | +0% $421 | +5% $379 | +10% $336 |
|---|---|---|---|---|---|
| Rent | -10% $287 | -5% $354 | +0% $421 | +5% $488 | +10% $555 |
| Rate | -1.0pp $497 | -0.5pp $459 | base $421 | +0.5pp $382 | +1.0pp $343 |
UW: 25.0% down · 7.5% · 30yr · 1.5% tax · 5.0% vac · 8.0% maint · 8.0% mgmt
Financing live
Cash to close
- Down payment
- $37,500
- Closing costs
- $4,500
- Reserves months
- —
- Total cash needed
- —
Loan-product check · same deal, 3 products live
Conventional
25% down · 7.5% · 30yr
- Down + closing
- —
- Monthly P&I
- —
- Monthly cashflow
- —
- DSCR
- —
- Eligible?
- —
Personal DTI + credit; lowest rate.
DSCR
20% down · 8.5% · 30yr
- Down + closing
- —
- Monthly P&I
- —
- Monthly cashflow
- —
- DSCR
- —
- Eligible?
- —
No personal income docs; deal must DSCR.
Hard money
10% down · 12.0% · 12mo
- Down + closing
- —
- Monthly P&I
- —
- Monthly cashflow
- —
- DSCR
- —
- Eligible?
- —
Short-term bridge; refi at stabilization.
Rent comps 3 comps
| Address | Beds | Baths | Sqft | Rent | $/sqft | DOM | Units | Dist |
|---|---|---|---|---|---|---|---|---|
| 420 E C St, Unit 422 Deer Park, WA | 2.0 | 1.0 | 720 | $1,200 | $1.67 | 15d | 1 | 0.45mi |
| 425 S Main St Deer Park, WA | 2.0 | 2.0 | 950 | $1,300 | $1.37 | 15d | 1 | 0.72mi |
| 107 E H St Unit 101-C Deer Park, WA | 3.0 | 2.0 | 1086 | $1,450 | $1.34 | 15d | 1 | 0.75mi |
Listing history 20 events
-
2026-06-21days on market $150,000 Active 51 DOM
-
2026-06-18days on market $150,000 Active 48 DOM
-
2026-06-17days on market $150,000 Active 47 DOM
-
2026-06-16days on market $150,000 Active 46 DOM
-
2026-06-15days on market $150,000 Active 45 DOM
-
2026-06-14days on market $150,000 Active 43 DOM
-
2026-06-13days on market $150,000 Active 42 DOM
-
2026-06-10days on market $150,000 Active 40 DOM
-
2026-06-09days on market $150,000 Active 39 DOM
-
2026-06-08days on market $150,000 Active 38 DOM
-
2026-06-07days on market $150,000 Active 37 DOM
-
2026-06-03days on market $150,000 Active 33 DOM
-
2026-06-02days on market $150,000 Active 32 DOM
-
2026-06-01days on market $150,000 Active 31 DOM
-
2026-05-31days on market $150,000 Active 30 DOM
-
2026-05-31days on market $150,000 Active 29 DOM
-
2026-05-01$150,000 Active 501-char remark
-
2025-01-05historical $1,200
-
2024-12-27$1,200
-
1991-06-25soldstatus $26,000
ⓘ Source: listings_history table (triggers on properties + properties_extension) + one-shot
backfill from property_details.listing_events for pre-trigger history.
Tax reassessment forecast WA · Resets to sale price
- Current annual tax
- $851 · $71/mo
- Projected year-2 tax
- $1,470 · $122/mo
- Expected delta
- +$619/yr (+$52/mo · 72.8%)
ⓘ Screening estimate from a state-policy table — verify with the county assessor before closing.
Climate risk First Street
- Flood 1/10 Low FEMA zone X (unshaded) · 0% chance over 30 yrs
- Wildfire 7/10 Severe
- Heat 2/10 Low 6 d/yr ≥94°F today · 11 d/yr by 30 yrs out
- Wind 1/10 Low
- Air quality 9/10 Extreme 14 unhealthy d/yr today · 17 by 30 yrs out
Nearby sold comps map
Loading sold comps map…
Walkable amenities ~0.75 mi
Loading nearby amenities…
Taxation est. · year 1
- Rental income
- $20,374
- − Mortgage interest
- −$8,402
- − Property taxes
- −$851
- − Insurance
- −$750
- − Repairs & maintenance
- −$1,630
- − Management
- −$1,630
- − Depreciation
- −$4,364
- Taxable income
- $2,747
- Est. tax owed @ 24.0%
- −$659
- After-tax cash flow
- $4,396/yr
For passive investors: Depreciation is non-cash, so a rental often shows a tax loss while cash-flowing — sheltering income. Rental losses are passive: they offset passive income freely, and up to $25,000/yr can offset ordinary (W-2) income if you actively participate and your MAGI is under $100k (phasing out to $0 by $150k); unused losses carry forward. On sale, claimed depreciation is recaptured at up to 25%, and gains may owe capital-gains tax (a 1031 exchange can defer both). Figures are a year-1 estimate at your 24.0% rate — not tax advice; consult a CPA.
Schools (NCES district)
- District
- Deer Park School District
- NCES district ID
- 5302070
- Math proficiency
- 52% ▼ -1.00%
- Reading proficiency
- 66% ▬ 0.00%
- Median HH income
- $47,808
- Composite
- 51.66/100
- National rank
- #3620
- State rank
- #74 of 291 in WA
Livability — Deer Park
- Score
- 57/100
- State rank
- #531
- US rank
- #22045
Category grades
Schools grade is shown separately in the Schools card above.
Census & demographics
- Census place
- Deer Park, WA
- County
- Spokane County · 496,401 people
- City population
- 16,177
- Metro
- Spokane-Spokane Valley, WA
- Population (ZIP)
- 16,177
- Household income
- $72,200
- Rent vs Own
- Severe rent burden
- 144.0
Population outlook (Spokane County) Hauer SSP2
- Today (2025)
- 531,314 people
- By 2030
- 549,278 · +3.4%
- By 2040
- 577,822 · +8.8%
- By 2050
- 598,188 · +12.6%
- By 2075
- 630,744 · +18.7%
- By 2100
- 622,360 · +17.1%
Race, ethnicity, and origin ACS 2023
- Neighborhood character
- Predominantly White (91%)
- Race & ethnicity
- White 91% Two or more races 6% Hispanic / Latino 4%
- Common ancestry
- Portuguese 6% Slovak 3% Serbian 3%
- Foreign-born
- 2% · Canada
- Languages at home
- 96% English-only · Spanish 2% Other Asian/Pacific 1%
Political lean MEDSL · Spokane
- 2024 margin
- Toss-up / Even · D 46.0% · R 51.0% · Other 3.0%
- 2008→2024 swing
- -3.8pp toward R · 2008: -1.1pp · 2024: -5.0pp
- All cycles
- 2024: R+5.0 2020: R+4.3 2016: R+8.3 2012: R+6.3 2008: R+1.1
Not yet ingested
- Civics
- —
Market trends
- HPI YoY
- ▼ -79.74%
- Current HPI
- 378.0416
- Rent YoY
- —
- Metro
- Spokane-Spokane Valley, WA
- State GDP YoY
- ▲ 4.65%
- F500 in state
- 22
Industry mix (Fortune 500 HQ in WA)
| Industry | F500 HQs | Revenue |
|---|---|---|
| Retail | 2 | $269B |
|
||
| Technology / Retail | 1 | $638B |
|
||
| Technology | 1 | $245B |
|
||
| Telecommunications | 1 | $38B |
|
||
| Food / Beverage | 1 | $36B |
|
||
| Automotive / Trucks | 1 | $34B |
|
||
Price history
+476.9% since first listed4 events — show timeline
- 2026-05-01 Listed $150,000 SPOKANEMLS as Distributed by MLS Grid
- 2025-01-05 Rental Removed $1,200 APPFOLIO
- 2024-12-27 Listed for Rent $1,200 APPFOLIO
- 1991-06-25 Sold (Public Records) $26,000 Public Records
Property tax history
+4.2%/yrLatest (2026): $851 · -9.2% YoY. Source: county tax records.
Cash-flow waterfall
monthlySold comps — $/sqft
last 12 mo · ≤1 miLoading sold comps…