631 Millard St · Mason, TX
Flood risk 8/10 · Major
- FEMA flood zone
- —
- Chance of flooding over 30 yrs
- 0.99%
- Est. flood insurance / yr
- —
Fire risk 7/10 · Major
- Est. fire insurance / yr
- $1,222 – $2,270
Heat risk 7/10 · Major
- Hot days now (above 104°F)
- 6 days/yr
- Hot days in 30 yrs
- 20 days/yr
Wind risk 6/10 · Moderate
- Chance of severe wind over 30 yrs
- 27.0%
Air-quality risk 1/10 · Minimal
- Unhealthy air days now
- 0 days/yr
- Unhealthy air days in 30 yrs
- 0 days/yr
Risk factors via First Street. Map © Google.
Why this score? — see what drove the F grade
The composite is a weighted blend of 9 inputs, each scored 0–100. Each bar is that input's sub-score; the figure is the points it added to the 100-point composite (weight × sub-score).
- ARV discount +7.5/15.0
- Appreciation +7.3/10.0
- Cash flow +5.0/30.0
- Schools +5.0/10.0
- Livability +3.2/5.0
- Rent growth +2.5/5.0
- Condition / age +2.5/5.0
- 1% rule +1.0/10.0
- DSCR +0.0/10.0
$99,000
🖨 Deal sheet (PDF) 📄 Offer letter ✓ Due diligence
Listing remarks MLS
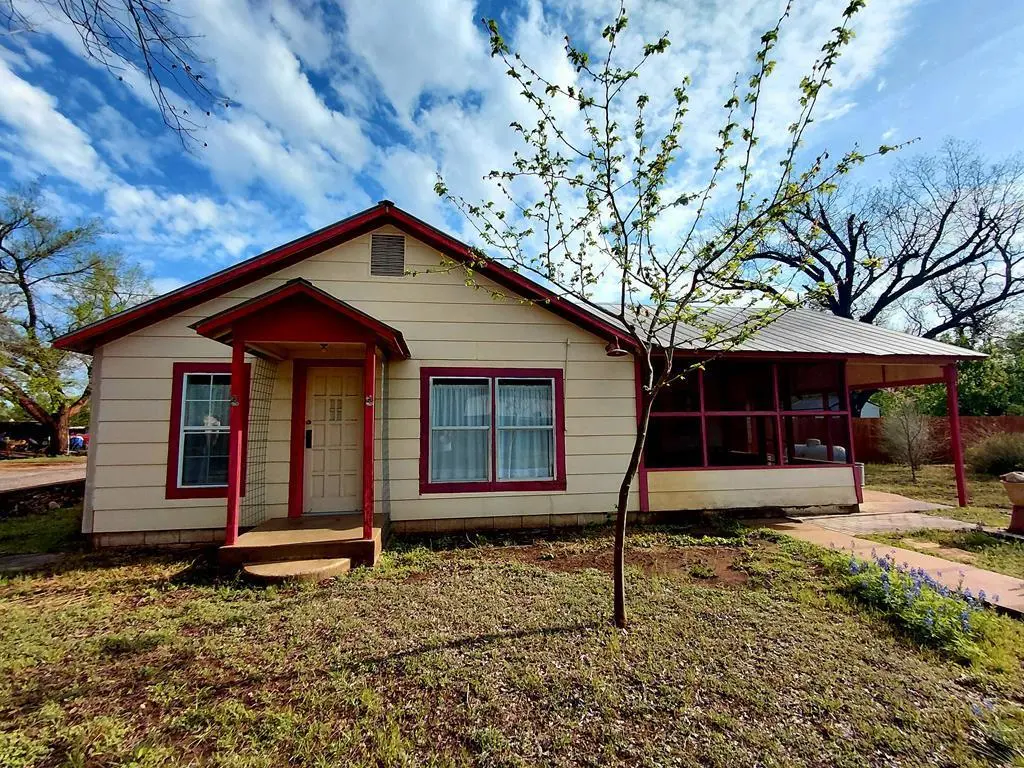
Cottage-bungalow house with 2 bedrooms and 1 bath on lot that backs to wet-weather Koocks Branch Creek. Original wood floors throughout, screened back porch, fenced on 2 sides and the front of property has a unique rock wall. Perfect yard for your Spring garden!
Key facts
- Screened back porch
- Unique rock wall
- Original wood floors
Tags
Neighborhood map
What this means for you Summary
Snapshot
- This is a 2-bed/1.0-bath single-family listed at $99k.
Deal economics
- At list price, monthly cash flow is $-235 ($-3k/yr) — negative.
- To cash-flow at today's rent, offer at most $57k (42.0% below list).
- To meet the 1% rule (rent ≥ 1% of price), the offer needs to be $59k (40.4% below list).
- Recommended offer: $57k (42.0% below list) — sets the bar for cash-flow.
Location & tenants
- Location reads 65/100 on livability (#662 in TX) — a middle-class / working-renter tenant base. Strengths: crime A+, cost of living A+, housing A+; Watch: amenities F, commute F, employment F.
- Mason ISD (rural): math 57% / reading 63% proficiency, ranked #76 of 826 in TX (top 9%) — acceptable for families but not a draw, mixed tenant base, ~2y average lease.
- Zoned schools: Mason El (math 57% / reading 57%, grade C+, #505 of 4,322 statewide, top 13%, 291 students, 50% FRL); Mason J H (math 52% / reading 62%, grade B, #212 of 1,662 statewide, top 13%, 204 students, 48% FRL); Mason H S (math 72% / reading 64%, grade B, #147 of 1,632 statewide, top 9%, 214 students, 42% FRL) — zoned schools at 47% FRL track the district average.
- Market conditions: 99 active listings in the ZIP; 1 comparable units currently listed for rent nearby; 4 units permitted in Mason County in 2024 (0 in 5+ unit buildings).
Forward outlook
- In year one you build about $5k of equity ($684 loan paydown + $5k appreciation (4.6% local appreciation)).
- Mason County population projected to shrink 4% by 2050 — rents likely to lag national; underwrite the cash flow, not the appreciation.
- By year 7, paydown + projected appreciation supports a ~$34k cash-out refi (75% LTV) — recoverable capital for the next deal without selling this one.
Negotiation context
- It's been on market 134 days — a 12% lower offer ($87k) is reasonable based on typical stale-listing flexibility.
Risks & watch-outs
- Watch-outs: built in 1930 — expect roof / HVAC / electrical / plumbing capex.
- Climate carrying-cost: severe flood risk; major wind risk, 27% chance of damaging wind over 30y; major wildfire risk; extreme-heat days projected 6→20/yr by 2055 (HVAC capex compounding) — expect insurance premiums to compound above CPI over the hold.
Questions for the listing agent
- What do current leases actually rent for vs. the listed asking? Can we see a recent rent roll and the last 12 months of T-12 income?
- It's been on market 134 days. Have you received any prior offers? Is the seller open to a 42% concession, seller financing, or rate buy-down credit?
- Built in 1930 — when were the roof, HVAC, electrical panel, plumbing, and water heater last replaced?
- Why hasn't it sold? Are there any deal-killer items the seller is aware of (foundation, flood, title, zoning, code violations)?
- Is there a deadline driving the sale (1031 exchange, divorce, estate, relocation)? That informs how much negotiation room exists.
- The area grade is low — what's the realistic commute time and amenity access for the typical tenant pool here? Any planned neighborhood developments (good or bad) we should know about?
- What's the average days-on-market for RENTAL listings here right now (not sales)? A rising rental-DOM trend means longer vacancies and softer asking-rent achievability than the comps imply.
- What's the recent tenant-quality profile in this submarket — average credit score on applications, eviction rate, late-payment / NSF rate, and stable-employment percentage? A property-management company in the area should have these aggregated.
- How much new for-sale + rental construction is in the pipeline within 1–3 miles? Heavy new supply typically softens prices + rents 12–24 months out; constrained supply supports both.
Investment metrics
- 1% rule
- 0.60% ✗
- Cap rate
- 3.44%
- Cash-on-cash
- -10.18%
- DSCR
- 0.55
- GRM
- 14.0
CMA / ARV
- ARV (median comp)
- $199,302
- List price
- $99,000
- Delta
- -50.33%
- Verdict
- UNDERPRICED
- Comps
- 3 within 1.0 mi
Projected returns pro-forma
4.62% appreciation · 3.0% rent growth · sell at horizon
- IRR
- 3.3%
- Equity multiple
- 1.21×
- Total profit
- $5,737
- Equity at exit
- $53,845
- IRR
- 6.2%
- Equity multiple
- 2.13×
- Total profit
- $31,396
- Equity at exit
- $91,115
Cash invested: $27,720 (down + closing). Projections, not guarantees.
Landlord ↔ Tenant lean methodology
- Overall (STATE)
- 87 Strongly Landlord-Friendly
- State Texas
- 87 Strongly Landlord-Friendly · R+5
- County
- — inherits STATE
- City
- — inherits STATE
ZIP-level market 76856
- Home prices YoY
- 2.3%
- Active inventory
- 99
- Price-to-rent
- 14.0×
Monthly cashflow live
- Estimated rent
- $590 medium interval (Pro) →
- Mortgage (P&I)
- −$519
- Tax from tax record
- −$141 /mo · $1,690/yr
- Insurance
- −$41
- HOA
- −$0
- Vacancy / Maint / Mgmt
- −$124
- Net cashflow
- $-235
Break-even live
Sensitivity live
| Price | -10% $-179 | -5% $-207 | +0% $-235 | +5% $-263 | +10% $-291 |
|---|---|---|---|---|---|
| Rent | -10% $-282 | -5% $-258 | +0% $-235 | +5% $-212 | +10% $-189 |
| Rate | -1.0pp $-185 | -0.5pp $-210 | base $-235 | +0.5pp $-261 | +1.0pp $-287 |
UW: 25.0% down · 7.5% · 30yr · 1.5% tax · 5.0% vac · 8.0% maint · 8.0% mgmt
Financing live
Cash to close
- Down payment
- $24,750
- Closing costs
- $2,970
- Reserves months
- —
- Total cash needed
- —
Loan-product check · same deal, 3 products live
Conventional
25% down · 7.5% · 30yr
- Down + closing
- —
- Monthly P&I
- —
- Monthly cashflow
- —
- DSCR
- —
- Eligible?
- —
Personal DTI + credit; lowest rate.
DSCR
20% down · 8.5% · 30yr
- Down + closing
- —
- Monthly P&I
- —
- Monthly cashflow
- —
- DSCR
- —
- Eligible?
- —
No personal income docs; deal must DSCR.
Hard money
10% down · 12.0% · 12mo
- Down + closing
- —
- Monthly P&I
- —
- Monthly cashflow
- —
- DSCR
- —
- Eligible?
- —
Short-term bridge; refi at stabilization.
Rent comps 1 comps
| Address | Beds | Baths | Sqft | Rent | $/sqft | DOM | Units | Dist |
|---|---|---|---|---|---|---|---|---|
| 511 Merrill ST Mason, TX | 1.0 | 1.0 | 700 | $590 | $0.84 | 45d | 1 | 0.69mi |
Listing history 19 events
-
2026-06-19days on market $99,000 Active 134 DOM
-
2026-06-18remarks 296-char remark
-
2026-06-18days on market $99,000 Active 133 DOM
-
2026-06-17days on market $99,000 Active 132 DOM
-
2026-06-16days on market $99,000 Active 131 DOM
-
2026-06-15days on market $99,000 Active 130 DOM
-
2026-06-14days on market $99,000 Active 128 DOM
-
2026-06-12days on market $99,000 Active 127 DOM
-
2026-06-09days on market $99,000 Active 124 DOM
-
2026-06-08days on market $99,000 Active 123 DOM
-
2026-06-07days on market $99,000 Active 122 DOM
-
2026-06-07days on market $99,000 Active 121 DOM
-
2026-06-03days on market $99,000 Active 118 DOM
-
2026-06-02days on market $99,000 Active 117 DOM
-
2026-06-01days on market $99,000 Active 116 DOM
-
2026-05-31days on market $99,000 Active 115 DOM
-
2026-05-30days on market $99,000 Active 114 DOM
-
2026-04-29price $99,000 262-char remark
Show marketing remark (262 chars)
Cottage-bungalow house with 2 bedrooms and 1 bath on lot that backs to wet-weather Koocks Branch Creek. Original wood floors throughout, screened back porch, fenced on 2 sides and the front of property has a unique rock wall. Perfect yard for your Spring garden!
-
2026-02-05$110,000 Active 262-char remark
Show marketing remark (262 chars)
Cottage-bungalow house with 2 bedrooms and 1 bath on lot that backs to wet-weather Koocks Branch Creek. Original wood floors throughout, screened back porch, fenced on 2 sides and the front of property has a unique rock wall. Perfect yard for your Spring garden!
ⓘ Source: listings_history table (triggers on properties + properties_extension) + one-shot
backfill from property_details.listing_events for pre-trigger history.
Tax reassessment forecast TX · Resets to sale price
- Current annual tax
- $1,690 · $141/mo
- Projected year-2 tax
- $1,812 · $151/mo
- Expected delta
- +$121/yr (+$10/mo · 7.2%)
ⓘ Screening estimate from a state-policy table — verify with the county assessor before closing.
Climate risk First Street
- Flood 8/10 Severe 99% chance over 30 yrs
- Wildfire 7/10 Severe
- Heat 7/10 Severe 6 d/yr ≥104°F today · 20 d/yr by 30 yrs out
- Wind 6/10 Major 27% chance of damaging wind over 30 yrs
- Air quality 1/10 Low 0 unhealthy d/yr today · 0 by 30 yrs out
Nearby sold comps map
Loading sold comps map…
Walkable amenities ~0.75 mi
Loading nearby amenities…
Taxation est. · year 1
- Rental income
- $7,080
- − Mortgage interest
- −$5,546
- − Property taxes
- −$1,690
- − Insurance
- −$495
- − Repairs & maintenance
- −$566
- − Management
- −$566
- − Depreciation
- −$2,880
- Taxable loss
- −$4,664
- Est. tax savings @ 24.0%
- +$1,119
- After-tax cash flow
- $-1,703/yr
For passive investors: Depreciation is non-cash, so a rental often shows a tax loss while cash-flowing — sheltering income. Rental losses are passive: they offset passive income freely, and up to $25,000/yr can offset ordinary (W-2) income if you actively participate and your MAGI is under $100k (phasing out to $0 by $150k); unused losses carry forward. On sale, claimed depreciation is recaptured at up to 25%, and gains may owe capital-gains tax (a 1031 exchange can defer both). Figures are a year-1 estimate at your 24.0% rate — not tax advice; consult a CPA.
Schools (NCES district)
- District
- Mason ISD
- NCES district ID
- 4829280
- Math proficiency
- 57% ▲ 2.00%
- Reading proficiency
- 63% ▲ 1.00%
- Median HH income
- $40,797
- Composite
- 50.18/100
- National rank
- #1898
- State rank
- #76 of 826 in TX
Livability — Mason
- Score
- 65/100
- State rank
- #662
- US rank
- #12456
Category grades
Schools grade is shown separately in the Schools card above.
Census & demographics
- Census place
- Mason, TX
- Population (ZIP)
- 3,525
Population outlook (Mason County) Hauer SSP2
- Today (2025)
- 3,979 people
- By 2030
- 3,930 · -1.2%
- By 2040
- 3,836 · -3.6%
- By 2050
- 3,838 · -3.5%
- By 2075
- 4,230 · +6.3%
- By 2100
- 4,260 · +7.1%
Race, ethnicity, and origin ACS 2023
- Neighborhood character
- Predominantly White (76%)
- Race & ethnicity
- White 76% Hispanic / Latino 23% Two or more races 8%
- Hispanic origin (detail)
- Mexican 23%
- Common ancestry
- Lithuanian 4% Slovak 2% Italian 2%
- Foreign-born
- 4% · Canada
- Languages at home
- 81% English-only · Spanish 18% Other Indo-European 1%
Political lean MEDSL · Mason
- 2024 margin
- Solid R (+65.0) · D 17.2% · R 82.2%
- 2008→2024 swing
- -18.0pp toward R · 2008: -47.1pp · 2024: -65.0pp
- All cycles
- 2024: R+65.0 2020: R+62.0 2016: R+63.5 2012: R+60.1 2008: R+47.1
Not yet ingested
- Civics
- —
Market trends
- HPI YoY
- ▲ 4.62%
- Current HPI
- 206.7593
- Rent YoY
- —
- Metro
- —
- State GDP YoY
- ▲ 3.95%
- F500 in state
- 110
Industry mix (Fortune 500 HQ in TX)
| Industry | F500 HQs | Revenue |
|---|---|---|
| Energy | 16 | $1,198B |
|
||
| Technology | 5 | $198B |
|
||
| Engineering / Construction | 4 | $72B |
|
||
| Energy Services | 3 | $60B |
|
||
| Utilities | 3 | $41B |
|
||
| Healthcare | 2 | $330B |
|
||
Price history
-10.0% since first listed2 events — show timeline
- 2026-04-29 Price Changed $99,000 CHCMLS
- 2026-02-05 Listed $110,000 CHCMLS
Property tax history
+4.2%/yrLatest (2025): $1,690 · -10.8% YoY. Source: county tax records.
Cash-flow waterfall
monthlySold comps — $/sqft
last 12 mo · ≤1 miLoading sold comps…