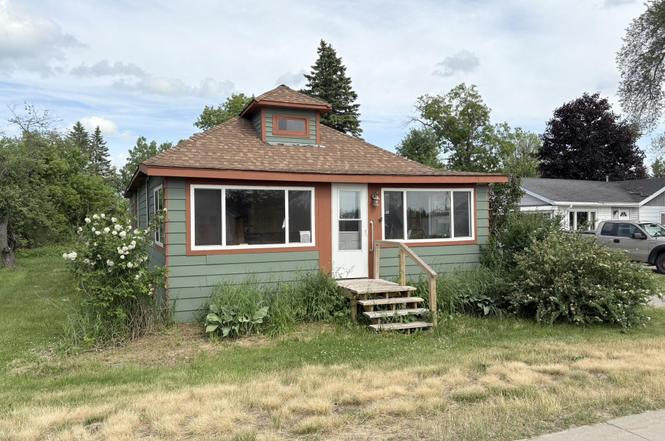
630 N State St · Hillman, MI
Flood risk 1/10 · Minimal
- FEMA flood zone
- X (unshaded)
- Chance of flooding over 30 yrs
- 0.0%
- Est. flood insurance / yr
- $473 – $860
Fire risk 3/10 · Minor
- Est. fire insurance / yr
- $784 – $1,456
Heat risk 1/10 · Minimal
- Hot days now (above 95°F)
- 7 days/yr
- Hot days in 30 yrs
- 13 days/yr
Wind risk 1/10 · Minimal
- Chance of severe wind over 30 yrs
- —
Air-quality risk 1/10 · Minimal
- Unhealthy air days now
- 0 days/yr
- Unhealthy air days in 30 yrs
- 0 days/yr
Risk factors via First Street. Map © Google.
Why this score? — see what drove the B- grade
The composite is a weighted blend of 9 inputs, each scored 0–100. Each bar is that input's sub-score; the figure is the points it added to the 100-point composite (weight × sub-score).
- Cash flow +20.0/30.0
- ARV discount +14.4/15.0
- Appreciation +10.0/10.0
- DSCR +6.3/10.0
- 1% rule +4.3/10.0
- Livability +3.1/5.0
- Schools +2.6/10.0
- Rent growth +2.5/5.0
- Condition / age +2.5/5.0
$120,000
🖨 Deal sheet 📄 Offer letter ✓ Due diligence
Listing remarks
Affordable and move-in ready! This 3-bed, 1-bath ranch is situated on a spacious 132' x 132' lot in the Village of Hillman, offering the convenience of in-town living with plenty of outdoor space. Recent updates include fresh interior paint, attractive new vinyl flooring, and a new roof installed in 2025. A charming front sunporch provides the perfect place to enjoy your morning coffee, relax with a good book, or take in the peaceful neighborhood setting. Functional floor plan offers comfortable living, while the partial basement provides space for utilities and additional storage. Conveniently located within walking distance of shopping, dining, schools, parks and other necessities. Munici
Key facts
- Front sunporch
- Recent updates
- Walking distance
Tags
Property features AI
Exterior
- Utilities: Public water; Public sewer
- Home design: Single-family residence; Residential property
- Construction: Has a partial crawl space basement
- Exterior features: Paved road access; Lot dimensions approximately 132 x 132 (about 0.4 acres)
Interior
- Kitchen: Cooktop; Oven; Refrigerator
- Bathrooms: 1 full bathroom
- Heating & cooling: Forced air heating
- Interior features: Cooktop, Oven, Refrigerator, Washer, Dryer; Has heating (Forced Air)
- Laundry & utility: Laundry located in kitchen; Washer and Dryer included
Neighborhood map
What this means for you Summary
Snapshot
- This is a 3-bed/1.0-bath single-family listed at $120k.
Deal economics
- At list price, monthly cash flow is $148 ($2k/yr) — positive.
- The deal already cash-flows at list — no discount required.
- To meet the 1% rule (rent ≥ 1% of price), the offer needs to be $112k (6.8% below list).
- Recommended offer: $112k (6.8% below list) — sets the bar for 1% rule.
Location & tenants
- Location reads 61/100 on livability (#575 in MI) — a middle-class / working-renter tenant base. Strengths: cost of living A+, housing A-; Watch: crime F, amenities F, commute F.
- Hillman Community Schools (rural): math 22% / reading 40% proficiency, ranked #361 of 540 in MI (top 67%) — families likely to look elsewhere, expect single-tenant / working-renter base with shorter leases.
- Zoned schools: Hillman Elementary School (math 17% / reading 27%, grade F, #1,035 of 1,397 statewide, top 77%, 187 students, 61% FRL).
- Market conditions: 39 active listings in the ZIP.
Forward outlook
- In year one you build about $13k of equity ($830 loan paydown + $12k appreciation (10.0% local appreciation)).
- Montmorency County population projected at -38% by 2050 — secular population decline; favor cash flow + early exit over multi-decade hold.
- At projected returns (10.0% appreciation + 3.0% rent growth), your $34k cash investment doubles in ~3 years — after that, you're playing with house money.
- By year 3, paydown + projected appreciation supports a ~$32k cash-out refi (75% LTV) — recoverable capital for the next deal without selling this one.
Negotiation context
- Only 3 days on market — expect competitive offers; lowballing is unlikely to land.
- Current owner paid $35k; list at $120k implies a 243% gain — meaningful room to come down on a strong offer.
Questions for the listing agent
- Is there a deadline driving the sale (1031 exchange, divorce, estate, relocation)? That informs how much negotiation room exists.
- Schools are F-rated, which usually means shorter tenancies and higher turnover. Who's the typical renter profile here, and what's been the actual vacancy rate?
- Crime grade is F in this area — have there been break-ins, vandalism, or insurance claims at this property in the last 3 years? What carrier currently insures it and at what premium?
- What's the average days-on-market for RENTAL listings here right now (not sales)? A rising rental-DOM trend means longer vacancies and softer asking-rent achievability than the comps imply.
- What's the recent tenant-quality profile in this submarket — average credit score on applications, eviction rate, late-payment / NSF rate, and stable-employment percentage? A property-management company in the area should have these aggregated.
- How much new for-sale + rental construction is in the pipeline within 1–3 miles? Heavy new supply typically softens prices + rents 12–24 months out; constrained supply supports both.
Investment metrics
- 1% rule
- 0.93% ✗
- Cap rate
- 7.77%
- Cash-on-cash
- 5.28%
- DSCR
- 1.23
- GRM
- 8.9
CMA / ARV
- ARV (on-the-fly)
- $141,600
- Comps found
- 5
Show comp detail 5 sales within ~0.75 mi
| Address | Dist | Beds/Ba | Sqft | Sold | Price | $/sf | Match |
|---|---|---|---|---|---|---|---|
| 620 State St | 0.01mi | 3/1.0 | 1,144 (-5%) | 20mo | $115,000 | $101 | 75 |
| 501 W Third St | 0.32mi | 3/1.0 | 1,350 (+12%) | 9mo | $90,000 | $67 | 57 |
| 611 W Third St | 0.39mi | 3/2.0 | 1,300 (+8%) | 22mo | $275,000 | $212 | 46 |
| 151 Elizabeth | 0.51mi | 3/2.0 | 1,368 (+14%) | 8mo | $163,100 | $119 | 42 |
| 811 W Third St | 0.50mi | 3/2.0 | 1,352 (+13%) | 13mo | $160,000 | $118 | 40 |
Match score weights: distance 35% · size 25% · config 20% · recency 20%. Top-matched comps best support the ARV.
Projected returns pro-forma
10.0% appreciation · 3.0% rent growth · sell at horizon
- IRR
- 28.1%
- Equity multiple
- 3.22×
- Total profit
- $74,732
- Equity at exit
- $108,106
- IRR
- 24.5%
- Equity multiple
- 7.33×
- Total profit
- $212,587
- Equity at exit
- $233,134
Cash invested: $33,600 (down + closing). Projections, not guarantees.
Landlord ↔ Tenant lean methodology
- Overall (STATE)
- 62 Landlord-Friendly
- State Michigan
- 62 Landlord-Friendly · EVEN
- County
- — inherits STATE
- City
- — inherits STATE
ZIP-level market 49746
- Home prices YoY
- 5.7%
- Active inventory
- 39
- Price-to-rent
- 8.9×
Monthly cashflow live
- Estimated rent
- $1,119 medium interval (Pro) →
- Mortgage (P&I)
- −$629
- Tax from tax record
- −$57 /mo · $681/yr
- Insurance
- −$50
- HOA
- −$0
- Vacancy / Maint / Mgmt
- −$235
- Net cashflow
- $148
Break-even live
UW: 25.0% down · 7.5% · 30yr · 1.5% tax · 5.0% vac · 8.0% maint · 8.0% mgmt
Financing live
Cash to close
- Down payment
- $30,000
- Closing costs
- $3,600
- Reserves months
- —
- Total cash needed
- —
Loan-product check · same deal, 3 products live
Conventional
25% down · 7.5% · 30yr
- Down + closing
- —
- Monthly P&I
- —
- Monthly cashflow
- —
- DSCR
- —
- Eligible?
- —
Personal DTI + credit; lowest rate.
DSCR
20% down · 8.5% · 30yr
- Down + closing
- —
- Monthly P&I
- —
- Monthly cashflow
- —
- DSCR
- —
- Eligible?
- —
No personal income docs; deal must DSCR.
Hard money
10% down · 12.0% · 12mo
- Down + closing
- —
- Monthly P&I
- —
- Monthly cashflow
- —
- DSCR
- —
- Eligible?
- —
Short-term bridge; refi at stabilization.
Listing history 4 events
-
2026-06-18days on market $120,000 Active 3 DOM
-
2026-06-17days on market $120,000 Active 2 DOM
-
2026-06-16remarks 699-char remark
-
2026-06-16$120,000 Active 1 DOM
ⓘ Source: listings_history table (triggers on properties + properties_extension) + one-shot
backfill from property_details.listing_events for pre-trigger history.
Tax reassessment forecast MI · Partial reset (capped growth)
- Current annual tax
- $681 · $57/mo
- Projected year-2 tax
- $1,265 · $105/mo
- Expected delta
- +$583/yr (+$49/mo · 85.7%)
ⓘ Screening estimate from a state-policy table — verify with the county assessor before closing.
Climate risk First Street
- Flood 1/10 Low FEMA zone X (unshaded) · 0% chance over 30 yrs
- Wildfire 3/10 Moderate
- Heat 1/10 Low 7 d/yr ≥95°F today · 13 d/yr by 30 yrs out
- Wind 1/10 Low
- Air quality 1/10 Low 0 unhealthy d/yr today · 0 by 30 yrs out
Nearby sold comps map
Loading sold comps map…
Walkable amenities ~0.75 mi
Loading nearby amenities…
Taxation est. · year 1
- Rental income
- $13,427
- − Mortgage interest
- −$6,722
- − Property taxes
- −$681
- − Insurance
- −$600
- − Repairs & maintenance
- −$1,074
- − Management
- −$1,074
- − Depreciation
- −$3,491
- Taxable loss
- −$216
- Est. tax savings @ 24.0%
- +$52
- After-tax cash flow
- $1,826/yr
For passive investors: Depreciation is non-cash, so a rental often shows a tax loss while cash-flowing — sheltering income. Rental losses are passive: they offset passive income freely, and up to $25,000/yr can offset ordinary (W-2) income if you actively participate and your MAGI is under $100k (phasing out to $0 by $150k); unused losses carry forward. On sale, claimed depreciation is recaptured at up to 25%, and gains may owe capital-gains tax (a 1031 exchange can defer both). Figures are a year-1 estimate at your 24.0% rate — not tax advice; consult a CPA.
Schools (NCES district)
- District
- Hillman Community Schools
- NCES district ID
- 2618360
- Math proficiency
- 22% ▬ 0.00%
- Reading proficiency
- 40% ▲ 3.00%
- Median HH income
- $37,668
- Composite
- 25.78/100
- National rank
- #7368
- State rank
- #361 of 540 in MI
Livability — Hillman
- Score
- 61/100
- State rank
- #575
- US rank
- #18368
Category grades
Schools grade is shown separately in the Schools card above.
Census & demographics
- Census place
- Hillman, MI
- Population (ZIP)
- 3,502
Population outlook (Montmorency County) Hauer SSP2
- Today (2025)
- 8,233 people
- By 2030
- 7,575 · -8.0%
- By 2040
- 6,202 · -24.7%
- By 2050
- 5,081 · -38.3%
- By 2075
- 3,119 · -62.1%
- By 2100
- 1,923 · -76.6%
Race, ethnicity, and origin ACS 2023
- Neighborhood character
- Predominantly White (95%)
- Race & ethnicity
- White 95% Two or more races 3% Hispanic / Latino 1% Native American 1%
- Common ancestry
- Romanian 9% Lithuanian 6% Slovak 2%
- Foreign-born
- 1% · Canada
Political lean MEDSL · Montmorency
- 2024 margin
- Solid R (+45.3) · D 26.6% · R 72.0% · Other 1.4%
- 2008→2024 swing
- -37.2pp toward R · 2008: -8.2pp · 2024: -45.3pp
- All cycles
- 2024: R+45.3 2020: R+43.4 2016: R+44.2 2012: R+17.4 2008: R+8.2
Not yet ingested
- Civics
- —
Market trends
- HPI YoY
- ▲ 11.19%
- Current HPI
- 208.751
- Rent YoY
- —
- Metro
- —
- State GDP YoY
- ▲ 1.37%
- F500 in state
- 28
Industry mix (Fortune 500 HQ in MI)
| Industry | F500 HQs | Revenue |
|---|---|---|
| Automotive Parts | 3 | $48B |
|
||
| Automotive | 2 | $372B |
|
||
| Chemicals | 1 | $45B |
|
||
| Automotive Retail | 1 | $29B |
|
||
| Healthcare / Medical Devices | 1 | $23B |
|
||
| Automotive Technology | 1 | $20B |
|
||
Price history
+152.6% since first listed4 events — show timeline
- 2026-06-13 Listed $120,000 WWMLS
- 2015-05-12 Sold (Public Records) $35,000 Public Records
- 2004-12-06 Sold (Public Records) $69,000 Public Records
- 2004-11-12 Sold (Public Records) $47,500 Public Records
Property tax history
+1.4%/yrLatest (2024): $681 · -20.9% YoY. Source: county tax records.
Cash-flow waterfall
monthlySold comps — $/sqft
last 12 mo · ≤1 miLoading sold comps…