23644 Wildwood Green Way · Spring, TX
Flood risk 1/10 · Minimal
- FEMA flood zone
- X (unshaded)
- Chance of flooding over 30 yrs
- 0.0%
- Est. flood insurance / yr
- $507 – $1,088
Fire risk 3/10 · Minor
- Est. fire insurance / yr
- $1,222 – $2,270
Heat risk 9/10 · Severe
- Hot days now (above 110°F)
- 7 days/yr
- Hot days in 30 yrs
- 25 days/yr
Wind risk 8/10 · Major
- Chance of severe wind over 30 yrs
- 99.0%
Air-quality risk 3/10 · Minor
- Unhealthy air days now
- 3 days/yr
- Unhealthy air days in 30 yrs
- 3 days/yr
Risk factors via First Street. Map © Google.
Why this score? — see what drove the D grade
The composite is a weighted blend of 9 inputs, each scored 0–100. Each bar is that input's sub-score; the figure is the points it added to the 100-point composite (weight × sub-score).
- Cash flow +13.5/30.0
- ARV discount +9.7/15.0
- 1% rule +5.1/10.0
- DSCR +4.1/10.0
- Livability +3.3/5.0
- Condition / age +2.5/5.0
- Rent growth +2.4/5.0
- Schools +2.0/10.0
- Appreciation +0.0/10.0
$170,000
🖨 Deal sheet (PDF) 📄 Offer letter ✓ Due diligence
Listing remarks
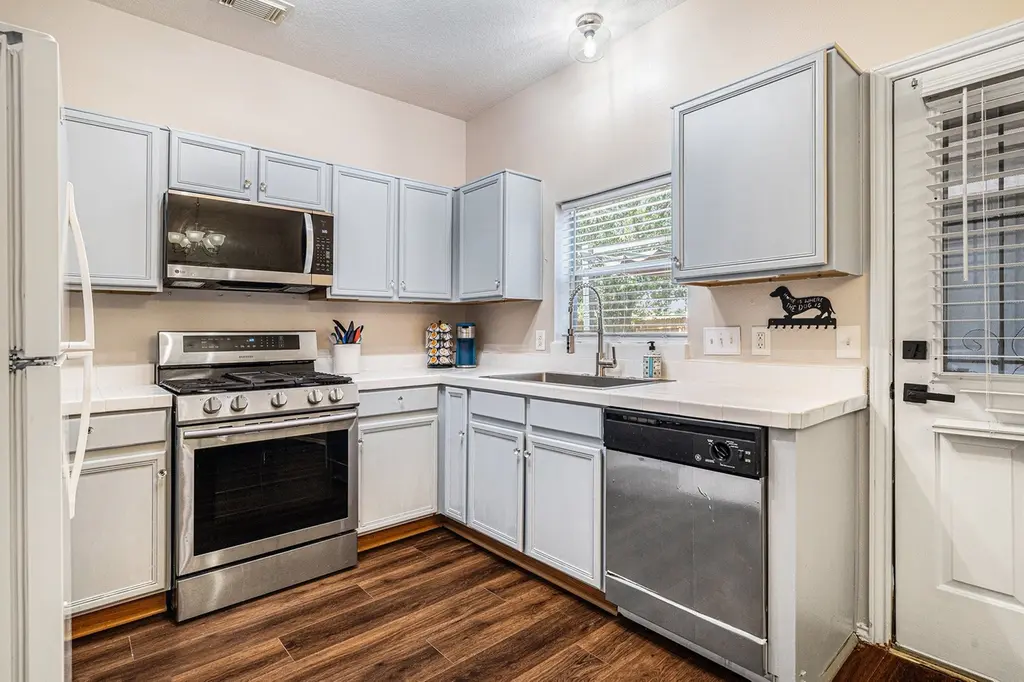
Welcome to this beautifully updated 2-bedroom, 1.5-bathroom townhome in Spring Crossing, offering modern comfort and style. Step inside to find spacious living areas with brand-new LVP flooring and neutral paint throughout. The kitchen is perfect for preparing your favorite meals, featuring stainless steel appliances, new countertops and plenty of storage. Both bedrooms provide inviting spaces with large closets, ideal for storing your essentials. Imagine enjoying a morning coffee or unwinding after a long day on your private backyard patio, complete with a charming pergola—perfect for relaxing or outdoor dining. This home also includes a 1-car garage and is ideally located with easy
Key facts
- Move-in ready
- Lvp flooring
- Charming pergola
Tags
Property features AI
Finance
- Other: Community curbs
- HOA & community: PMG Houston HOA; Annual association fee
Exterior
- Parking: Detached garage with garage door opener; 1 garage space; Concrete driveway/road surface
- Security: Smoke detectors
- Utilities: Public water; Public sewer
- Home design: Residential property; Southwest facing; 2 stories; Built in 2003; Full ownership
- Construction: Cement siding; Composition roof; Slab foundation
- Exterior features: Deck; Patio; Private yard; Fenced yard; Front yard
Interior
- Kitchen: Gas range and gas oven; Microwave; Dishwasher; Garbage disposal; Pantry
- Bedrooms: Primary bedroom on second floor (13 x 11); Additional bedroom on second floor (13 x 10)
- Flooring: Laminate; Plank; Vinyl
- Bathrooms: One full bathroom; One half bathroom; Primary bathroom on second floor (8 x 7)
- Heating & cooling: Central heating (gas); Central electric air conditioning; Thermostat (energy efficient)
- Interior features: Primary bedroom with attached bath; Pantry; Window treatments / coverings; Ceiling fans; Kitchen and dining combined; Programmable thermostat; Ventilation for improved indoor air quality
- Laundry & utility: Laundry located in utility room; Washer and dryer included; Electric and gas dryer hookups
Neighborhood map
What this means for you Summary
Snapshot
- This is a 2-bed/1.5-bath townhouse listed at $170k.
Deal economics
- At list price, monthly cash flow is $7 ($86/yr) — positive.
- The deal already cash-flows at list — no discount required.
- Meets the 1% rule at list price ($2k rent vs $170k).
- Recommended offer: $165k (3.0% below list) — sets the bar for market timing.
- Cap rate 6.3% vs local median 4.5% in Spring — top-decile yield for the area; either an underpriced asset or a hidden risk that comps aren't pricing in. Stress-test before assuming the spread holds.
Location & tenants
- Location reads 66/100 on livability (#635 in TX) — a middle-class / working-renter tenant base. Strengths: cost of living A+, housing A+, employment B; Watch: crime D, amenities F, commute F.
- Spring ISD (suburban): math 19% / reading 26% proficiency, ranked #730 of 826 in TX (top 88%) — low school quality limits family demand, transient renter base, plan for 1-2y turnover; 66% free/reduced lunch — lower-income household profile, screen leases tightly.
- Zoned schools: Gloria Marshall El (math 15% / reading 25%, grade F, #3,536 of 4,322 statewide, top 83%, 953 students, 81% FRL); Rickey C Bailey Middle (math 15% / reading 23%, grade F, #1,466 of 1,662 statewide, top 89%, 1,065 students, 85% FRL); Spring H S (math 12% / reading 21%, grade F, #1,497 of 1,632 statewide, top 92%, 2,760 students, 72% FRL).
- Market conditions: Rents soft (-0.3%/yr); 603 active listings in the ZIP; solid renter incomes; 29,883 units permitted in Harris County in 2024 (8,621 in 5+ unit buildings).
Forward outlook
- Local home prices are declining (-3.0%/yr); year-one equity from $1k of loan paydown is wiped out by about $5k of value loss. Plan a longer hold.
- Harris County population projected at +47% by 2050 — long-run rental-demand tailwind backs the buy-and-hold thesis.
Negotiation context
- It's been on market 52 days — a 3% lower offer ($165k) is reasonable based on typical stale-listing flexibility.
- 6 sale attempts since 20y ago with the ask held roughly flat each time — persistent listings suggest the price (not the market) is what's stuck; bring a comps-based counter.
Risks & watch-outs
- Climate carrying-cost: severe wind risk, 99% chance of damaging wind over 30y; extreme-heat days projected 7→25/yr by 2055 (HVAC capex compounding) — expect insurance premiums to compound above CPI over the hold.
Questions for the listing agent
- It's been on market 52 days. Have you received any prior offers? Is the seller open to a 3% concession, seller financing, or rate buy-down credit?
- What does the HOA fee cover, when was the last increase, and are there any pending special assessments or reserve-fund shortfalls?
- Is there a deadline driving the sale (1031 exchange, divorce, estate, relocation)? That informs how much negotiation room exists.
- Crime grade is D in this area — have there been break-ins, vandalism, or insurance claims at this property in the last 3 years? What carrier currently insures it and at what premium?
- The area grade is low — what's the realistic commute time and amenity access for the typical tenant pool here? Any planned neighborhood developments (good or bad) we should know about?
- What's the average days-on-market for RENTAL listings here right now (not sales)? A rising rental-DOM trend means longer vacancies and softer asking-rent achievability than the comps imply.
- What's the recent tenant-quality profile in this submarket — average credit score on applications, eviction rate, late-payment / NSF rate, and stable-employment percentage? A property-management company in the area should have these aggregated.
- How much new for-sale + rental construction is in the pipeline within 1–3 miles? Heavy new supply typically softens prices + rents 12–24 months out; constrained supply supports both.
Investment metrics
- 1% rule
- 1.01% ✓
- Cap rate
- 6.34%
- Cash-on-cash
- 0.18%
- DSCR
- 1.01
- GRM
- 8.3
CMA / ARV
- ARV (median comp)
- $178,870
- List price
- $170,000
- Delta
- -4.96%
- Verdict
- FAIR
- Comps
- 7 within 1.0 mi
Projected returns pro-forma
-3.0% appreciation · 0.0% rent growth · sell at horizon
- IRR
- -19.9%
- Equity multiple
- 0.33×
- Total profit
- $-31,979
- Equity at exit
- $25,348
- IRR
- -22.6%
- Equity multiple
- 0.03×
- Total profit
- $-46,129
- Equity at exit
- $14,698
Cash invested: $47,600 (down + closing). Projections, not guarantees.
Landlord ↔ Tenant lean methodology
- Overall (STATE)
- 87 Strongly Landlord-Friendly
- State Texas
- 87 Strongly Landlord-Friendly · R+5
- County
- — inherits STATE
- City
- — inherits STATE
ZIP-level market 77373
- Rents YoY
- -0.3%
- Active inventory
- 603
- Price-to-rent
- 8.3×
Monthly cashflow live
- Estimated rent
- $1,713 medium interval (Pro) →
- Mortgage (P&I)
- −$891
- Tax from tax record
- −$354 /mo · $4,249/yr
- Insurance
- −$71
- HOA
- −$30
- Vacancy / Maint / Mgmt
- −$360
- Net cashflow
- $7
Break-even live
Sensitivity live
| Price | -10% $103 | -5% $55 | +0% $7 | +5% $-41 | +10% $-89 |
|---|---|---|---|---|---|
| Rent | -10% $-128 | -5% $-60 | +0% $7 | +5% $75 | +10% $143 |
| Rate | -1.0pp $93 | -0.5pp $50 | base $7 | +0.5pp $-37 | +1.0pp $-82 |
UW: 25.0% down · 7.5% · 30yr · 1.5% tax · 5.0% vac · 8.0% maint · 8.0% mgmt
Financing live
Cash to close
- Down payment
- $42,500
- Closing costs
- $5,100
- Reserves months
- —
- Total cash needed
- —
Loan-product check · same deal, 3 products live
Conventional
25% down · 7.5% · 30yr
- Down + closing
- —
- Monthly P&I
- —
- Monthly cashflow
- —
- DSCR
- —
- Eligible?
- —
Personal DTI + credit; lowest rate.
DSCR
20% down · 8.5% · 30yr
- Down + closing
- —
- Monthly P&I
- —
- Monthly cashflow
- —
- DSCR
- —
- Eligible?
- —
No personal income docs; deal must DSCR.
Hard money
10% down · 12.0% · 12mo
- Down + closing
- —
- Monthly P&I
- —
- Monthly cashflow
- —
- DSCR
- —
- Eligible?
- —
Short-term bridge; refi at stabilization.
HOA detail
- Monthly dues
- $30 · $360/yr
Listing history 36 events
-
2026-06-21days on market $170,000 Active 52 DOM
-
2026-06-18days on market $170,000 Active 49 DOM
-
2026-06-17days on market $170,000 Active 48 DOM
-
2026-06-16days on market $170,000 Active 47 DOM
-
2026-06-15days on market $170,000 Active 46 DOM
-
2026-06-13days on market $170,000 Active 44 DOM
-
2026-06-13days on market $170,000 Active 43 DOM
-
2026-06-09days on market $170,000 Active 40 DOM
-
2026-06-08days on market $170,000 Active 39 DOM
-
2026-06-07days on market $170,000 Active 38 DOM
-
2026-06-04days on market $170,000 Active 35 DOM
-
2026-06-03days on market $170,000 Active 34 DOM
-
2026-06-02days on market $170,000 Active 33 DOM
-
2026-06-01days on market $170,000 Active 32 DOM
-
2026-05-31days on market $170,000 Active 31 DOM
-
2026-04-30$170,000 Active 957-char remark
-
2026-04-22historical
-
2026-03-26price $165,000
-
2026-03-02price $170,000
-
2026-02-13price $173,000
-
2025-12-11$175,000 Active
-
2025-12-03historical
-
2025-10-21price $174,990
-
2025-08-29price $178,000
-
2025-07-31$180,000 Active
-
2024-03-04soldstatus
-
2024-03-01soldstatus Sold
-
2024-02-09status Pending
-
2024-01-31status Option Pending
-
2024-01-25$174,900 Active
-
2024-01-19historical $174,900
-
2006-07-20soldstatus
-
2006-05-20historical
-
2006-04-30$89,000
-
2006-04-30historical
-
2006-03-17$89,000
ⓘ Source: listings_history table (triggers on properties + properties_extension) + one-shot
backfill from property_details.listing_events for pre-trigger history.
Tax reassessment forecast TX · Resets to sale price
- Current annual tax
- $4,249 · $354/mo
- Projected year-2 tax
- $4,249 · $354/mo
- Expected delta
- $0/yr ($0/mo · 0.0%)
ⓘ Screening estimate from a state-policy table — verify with the county assessor before closing.
Climate risk First Street
- Flood 1/10 Low FEMA zone X (unshaded) · 0% chance over 30 yrs
- Wildfire 3/10 Moderate
- Heat 9/10 Extreme 7 d/yr ≥110°F today · 25 d/yr by 30 yrs out
- Wind 8/10 Severe 99% chance of damaging wind over 30 yrs
- Air quality 3/10 Moderate 3 unhealthy d/yr today · 3 by 30 yrs out
Nearby sold comps map
Loading sold comps map…
Walkable amenities ~0.75 mi
Loading nearby amenities…
Taxation est. · year 1
- Rental income
- $20,562
- − Mortgage interest
- −$9,523
- − Property taxes
- −$4,249
- − Insurance
- −$850
- − Repairs & maintenance
- −$1,645
- − Management
- −$1,645
- − HOA
- −$360
- − Depreciation
- −$4,945
- Taxable loss
- −$2,656
- Est. tax savings @ 24.0%
- +$637
- After-tax cash flow
- $724/yr
For passive investors: Depreciation is non-cash, so a rental often shows a tax loss while cash-flowing — sheltering income. Rental losses are passive: they offset passive income freely, and up to $25,000/yr can offset ordinary (W-2) income if you actively participate and your MAGI is under $100k (phasing out to $0 by $150k); unused losses carry forward. On sale, claimed depreciation is recaptured at up to 25%, and gains may owe capital-gains tax (a 1031 exchange can defer both). Figures are a year-1 estimate at your 24.0% rate — not tax advice; consult a CPA.
Schools (NCES district)
- District
- Spring ISD
- NCES district ID
- 4841220
- Math proficiency
- 19% ▼ -13.00%
- Reading proficiency
- 26% ▼ -6.00%
- Median HH income
- $51,584
- Composite
- 20.12/100
- National rank
- #8643
- State rank
- #730 of 826 in TX
Livability — Spring
- Score
- 66/100
- State rank
- #635
- US rank
- #12101
Category grades
Schools grade is shown separately in the Schools card above.
Census & demographics
- Census place
- Spring, TX
- County
- Harris County · 4,702,590 people
- City population
- 430,529
- Metro
- Houston-The Woodlands-Sugar Land, TX
- Population (ZIP)
- 69,739
- Household income
- $88,617
- Rent vs Own
- Severe rent burden
- 1050.0
Population outlook (Harris County) Hauer SSP2
- Today (2025)
- 5,571,493 people
- By 2030
- 6,089,821 · +9.3%
- By 2040
- 7,142,806 · +28.2%
- By 2050
- 8,185,864 · +46.9%
- By 2075
- 10,574,329 · +89.8%
- By 2100
- 12,109,958 · +117.4%
Race, ethnicity, and origin ACS 2023
- Neighborhood character
- Diverse neighborhood (Simpson 0.69)
- Race & ethnicity
- Hispanic / Latino 40% White 30% Black 23% Two or more races 22% Asian 3%
- Hispanic origin (detail)
- Mexican 27% Puerto Rican 2% Cuban 2% Dominican 2%
- Common ancestry
- Lithuanian 2% Italian 1% Slovak 1%
- Foreign-born
- 17% · Canada, Jamaica, Vietnam
- Languages at home
- 64% English-only · Spanish 32% Vietnamese 1% Other Indo-European 1%
Political lean MEDSL · Harris
- 2024 margin
- Lean D (+5.5) · D 52.0% · R 46.4% · Other 1.6%
- 2008→2024 swing
- +3.9pp toward D · 2008: 1.6pp · 2024: 5.5pp
- All cycles
- 2024: D+5.5 2020: D+13.3 2016: D+12.4 2012: D+0.1 2008: D+1.6
Not yet ingested
- Civics
- —
Market trends
- HPI YoY
- ▼ -142.98%
- Current HPI
- 251.7231
- Rent YoY
- ▼ -0.30%
- Metro
- Houston-The Woodlands-Sugar Land, TX
- State GDP YoY
- ▲ 3.95%
- F500 in state
- 110
Industry mix (Fortune 500 HQ in TX)
| Industry | F500 HQs | Revenue |
|---|---|---|
| Energy | 16 | $1,198B |
|
||
| Technology | 5 | $198B |
|
||
| Engineering / Construction | 4 | $72B |
|
||
| Energy Services | 3 | $60B |
|
||
| Utilities | 3 | $41B |
|
||
| Healthcare | 2 | $330B |
|
||
Price history
+91.0% since first listed21 events — show timeline
- 2026-04-30 Listed $170,000 HARMLS
- 2026-04-22 Listing Removed — HARMLS
- 2026-03-26 Price Changed $165,000 HARMLS
- 2026-03-02 Price Changed $170,000 HARMLS
- 2026-02-13 Price Changed $173,000 HARMLS
- 2025-12-11 Listed $175,000 HARMLS
- 2025-12-03 Listing Removed — HARMLS
- 2025-10-21 Price Changed $174,990 HARMLS
- 2025-08-29 Price Changed $178,000 HARMLS
- 2025-07-31 Listed $180,000 HARMLS
- 2024-03-04 Sold (Public Records) — Public Records
- 2024-03-01 Sold (MLS) — HARMLS
- 2024-02-09 Pending — HARMLS
- 2024-01-31 Pending — HARMLS
- 2024-01-25 Listed $174,900 HARMLS
- 2024-01-19 Coming Soon $174,900 HARMLS
- 2006-07-20 Sold (Public Records) — Public Records
- 2006-05-20 Listing Removed — HARMLS
- 2006-04-30 Listing Removed — HARMLS
- 2006-04-30 Listed $89,000 HARMLS
- 2006-03-17 Listed $89,000 HARMLS
Property tax history
+3.6%/yrLatest (2025): $4,249 · +0.6% YoY. Source: county tax records.
Cash-flow waterfall
monthlySold comps — $/sqft
last 12 mo · ≤1 miLoading sold comps…