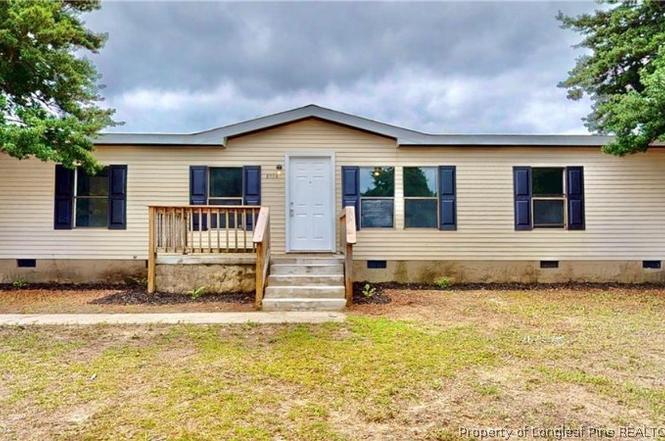
5007 Starbeam Dr · Hope Mills, NC
Flood risk 1/10 · Minimal
- FEMA flood zone
- X (unshaded)
- Chance of flooding over 30 yrs
- 0.0%
- Est. flood insurance / yr
- $507 – $1,088
Fire risk 5/10 · Moderate
- Est. fire insurance / yr
- $906 – $1,684
Heat risk 8/10 · Major
- Hot days now (above 106°F)
- 7 days/yr
- Hot days in 30 yrs
- 16 days/yr
Wind risk 6/10 · Moderate
- Chance of severe wind over 30 yrs
- 74.0%
Air-quality risk 1/10 · Minimal
- Unhealthy air days now
- 0 days/yr
- Unhealthy air days in 30 yrs
- 0 days/yr
Risk factors via First Street. Map © Google.
Why this score? — see what drove the C+ grade
The composite is a weighted blend of 9 inputs, each scored 0–100. Each bar is that input's sub-score; the figure is the points it added to the 100-point composite (weight × sub-score).
- Cash flow +27.2/30.0
- DSCR +9.5/10.0
- ARV discount +7.7/15.0
- 1% rule +6.5/10.0
- Livability +3.4/5.0
- Schools +3.1/10.0
- Rent growth +2.7/5.0
- Condition / age +2.5/5.0
- Appreciation +0.0/10.0
$143,500
🖨 Deal sheet 📄 Offer letter ✓ Due diligence
Listing remarks
5007 Starbeam provides 3 bedrooms, 2 bathrooms spacious livingroom, dining area just off of the kitchen, granite countertops and stainless steel appliances all packed into one affordable package. The home has been updated and refreshed throughout from the light fixtures down to the new LVP flooring. With mature trees and low maintenance landscaping, your family can just move in and move on to your next phase of life in your new home.
Key facts
- New lvp flooring
- Granite countertops
- 7,405 sq ft lot
Tags
Property features AI
Finance
- Other: Located in CRYSTAL PARK subdivision; Zoned R6A (Residential District)
Exterior
- Utilities: Public water; Public sewer
- Home design: Manufactured home; One story
- Construction: Vinyl siding
- Exterior features: Crawl space foundation
Interior
- Kitchen: Refrigerator; Electric oven; Freezer
- Flooring: Vinyl flooring
- Bathrooms: 2 full bathrooms
- Heating & cooling: Heat pump heating; Central air conditioning
- Interior features: Open floor plan; Living room fireplace
- Laundry & utility: In-unit laundry
Neighborhood map
What this means for you Summary
Snapshot
- This is a 3-bed/2.0-bath manufactured listed at $144k.
Deal economics
- At list price, monthly cash flow is $412 ($5k/yr) — positive.
- The deal already cash-flows at list — no discount required.
- Meets the 1% rule at list price ($2k rent vs $144k).
- Recommended offer: $131k (9.0% below list) — sets the bar for market timing.
- Cap rate 9.7% vs local median 4.8% in Hope Mills — top-decile yield for the area; either an underpriced asset or a hidden risk that comps aren't pricing in. Stress-test before assuming the spread holds.
Location & tenants
- Location reads 67/100 on livability (#234 in NC) — a middle-class / working-renter tenant base. Strengths: cost of living A+, housing A+, health & safety B+; Watch: crime D-, amenities F, commute F.
- Cumberland County Schools (urban): math 32% / reading 41% proficiency, ranked #126 of 178 in NC (top 71%) — families likely to look elsewhere, expect single-tenant / working-renter base with shorter leases.
- Zoned schools: Douglas Byrd Middle (math 13% / reading 30%, grade F, #422 of 475 statewide, top 89%, 935 students, 100% FRL); Douglas Byrd High (math 22% / reading 42%, grade F, #445 of 535 statewide, top 84%, 940 students, 99% FRL) — zoned schools average 99% FRL vs 55% district-wide (45 pts higher); higher-poverty schools than district average — tighter screening recommended.
- Market conditions: Rents flat; 401 active listings in the ZIP; 17 comparable units currently listed for rent nearby; rentals at typical pace (median 24d on market — plan ~3-4 weeks tenant-placement turnaround); 1,125 units permitted in Cumberland County in 2024 (104 in 5+ unit buildings).
Forward outlook
- Local home prices are declining (-3.0%/yr); year-one equity from $992 of loan paydown is wiped out by about $4k of value loss. Plan a longer hold.
Negotiation context
- It's been on market 97 days — a 9% lower offer ($131k) is reasonable based on typical stale-listing flexibility.
- 6 sale attempts since 2y ago with the ask held roughly flat each time — persistent listings suggest the price (not the market) is what's stuck; bring a comps-based counter.
- Current owner paid $75k; list at $144k implies a 91% gain — meaningful room to come down on a strong offer.
Risks & watch-outs
- Climate carrying-cost: major wind risk, 74% chance of damaging wind over 30y; moderate wildfire risk; extreme-heat days projected 7→16/yr by 2055 (HVAC capex compounding) — expect insurance premiums to compound above CPI over the hold.
Questions for the listing agent
- It's been on market 97 days. Have you received any prior offers? Is the seller open to a 9% concession, seller financing, or rate buy-down credit?
- Why hasn't it sold? Are there any deal-killer items the seller is aware of (foundation, flood, title, zoning, code violations)?
- Is there a deadline driving the sale (1031 exchange, divorce, estate, relocation)? That informs how much negotiation room exists.
- Schools are D-rated, which usually means shorter tenancies and higher turnover. Who's the typical renter profile here, and what's been the actual vacancy rate?
- Crime grade is D in this area — have there been break-ins, vandalism, or insurance claims at this property in the last 3 years? What carrier currently insures it and at what premium?
- What's the average days-on-market for RENTAL listings here right now (not sales)? A rising rental-DOM trend means longer vacancies and softer asking-rent achievability than the comps imply.
- What's the recent tenant-quality profile in this submarket — average credit score on applications, eviction rate, late-payment / NSF rate, and stable-employment percentage? A property-management company in the area should have these aggregated.
- How much new for-sale + rental construction is in the pipeline within 1–3 miles? Heavy new supply typically softens prices + rents 12–24 months out; constrained supply supports both.
Investment metrics
- 1% rule
- 1.15% ✓
- Cap rate
- 9.74%
- Cash-on-cash
- 12.30%
- DSCR
- 1.55
- GRM
- 7.3
CMA / ARV
- ARV (on-the-fly)
- $144,000
- Comps found
- 1
Show comp detail 1 sale within ~0.75 mi
| Address | Dist | Beds/Ba | Sqft | Sold | Price | $/sf | Match |
|---|---|---|---|---|---|---|---|
| 5026 New Moon Dr | 0.08mi | 2/2.0 (-1) | 1,239 (+8%) | 24mo | $155,000 | $125 | 59 |
Match score weights: distance 35% · size 25% · config 20% · recency 20%. Top-matched comps best support the ARV.
Projected returns pro-forma
-3.0% appreciation · 0.9% rent growth · sell at horizon
- IRR
- -0.3%
- Equity multiple
- 0.99×
- Total profit
- $-466
- Equity at exit
- $21,396
- IRR
- 7.2%
- Equity multiple
- 1.49×
- Total profit
- $19,823
- Equity at exit
- $12,407
Cash invested: $40,180 (down + closing). Projections, not guarantees.
Landlord ↔ Tenant lean methodology
- Overall (STATE)
- 85 Strongly Landlord-Friendly
- State North Carolina
- 85 Strongly Landlord-Friendly · R+3
- County
- — inherits STATE
- City
- — inherits STATE
ZIP-level market 28306
- Home prices YoY
- -17.7%
- Rents YoY
- 0.9%
- Active inventory
- 401
- Price-to-rent
- 7.3×
Monthly cashflow live
- Estimated rent
- $1,644 high interval (Pro) →
- Mortgage (P&I)
- −$753
- Tax from tax record
- −$74 /mo · $892/yr
- Insurance
- −$60
- HOA
- −$0
- Vacancy / Maint / Mgmt
- −$345
- Net cashflow
- $412
Break-even live
UW: 25.0% down · 7.5% · 30yr · 1.5% tax · 5.0% vac · 8.0% maint · 8.0% mgmt
Financing live
Cash to close
- Down payment
- $35,875
- Closing costs
- $4,305
- Reserves months
- —
- Total cash needed
- —
Loan-product check · same deal, 3 products live
Conventional
25% down · 7.5% · 30yr
- Down + closing
- —
- Monthly P&I
- —
- Monthly cashflow
- —
- DSCR
- —
- Eligible?
- —
Personal DTI + credit; lowest rate.
DSCR
20% down · 8.5% · 30yr
- Down + closing
- —
- Monthly P&I
- —
- Monthly cashflow
- —
- DSCR
- —
- Eligible?
- —
No personal income docs; deal must DSCR.
Hard money
10% down · 12.0% · 12mo
- Down + closing
- —
- Monthly P&I
- —
- Monthly cashflow
- —
- DSCR
- —
- Eligible?
- —
Short-term bridge; refi at stabilization.
Rent comps 17 comps
| Address | Beds | Baths | Sqft | Rent | $/sqft | DOM | Units | Dist |
|---|---|---|---|---|---|---|---|---|
| 3038 Walesby Dr Fayetteville, NC | 3.0 | 2.0 | 1272 | $1,650 | $1.30 | 23d | 1 | 0.27mi |
| 2207 Puffin Pl Fayetteville, NC | 3.0 | 2.0 | 1214 | $1,950 | $1.61 | 13d | 1 | 0.62mi |
| 2524 Penny Dr Fayetteville, NC | 3.0 | 2.0 | 1330 | $1,400 | $1.05 | 23d | 1 | 0.70mi |
| 2621 Elcone Dr Unit 2621 Fayetteville, NC | 2.0 | 1.5 | 815 | $999 | $1.23 | 13d | 1 | 0.76mi |
| 1209 Snowy Egret Dr Fayetteville, NC | 3.0 | 2.5 | 1470 | $1,800 | $1.22 | 23d | 1 | 0.77mi |
| 5532 Robmont Dr Fayetteville, NC | 2.0 | 2.0 | 1301 | $1,800 | $1.38 | 13d | 1 | 0.83mi |
| 5032 Shimmer Dr Fayetteville, NC | 4.0 | 2.0 | 1473 | $1,750 | $1.19 | 23d | 1 | 0.88mi |
| 5032 Shimmer Dr Fayetteville, NC | 4.0 | 2.0 | 1473 | $1,700 | $1.15 | 13d | 1 | 0.88mi |
| 2579 Gotts Ln Fayetteville, NC | 2.0 | 2.0 | 1200 | $1,295 | $1.08 | 21d | 1 | 0.89mi |
| 4615 Cumberland Rd Fayetteville, NC | 2.0 | 1.0 | 783 | $825 | $1.05 | 23d | 1 | 0.95mi |
| 1055 Winnall LN Hope Mills, NC | 1.0–3.0 | 1.0–2.0 | 1132 | $2,000 | $1.77 | 13d | 20 | 1.06mi |
| 4630 Canterbury Rd Fayetteville, NC | 3.0 | 2.0 | 1250 | $1,350 | $1.08 | 23d | 1 | 1.11mi |
| 2690 Belhaven Rd Fayetteville, NC | 3.0 | 1.0 | 1264 | $1,350 | $1.07 | 23d | 1 | 1.12mi |
| 3918 Donna St Fayetteville, NC | 3.0 | 1.0 | 1000 | $1,350 | $1.35 | 23d | 1 | 1.23mi |
| 3100 Winesap Rd Hope Mills, NC | 3.0 | 2.0 | 1082 | $1,495 | $1.38 | 13d | 1 | 1.25mi |
| 5151 Queensdale Dr Fayetteville, NC | 3.0 | 2.0 | 1107 | $1,295 | $1.17 | 23d | 1 | 1.49mi |
| 5151 Queensdale Dr Fayetteville, NC | 3.0 | 2.0 | 1107 | $1,295 | $1.17 | 13d | 1 | 1.49mi |
Listing history 35 events
-
2026-06-18days on market $143,500 Active 97 DOM
-
2026-06-17days on market $143,500 Active 96 DOM
-
2026-06-16days on market $143,500 Active 95 DOM
-
2026-06-15days on market $143,500 Active 94 DOM
-
2026-06-14days on market $143,500 Active 92 DOM
-
2026-06-13days on market $143,500 Active 91 DOM
-
2026-06-10days on market $143,500 Active 89 DOM
-
2026-06-09days on market $143,500 Active 88 DOM
-
2026-06-08days on market $143,500 Active 87 DOM
-
2026-06-07days on market $143,500 Active 86 DOM
-
2026-06-03days on market $143,500 Active 82 DOM
-
2026-06-02days on market $143,500 Active 81 DOM
-
2026-06-01days on market $143,500 Active 80 DOM
-
2026-05-31days on market $143,500 Active 79 DOM
-
2026-05-30days on market $143,500 Active 78 DOM
-
2026-03-11$143,500 Active
-
2025-07-11price $143,500
-
2025-06-03$145,000 Active
-
2025-04-23price $145,500
-
2025-03-30price $147,500
-
2025-03-11status Active
-
2025-02-18historical Active Under Contract
-
2025-02-18historical
-
2025-02-04$150,000 Active
-
2024-12-23historical
-
2024-12-03price $143,000
-
2024-11-18price $144,000
-
2024-11-07price $145,000
-
2024-10-16price $148,400
-
2024-09-10$149,900 Active
-
2024-07-26soldstatus $75,000 Closed
-
2024-07-26soldstatus $75,000
-
2024-07-12status Pending
-
2024-07-06$70,000 Active
-
1985-05-01soldstatus $38,050
ⓘ Source: listings_history table (triggers on properties + properties_extension) + one-shot
backfill from property_details.listing_events for pre-trigger history.
Tax reassessment forecast NC · Resets to sale price
- Current annual tax
- $892 · $74/mo
- Projected year-2 tax
- $1,177 · $98/mo
- Expected delta
- +$285/yr (+$24/mo · 31.9%)
ⓘ Screening estimate from a state-policy table — verify with the county assessor before closing.
Climate risk First Street
- Flood 1/10 Low FEMA zone X (unshaded) · 0% chance over 30 yrs
- Wildfire 5/10 Major
- Heat 8/10 Severe 7 d/yr ≥106°F today · 16 d/yr by 30 yrs out
- Wind 6/10 Major 74% chance of damaging wind over 30 yrs
- Air quality 1/10 Low 0 unhealthy d/yr today · 0 by 30 yrs out
Nearby sold comps map
Loading sold comps map…
Walkable amenities ~0.75 mi
Loading nearby amenities…
Taxation est. · year 1
- Rental income
- $19,723
- − Mortgage interest
- −$8,038
- − Property taxes
- −$892
- − Insurance
- −$718
- − Repairs & maintenance
- −$1,578
- − Management
- −$1,578
- − Depreciation
- −$4,175
- Taxable income
- $2,746
- Est. tax owed @ 24.0%
- −$659
- After-tax cash flow
- $4,283/yr
For passive investors: Depreciation is non-cash, so a rental often shows a tax loss while cash-flowing — sheltering income. Rental losses are passive: they offset passive income freely, and up to $25,000/yr can offset ordinary (W-2) income if you actively participate and your MAGI is under $100k (phasing out to $0 by $150k); unused losses carry forward. On sale, claimed depreciation is recaptured at up to 25%, and gains may owe capital-gains tax (a 1031 exchange can defer both). Figures are a year-1 estimate at your 24.0% rate — not tax advice; consult a CPA.
Schools (NCES district)
- District
- Cumberland County Schools
- NCES district ID
- 3700011
- Math proficiency
- 32% ▼ -2.00%
- Reading proficiency
- 41% ▼ -1.00%
- Median HH income
- $44,168
- Composite
- 31.0/100
- National rank
- #6096
- State rank
- #126 of 178 in NC
Livability — Hope Mills
- Score
- 67/100
- State rank
- #234
- US rank
- #10761
Category grades
Schools grade is shown separately in the Schools card above.
Census & demographics
- County
- Cumberland County · 265,314 people
- City population
- 39,196
- Metro
- Fayetteville, NC
- Population (ZIP)
- 43,042
- Household income
- $67,544
- Rent vs Own
- Severe rent burden
- 1386.0
Population outlook (Cumberland County) Hauer SSP2
- Today (2025)
- 330,855 people
- By 2030
- 333,523 · +0.8%
- By 2040
- 335,583 · +1.4%
- By 2050
- 335,325 · +1.4%
- By 2075
- 342,853 · +3.6%
- By 2100
- 340,698 · +3.0%
Race, ethnicity, and origin ACS 2023
- Neighborhood character
- Diverse neighborhood (Simpson 0.68)
- Race & ethnicity
- White 44% Black 33% Hispanic / Latino 13% Two or more races 8% Asian 4% Native American 2%
- Hispanic origin (detail)
- Mexican 5% Puerto Rican 5%
- Common ancestry
- Italian 2% Slovak 1% Serbian 1%
- Foreign-born
- 8% · Canada, South Korea, Jamaica
- Languages at home
- 87% English-only · Spanish 9% Other Indo-European 1% French/Haitian/Cajun 1%
Political lean MEDSL · Cumberland
- 2024 margin
- D (+13.4) · D 56.1% · R 42.7% · Other 1.2%
- 2008→2024 swing
- -4.3pp toward R · 2008: 17.7pp · 2024: 13.4pp
- All cycles
- 2024: D+13.4 2020: D+16.6 2016: D+16.0 2012: D+19.7 2008: D+17.7
Not yet ingested
- Civics
- —
Market trends
- HPI YoY
- ▼ -51.69%
- Current HPI
- 239.7281
- Rent YoY
- ▲ 0.90%
- Metro
- Fayetteville, NC
- State GDP YoY
- ▲ 3.28%
- F500 in state
- 26
Industry mix (Fortune 500 HQ in NC)
| Industry | F500 HQs | Revenue |
|---|---|---|
| Financial Services | 2 | $213B |
|
||
| Retail | 2 | $95B |
|
||
| Industrial Conglomerate | 1 | $38B |
|
||
| Metals / Steel | 1 | $35B |
|
||
| Utilities | 1 | $30B |
|
||
| Industrial Machinery | 1 | $19B |
|
||
Price history
+277.1% since first listed20 events — show timeline
- 2026-03-11 Listed $143,500 LPRMLS
- 2025-07-11 Price Changed $143,500 LPRMLS
- 2025-06-03 Listed $145,000 LPRMLS
- 2025-04-23 Price Changed $145,500 TMLS
- 2025-03-30 Price Changed $147,500 TMLS
- 2025-03-11 Relisted — TMLS
- 2025-02-18 Contingent — TMLS
- 2025-02-18 Listing Removed — TMLS
- 2025-02-04 Listed $150,000 TMLS
- 2024-12-23 Listing Removed — TMLS
- 2024-12-03 Price Changed $143,000 TMLS
- 2024-11-18 Price Changed $144,000 TMLS
- 2024-11-07 Price Changed $145,000 TMLS
- 2024-10-16 Price Changed $148,400 TMLS
- 2024-09-10 Listed $149,900 TMLS
- 2024-07-26 Sold (Public Records) $75,000 Public Records
- 2024-07-26 Sold (MLS) $75,000 LPRMLS
- 2024-07-12 Pending — LPRMLS
- 2024-07-06 Listed $70,000 LPRMLS
- 1985-05-01 Sold (Public Records) $38,050 Public Records
Property tax history
+6.9%/yrLatest (2025): $892 · +60.8% YoY. Source: county tax records.
Cash-flow waterfall
monthlySold comps — $/sqft
last 12 mo · ≤1 miLoading sold comps…