 🏗️ New Construction
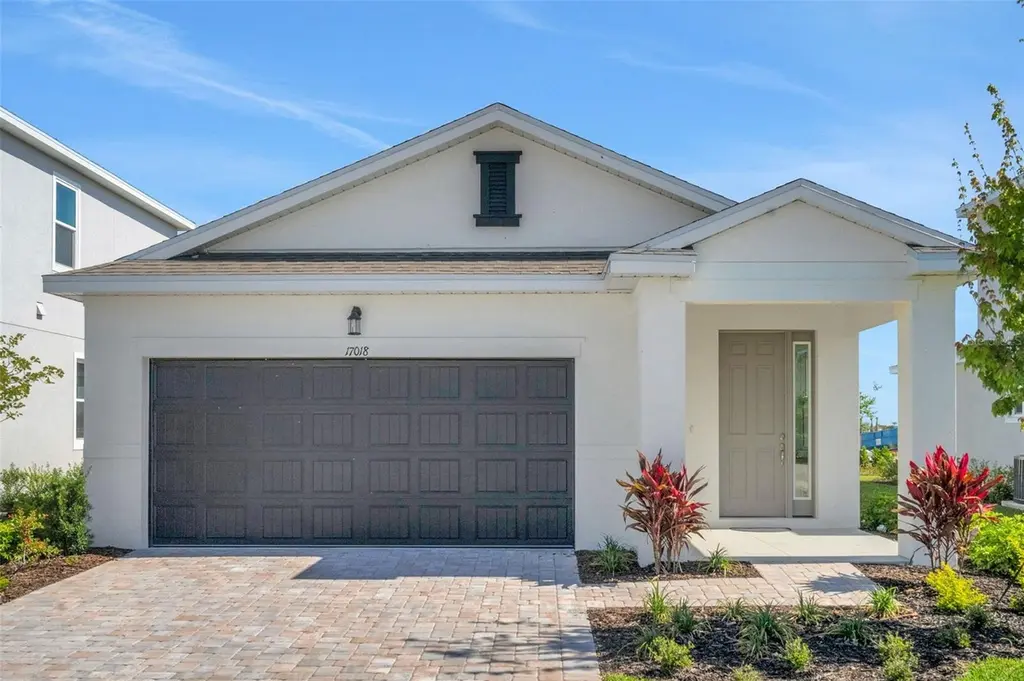
17036 Cottontail Cir · North Fort Myers, FL
Flood risk No data
- FEMA flood zone
- —
- Chance of flooding over 30 yrs
- —
- Est. flood insurance / yr
- —
Fire risk No data
- Est. fire insurance / yr
- —
Heat risk No data
- Hot days now (above threshold)
- —
- Hot days in 30 yrs
- —
Wind risk No data
- Chance of severe wind over 30 yrs
- —
Air-quality risk No data
- Unhealthy air days now
- —
- Unhealthy air days in 30 yrs
- —
Risk factors via First Street. Map © Google.
Why this score? — see what drove the D- grade
The composite is a weighted blend of 9 inputs, each scored 0–100. Each bar is that input's sub-score; the figure is the points it added to the 100-point composite (weight × sub-score).
- Cash flow +8.5/30.0
- ARV discount +7.5/15.0
- Schools +4.6/10.0
- 1% rule +3.9/10.0
- Livability +3.7/5.0
- Rent growth +3.5/5.0
- Condition / age +2.5/5.0
- Appreciation +2.4/10.0
- DSCR +2.3/10.0
$301,990
🖨 Deal sheet (PDF) 📄 Offer letter ✓ Due diligence
Listing remarks
One or more photo(s) has been virtually staged. Under Construction. Sample Image Experience the perfect blend of nature, style, and community in this stunning TURIN model home. Located in the gated enclave of Creekside Run, you’re just minutes from future Babcock Ranch happenings, B-Street and Midtown. Enjoy this picturesque, tree-lined neighborhood, walking distance to six parks and walking trails ideal for family, friends, and pets. Inside, the open-concept design features 9'4" ceilings, 8' sliding glass doors, and a seamless indoor-outdoor feel. The stylish kitchen showcases designer cabinetry, quartz countertops, tile backsplash, with a gas range and tankless water heater. Pl
Key facts
- 8,710 sq ft lot
- 2 garage spots
- Community pool
Property features AI
Finance
- Other: Home warranty included; Lease restrictions apply
- Financial info: Other annual assessment amount: $2,364; Total annual fees (multi-family fields): $5,020; total monthly fees: $418.33
- HOA & community: HOA (Dream Finders Homes) with required association approval; Monthly HOA fee: $284 (includes pool, internet, maintenance of grounds, recreational facilities, security); Additional quarterly fee: $403; Association amenities: clubhouse, pool, spa/hot tub, tennis courts, pickleball courts, basketball court, playground, park, trails, recreation facilities, security, maintenance, fence restrictions, community mailbox, sidewalks, street lights, golf carts allowed, reclaimed water irrigation
Exterior
- Parking: Attached 2-car garage (21x20); Driveway; Electric vehicle charging station(s)
- Security: Smoke detector(s); Community security included in association amenities
- Utilities: Public water; Public sewer / sewer connected; Electricity connected; natural gas available; BB/HS Internet available; cable available; Fire hydrant; underground utilities; water connected; sprinkler recycled
- Home design: Single family residence (new construction, under construction); One story; South-facing entry
- Construction: Block and stucco construction; Shingle roof; Slab foundation; New construction by Dream Finders Homes (Builder model: TURIN)
- Exterior features: Covered front and rear porches; Lighting; Sidewalk; Sliding doors; Irrigation equipment; Cleared, corner lot on a paved, private-maintained road; Planned unit development community
Interior
- Kitchen: Dishwasher; Range; Disposal; Exhaust fan; Solid surface counters; Tankless water heater
- Bedrooms: 3 bedrooms
- Flooring: Carpet; Tile
- Bathrooms: 2 full bathrooms
- Heating & cooling: Central heating (electric, heat pump); Central air conditioning
- Interior features: High ceilings; Open floorplan with living room/dining room combo; Solid surface counters; Thermostat; Walk-in closet(s); Double pane, ENERGY STAR qualified windows; Dishwasher, Disposal, Exhaust fan, Range, Tankless water heater; Carpet and tile flooring
- Laundry & utility: Inside laundry room
Neighborhood map
What this means for you Summary
Snapshot
- This is a 3-bed/2.0-bath land listed at $302k.
Deal economics
- At list price, monthly cash flow is $-263 ($-3k/yr) — negative.
- To cash-flow at today's rent, offer at most $256k (15.4% below list).
- To meet the 1% rule (rent ≥ 1% of price), the offer needs to be $268k (11.2% below list).
- Recommended offer: $256k (15.4% below list) — sets the bar for cash-flow.
- Cap rate 5.2% vs local median 3.6% in North Fort Myers — top-decile yield for the area; either an underpriced asset or a hidden risk that comps aren't pricing in. Stress-test before assuming the spread holds.
Location & tenants
- Location reads 74/100 on livability (#269 in FL, #4,409 nationally) — a middle-class / working-renter tenant base. Strengths: cost of living A+, housing A+, health & safety A+; Watch: employment C-, amenities F, commute F.
- Charlotte (suburban): math 54% / reading 54% proficiency, ranked #22 of 73 in FL (top 30%) — acceptable for families but not a draw, mixed tenant base, ~2y average lease.
- Zoned schools: East Elementary School (math 67% / reading 68%, grade B+, #435 of 2,144 statewide, top 21%, 761 students, 52% FRL); Punta Gorda Middle School (math 54% / reading 52%, grade C+, #209 of 571 statewide, top 37%, 1,120 students, 41% FRL); Charlotte High School (math 44% / reading 46%, grade D-, #228 of 667 statewide, top 35%, 1,994 students, 41% FRL).
- Market conditions: Rents rising fast (+4.1%/yr); 1044 active listings in the ZIP; 40 comparable units currently listed for rent nearby; rentals at typical pace (median 23d on market — plan ~3-4 weeks tenant-placement turnaround); 4,585 units permitted in Charlotte County in 2024 (703 in 5+ unit buildings).
- This rent runs 44% of the median local income ($72k/yr) — at the standard rent-burdened threshold; future hikes will face affordability resistance.
Forward outlook
- Local home prices are declining (-3.0%/yr); year-one equity from $2k of loan paydown is wiped out by about $9k of value loss. Plan a longer hold.
- Charlotte County population projected at +24% by 2050 — long-run rental-demand tailwind backs the buy-and-hold thesis.
Negotiation context
- Only 1 days on market — expect competitive offers; lowballing is unlikely to land.
Questions for the listing agent
- What do current leases actually rent for vs. the listed asking? Can we see a recent rent roll and the last 12 months of T-12 income?
- What does the HOA fee cover, when was the last increase, and are there any pending special assessments or reserve-fund shortfalls?
- Is there a deadline driving the sale (1031 exchange, divorce, estate, relocation)? That informs how much negotiation room exists.
- The area grade is low — what's the realistic commute time and amenity access for the typical tenant pool here? Any planned neighborhood developments (good or bad) we should know about?
- What's the average days-on-market for RENTAL listings here right now (not sales)? A rising rental-DOM trend means longer vacancies and softer asking-rent achievability than the comps imply.
- What's the recent tenant-quality profile in this submarket — average credit score on applications, eviction rate, late-payment / NSF rate, and stable-employment percentage? A property-management company in the area should have these aggregated.
- How much new for-sale + rental construction is in the pipeline within 1–3 miles? Heavy new supply typically softens prices + rents 12–24 months out; constrained supply supports both.
Investment metrics
- 1% rule
- 0.89% ✗
- Cap rate
- 5.25%
- Cash-on-cash
- -3.73%
- DSCR
- 0.83
- GRM
- 9.4
CMA / ARV
No comps found within radius.
Projected returns pro-forma
-3.0% appreciation · 4.13% rent growth · sell at horizon
- IRR
- -21.0%
- Equity multiple
- 0.26×
- Total profit
- $-62,360
- Equity at exit
- $45,028
- IRR
- -11.6%
- Equity multiple
- 0.27×
- Total profit
- $-61,996
- Equity at exit
- $26,111
Cash invested: $84,557 (down + closing). Projections, not guarantees.
Landlord ↔ Tenant lean methodology
- Overall (STATE)
- 87 Strongly Landlord-Friendly
- State Florida
- 87 Strongly Landlord-Friendly · R+3
- County
- — inherits STATE
- City
- — inherits STATE
ZIP-level market 33982
- Home prices YoY
- -1.2%
- Rents YoY
- 4.1%
- Active inventory
- 1044
- Price-to-rent
- 9.4×
Monthly cashflow live
- Estimated rent
- $2,682 medium interval (Pro) →
- Mortgage (P&I)
- −$1,584
- Tax from tax record
- −$254 /mo · $3,046/yr
- Insurance
- −$126
- HOA
- −$418
- Vacancy / Maint / Mgmt
- −$563
- Net cashflow
- $-263
Break-even live
Sensitivity live
| Price | -10% $-92 | -5% $-177 | +0% $-263 | +5% $-348 | +10% $-434 |
|---|---|---|---|---|---|
| Rent | -10% $-475 | -5% $-369 | +0% $-263 | +5% $-157 | +10% $-51 |
| Rate | -1.0pp $-111 | -0.5pp $-186 | base $-263 | +0.5pp $-341 | +1.0pp $-421 |
UW: 25.0% down · 7.5% · 30yr · 1.5% tax · 5.0% vac · 8.0% maint · 8.0% mgmt
Financing live
Cash to close
- Down payment
- $75,498
- Closing costs
- $9,060
- Reserves months
- —
- Total cash needed
- —
Loan-product check · same deal, 3 products live
Conventional
25% down · 7.5% · 30yr
- Down + closing
- —
- Monthly P&I
- —
- Monthly cashflow
- —
- DSCR
- —
- Eligible?
- —
Personal DTI + credit; lowest rate.
DSCR
20% down · 8.5% · 30yr
- Down + closing
- —
- Monthly P&I
- —
- Monthly cashflow
- —
- DSCR
- —
- Eligible?
- —
No personal income docs; deal must DSCR.
Hard money
10% down · 12.0% · 12mo
- Down + closing
- —
- Monthly P&I
- —
- Monthly cashflow
- —
- DSCR
- —
- Eligible?
- —
Short-term bridge; refi at stabilization.
Rent comps 40 comps
| Address | Beds | Baths | Sqft | Rent | $/sqft | DOM | Units | Dist |
|---|---|---|---|---|---|---|---|---|
| 16922 Sage Ter Punta Gorda, FL | 4.0 | 2.0 | 1580 | $3,500 | $2.22 | 23d | 1 | 0.26mi |
| 44458 Diamond Trl Punta Gorda, FL | 3.0 | 2.0 | 1484 | $2,500 | $1.68 | 23d | 1 | 0.32mi |
| 17710 Shade Tree Loop Punta Gorda, FL | 4.0 | 2.0 | 1764 | $3,000 | $1.70 | 23d | 1 | 0.58mi |
| 44229 Saddlewood Ct Punta Gorda, FL | 4.0 | 2.0 | 1675 | $2,350 | $1.40 | 15d | 1 | 0.65mi |
| 44229 Saddlewood Ct Punta Gorda, FL | 4.0 | 2.0 | 1675 | $2,395 | $1.43 | 23d | 1 | 0.65mi |
| 17639 Wild Iris Ln Punta Gorda, FL | 2.0 | 2.0 | 1496 | $2,350 | $1.57 | 23d | 1 | 0.66mi |
| 44489 Panther Dr Punta Gorda, FL | 2.0 | 2.0 | 1985 | $10,000 | $5.04 | 15d | 1 | 0.70mi |
| 43693 Tree Top Trl Punta Gorda, FL | 3.0 | 3.0 | 1850 | $11,000 | $5.95 | 23d | 1 | 0.83mi |
| 17604 Fallen Branch Way Punta Gorda, FL | 4.0 | 3.0 | 2027 | $2,700 | $1.33 | 23d | 1 | 0.84mi |
| 43866 Blue Heron Ln Punta Gorda, FL | 2.0 | 2.0 | 1516 | $2,200 | $1.45 | 23d | 1 | 0.95mi |
| 43645 Sparrow Dr Punta Gorda, FL | 2.0 | 2.0 | 1503 | $6,500 | $4.32 | 15d | 1 | 1.04mi |
| 16000 Grassland Ln #3127 Punta Gorda, FL | 2.0 | 2.0 | 1355 | $6,000 | $4.43 | 23d | 1 | 1.20mi |
| 43060 Greenway Blvd #742 Punta Gorda, FL | 2.0 | 2.0 | 1154 | $6,000 | $5.20 | 23d | 1 | 1.23mi |
| 43060 Greenway Blvd #731 Punta Gorda, FL | 2.0 | 2.0 | 1301 | $6,500 | $5.00 | 23d | 1 | 1.23mi |
| 43060 Greenway Blvd #713 Punta Gorda, FL | 2.0 | 2.0 | 1150 | $5,400 | $4.70 | 23d | 1 | 1.23mi |
| 43050 Greenway Blvd Punta Gorda, FL | 2.0–3.0 | 2.0 | 1235 | $6,000 | $4.86 | 15d | 2 | 1.26mi |
| 43051 Greenway Blvd #822 Punta Gorda, FL | 2.0 | 2.0 | 1355 | $7,500 | $5.54 | 23d | 1 | 1.27mi |
| 43040 Greenway Blvd #532 Punta Gorda, FL | 2.0 | 2.0 | 1170 | $6,000 | $5.13 | 23d | 1 | 1.30mi |
| 43041 Greenway Blvd Punta Gorda, FL | 2.0–3.0 | 2.0 | 1569 | $7,500 | $4.78 | 23d | 3 | 1.31mi |
| 15907 Sugar Hill Dr Unit 15907 Punta Gorda, FL | 3.0 | 3.0 | 2247 | $9,500 | $4.23 | 23d | 1 | 1.32mi |
| 15951 Grassland Ln #3821 Punta Gorda, FL | 2.0 | 2.0 | 2110 | $8,800 | $4.17 | 23d | 1 | 1.34mi |
| 43030 Greenway Blvd Punta Gorda, FL | 2.0 | 2.0 | 1184 | $5,500 | $4.65 | 15d | 2 | 1.34mi |
| 43031 Greenway Blvd #1014 Punta Gorda, FL | 2.0 | 2.0 | 1366 | $6,000 | $4.39 | 23d | 1 | 1.36mi |
| 15943 Grassland Ln #3912 Punta Gorda, FL | 3.0 | 2.0 | 1741 | $8,800 | $5.05 | 23d | 1 | 1.36mi |
| 43038 Parkside Ct Punta Gorda, FL | 3.0 | 2.0 | 1677 | $2,500 | $1.49 | 23d | 1 | 1.37mi |
| 15960 Grassland Ln #2714 Punta Gorda, FL | 2.0 | 2.0 | 1366 | $2,800 | $2.05 | 23d | 1 | 1.39mi |
| 15960 Grassland Ln #2713 Punta Gorda, FL | 2.0 | 2.0 | 1569 | $7,500 | $4.78 | 23d | 1 | 1.39mi |
| 15960 Grassland Ln #2727 Punta Gorda, FL | 2.0 | 2.0 | 1422 | $6,000 | $4.22 | 23d | 1 | 1.39mi |
| 15960 Grassland Ln #2721 Punta Gorda, FL | 2.0 | 2.0 | 1569 | $5,500 | $3.51 | 23d | 1 | 1.39mi |
| 43021 Greenway Blvd #1115 Punta Gorda, FL | 2.0 | 2.0 | 1355 | $2,600 | $1.92 | 23d | 1 | 1.40mi |
| 43981 Boardwalk Loop #2222 Punta Gorda, FL | 2.0 | 2.0 | 1154 | $4,900 | $4.25 | 23d | 1 | 1.40mi |
| 43981 Boardwalk Loop #2232 Punta Gorda, FL | 2.0 | 2.0 | 1154 | $5,000 | $4.33 | 23d | 1 | 1.40mi |
| 43020 Greenway Blvd Punta Gorda, FL | 2.0–3.0 | 2.0 | 1243 | $6,500 | $5.23 | 15d | 7 | 1.40mi |
| 15919 Grassland Ln #4211 Punta Gorda, FL | 3.0 | 2.0 | 1741 | $8,800 | $5.05 | 23d | 1 | 1.42mi |
| 43011 Greenway Blvd #1225 Punta Gorda, FL | 2.0 | 2.0 | 1355 | $6,000 | $4.43 | 23d | 1 | 1.44mi |
| 15980 Grassland Ln Punta Gorda, FL | 2.0 | 2.0 | 1467 | $6,625 | $4.51 | 23d | 2 | 1.44mi |
| 15970 Grassland Ln Punta Gorda, FL | 2.0 | 2.0 | 1476 | $6,250 | $4.23 | 23d | 2 | 1.44mi |
| 43010 Greenway Blvd Punta Gorda, FL | 2.0 | 2.0 | 1145 | $6,300 | $5.50 | 23d | 2 | 1.45mi |
| 15405 Green Acres Ave #2327 , FL | 2.0 | 2.0 | 1154 | $4,500 | $3.90 | 15d | 1 | 1.47mi |
| 15405 Green Acres Ave Unit 2322 Punta Gorda, FL | 2.0 | 2.0 | 1150 | $4,000 | $3.48 | 23d | 1 | 1.47mi |
HOA detail
- Monthly dues
- $418 · $5,016/yr
- Likely covers
- watergassecurity
Listing history 4 events
-
2026-05-12status Pending
-
2026-05-12$301,990 Active
-
2025-08-25soldstatus $765,881
-
2025-04-17soldstatus $12,336,900
ⓘ Source: listings_history table (triggers on properties + properties_extension) + one-shot
backfill from property_details.listing_events for pre-trigger history.
Tax reassessment forecast FL · Resets to sale price
- Current annual tax
- $3,046 · $254/mo
- Projected year-2 tax
- $3,046 · $254/mo
- Expected delta
- $0/yr ($0/mo · 0.0%)
ⓘ Screening estimate from a state-policy table — verify with the county assessor before closing.
Nearby sold comps map
Loading sold comps map…
Walkable amenities ~0.75 mi
Loading nearby amenities…
Taxation est. · year 1
- Rental income
- $32,182
- − Mortgage interest
- −$16,916
- − Property taxes
- −$3,046
- − Insurance
- −$1,510
- − Repairs & maintenance
- −$2,575
- − Management
- −$2,575
- − HOA
- −$5,016
- − Depreciation
- −$8,785
- Taxable loss
- −$8,240
- Est. tax savings @ 24.0%
- +$1,978
- After-tax cash flow
- $-1,174/yr
For passive investors: Depreciation is non-cash, so a rental often shows a tax loss while cash-flowing — sheltering income. Rental losses are passive: they offset passive income freely, and up to $25,000/yr can offset ordinary (W-2) income if you actively participate and your MAGI is under $100k (phasing out to $0 by $150k); unused losses carry forward. On sale, claimed depreciation is recaptured at up to 25%, and gains may owe capital-gains tax (a 1031 exchange can defer both). Figures are a year-1 estimate at your 24.0% rate — not tax advice; consult a CPA.
Schools (NCES district)
- District
- Charlotte
- NCES district ID
- 1200240
- Math proficiency
- 54% ▼ -6.00%
- Reading proficiency
- 54% ▼ -1.00%
- Median HH income
- $44,864
- Composite
- 45.62/100
- National rank
- #2586
- State rank
- #22 of 73 in FL
Livability — North Fort Myers
- Score
- 74/100
- State rank
- #269
- US rank
- #4409
Category grades
Schools grade is shown separately in the Schools card above.
Census & demographics
- County
- Charlotte County · 196,994 people
- City population
- 57,035
- Metro
- Punta Gorda, FL
- Population (ZIP)
- 13,006
- Household income
- $72,443
- Rent vs Own
- Severe rent burden
- 43.0
Population outlook (Charlotte County) Hauer SSP2
- Today (2025)
- 198,646 people
- By 2030
- 210,507 · +6.0%
- By 2040
- 230,857 · +16.2%
- By 2050
- 247,148 · +24.4%
- By 2075
- 281,777 · +41.8%
- By 2100
- 293,609 · +47.8%
Race, ethnicity, and origin ACS 2023
- Neighborhood character
- Predominantly White (81%)
- Race & ethnicity
- White 81% Two or more races 8% Hispanic / Latino 7% Black 7%
- Hispanic origin (detail)
- Puerto Rican 2% Cuban 3%
- Common ancestry
- Lithuanian 3% Iranian 3% Slovak 3%
- Foreign-born
- 6% · Canada, Jamaica
- Languages at home
- 93% English-only · Spanish 5% German/W. Germanic 1% Arabic 1%
Political lean MEDSL · Charlotte
- 2024 margin
- Solid R (+34.0) · D 32.7% · R 66.7%
- 2008→2024 swing
- -26.7pp toward R · 2008: -7.2pp · 2024: -34.0pp
- All cycles
- 2024: R+34.0 2020: R+26.6 2016: R+27.8 2012: R+14.3 2008: R+7.2
Not yet ingested
- Civics
- —
Market trends
- HPI YoY
- ▼ -5.25%
- Current HPI
- 448.5895
- Rent YoY
- ▲ 4.13%
- Metro
- Punta Gorda, FL
- State GDP YoY
- ▲ 3.28%
- F500 in state
- 36
Industry mix (Fortune 500 HQ in FL)
| Industry | F500 HQs | Revenue |
|---|---|---|
| Industrial Technology | 2 | $29B |
|
||
| Insurance | 2 | $17B |
|
||
| Retail | 1 | $60B |
|
||
| Technology Distribution | 1 | $58B |
|
||
| Homebuilding | 1 | $35B |
|
||
| Technology Manufacturing | 1 | $35B |
|
||
Price history
-97.6% since first listed4 events — show timeline
- 2026-05-12 Pending — Stellar MLS as Distributed by MLS Grid
- 2026-05-12 Listed $301,990 Stellar MLS as Distributed by MLS Grid
- 2025-08-25 Sold (Public Records) $765,881 Public Records
- 2025-04-17 Sold (Public Records) $12,336,900 Public Records
Property tax history
+4.4%/yrLatest (2025): $3,046 · +4.4% YoY. Source: county tax records.
Cash-flow waterfall
monthlySold comps — $/sqft
last 12 mo · ≤1 miLoading sold comps…