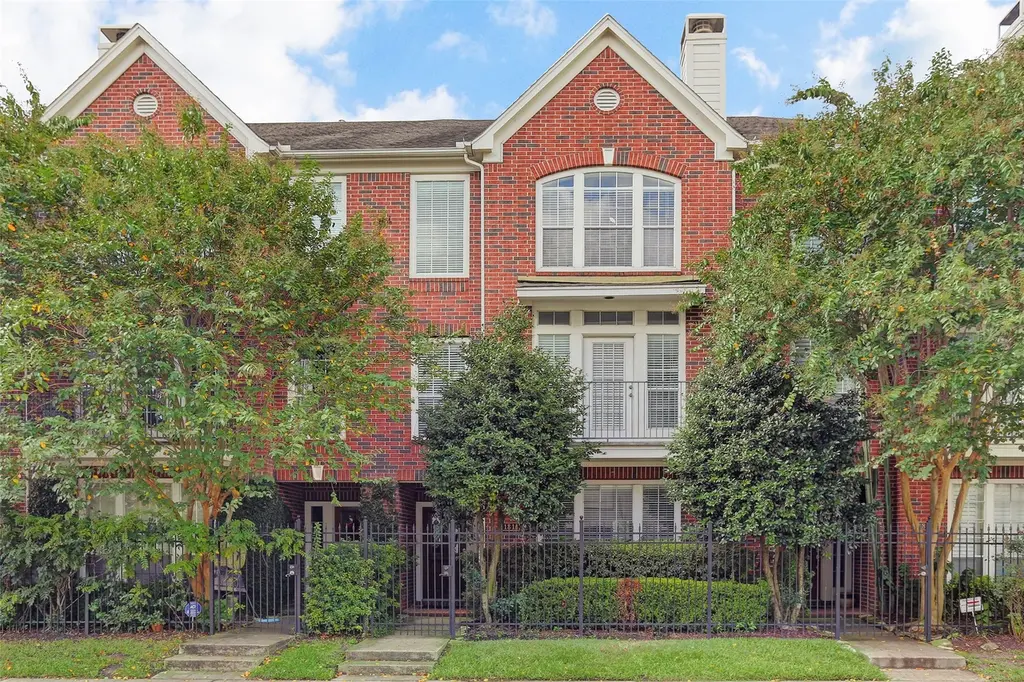
1814 Matthews St · Houston, TX
Flood risk 1/10 · Minimal
- FEMA flood zone
- X (unshaded)
- Chance of flooding over 30 yrs
- 0.0%
- Est. flood insurance / yr
- $507 – $1,088
Fire risk 1/10 · Minimal
- Est. fire insurance / yr
- $1,222 – $2,270
Heat risk 9/10 · Severe
- Hot days now (above 109°F)
- 7 days/yr
- Hot days in 30 yrs
- 24 days/yr
Wind risk 9/10 · Severe
- Chance of severe wind over 30 yrs
- 99.0%
Air-quality risk 3/10 · Minor
- Unhealthy air days now
- 2 days/yr
- Unhealthy air days in 30 yrs
- 3 days/yr
Risk factors via First Street. Map © Google.
Why this score? — see what drove the D+ grade
The composite is a weighted blend of 9 inputs, each scored 0–100. Each bar is that input's sub-score; the figure is the points it added to the 100-point composite (weight × sub-score).
- Cash flow +16.7/30.0
- ARV discount +8.3/15.0
- 1% rule +5.7/10.0
- DSCR +5.2/10.0
- Livability +3.7/5.0
- Schools +2.7/10.0
- Condition / age +2.5/5.0
- Rent growth +2.3/5.0
- Appreciation +0.0/10.0
$449,000
🖨 Deal sheet (PDF) 📄 Offer letter ✓ Due diligence
Listing remarks
Welcome home to 1814 Matthews Street, a sophisticated three-bedroom townhome offering nearly 2,800 square feet of expansive, light-filled living space. The interior is bathed in abundant natural light, beautifully highlighting the rich updated hardwood flooring that flows seamlessly throughout the main living areas. Perfectly situated for both leisure and convenience, this residence features a private, gated front green space and an attached two-car garage, with ample community and street parking available for guests. Enjoy the ultimate urban lifestyle just two blocks from local parks and dog parks, moments from the iconic Buffalo Bayou Park, and minutes from Downtown, Midtown, and the Texa
Key facts
- $182 HOA
- 2 garage spots
- Built 2001
Property features AI
Finance
- Other: Lease not considered
- HOA & community: Sutton Square Community Association; Association provides trash service; Annual association fee (amount listed separately) includes common areas, water, and sewer
Exterior
- Parking: Attached 2-car garage; Additional parking; Garage door opener
- Utilities: Public water; Public sewer
- Home design: Residential property; 3 stories; Full ownership; Slab foundation; Built in 2001
- Construction: Brick and cement siding
- Exterior features: East-facing; Composition roof
Interior
- Kitchen: Dishwasher; Disposal; Gas oven; Gas range; Microwave; Oven; Refrigerator; Kitchen/dining combo
- Bedrooms: Primary bedroom (third level); Bedroom (first level); Bedroom (third level)
- Flooring: Carpet; Tile; Wood
- Bathrooms: 3 full bathrooms; 1 half bathroom
- Heating & cooling: Central heating (gas); Central air; Electric cooling; Attic fan
- Interior features: Gas-log fireplace; Multiple staircases; Separate shower; Ceiling fans; Kitchen/dining combo; Living/dining room
- Laundry & utility: Washer; Dryer; Utility room (third level)
Neighborhood map
What this means for you Summary
Snapshot
- This is a 3-bed/3.5-bath townhouse listed at $449k.
Deal economics
- At list price, monthly cash flow is $280 ($3k/yr) — positive.
- The deal already cash-flows at list — no discount required.
- Meets the 1% rule at list price ($5k rent vs $449k).
- Recommended offer: $436k (3.0% below list) — sets the bar for market timing.
- Cap rate 7.0% vs local median 3.2% in Houston — top-decile yield for the area; either an underpriced asset or a hidden risk that comps aren't pricing in. Stress-test before assuming the spread holds.
Location & tenants
- Location reads 74/100 on livability (#184 in TX, #4,771 nationally) — a middle-class / working-renter tenant base. Strengths: amenities A+, cost of living A+, housing A+; Watch: crime F.
- Houston ISD (urban): math 27% / reading 35% proficiency, ranked #593 of 826 in TX (top 72%) — families likely to look elsewhere, expect single-tenant / working-renter base with shorter leases; 71% free/reduced lunch — lower-income household profile, screen leases tightly.
- Zoned schools: Gregory-Lincoln Ed Ctr (math 14% / reading 30%, grade F, #3,333 of 4,322 statewide, top 80%, 600 students, 93% FRL); Heights H S (math 27% / reading 57%, grade F, #730 of 1,632 statewide, top 47%, 2,476 students, 65% FRL).
- Market conditions: Rents soft (-0.9%/yr); 260 active listings in the ZIP; 40 comparable units currently listed for rent nearby; rentals at typical pace (median 16d on market — plan ~3-4 weeks tenant-placement turnaround); high-income renter base; 29,883 units permitted in Harris County in 2024 (8,621 in 5+ unit buildings).
- At $4,818/mo this rent would consume 50% of the median local household income ($116k/yr) (locally 1844% of renters already pay >50% of income on rent) — very limited rent-growth headroom before tenants either downsize or default.
Forward outlook
- Local home prices are declining (-3.0%/yr); year-one equity from $3k of loan paydown is wiped out by about $13k of value loss. Plan a longer hold.
- Harris County population projected at +47% by 2050 — long-run rental-demand tailwind backs the buy-and-hold thesis.
Negotiation context
- It's been on market 33 days — a 3% lower offer ($436k) is reasonable based on typical stale-listing flexibility.
- 3 sale attempts since 25y ago with the ask held roughly flat each time — persistent listings suggest the price (not the market) is what's stuck; bring a comps-based counter.
Risks & watch-outs
- Climate carrying-cost: severe wind risk, 99% chance of damaging wind over 30y; extreme-heat days projected 7→24/yr by 2055 (HVAC capex compounding) — expect insurance premiums to compound above CPI over the hold.
Questions for the listing agent
- It's been on market 33 days. Have you received any prior offers? Is the seller open to a 3% concession, seller financing, or rate buy-down credit?
- What does the HOA fee cover, when was the last increase, and are there any pending special assessments or reserve-fund shortfalls?
- Is there a deadline driving the sale (1031 exchange, divorce, estate, relocation)? That informs how much negotiation room exists.
- Schools are D-rated, which usually means shorter tenancies and higher turnover. Who's the typical renter profile here, and what's been the actual vacancy rate?
- Crime grade is F in this area — have there been break-ins, vandalism, or insurance claims at this property in the last 3 years? What carrier currently insures it and at what premium?
- The area grade is low — what's the realistic commute time and amenity access for the typical tenant pool here? Any planned neighborhood developments (good or bad) we should know about?
- What's the average days-on-market for RENTAL listings here right now (not sales)? A rising rental-DOM trend means longer vacancies and softer asking-rent achievability than the comps imply.
- What's the recent tenant-quality profile in this submarket — average credit score on applications, eviction rate, late-payment / NSF rate, and stable-employment percentage? A property-management company in the area should have these aggregated.
- How much new for-sale + rental construction is in the pipeline within 1–3 miles? Heavy new supply typically softens prices + rents 12–24 months out; constrained supply supports both.
Investment metrics
- 1% rule
- 1.07% ✓
- Cap rate
- 7.04%
- Cash-on-cash
- 2.67%
- DSCR
- 1.12
- GRM
- 7.8
CMA / ARV
- ARV (median comp)
- $457,378
- List price
- $449,000
- Delta
- -1.83%
- Verdict
- FAIR
- Comps
- 20 within 1.0 mi
Show comp detail 12 sales within ~0.75 mi
| Address | Dist | Beds/Ba | Sqft | Sold | Price | $/sf | Match |
|---|---|---|---|---|---|---|---|
| 208 Bremond St | 0.17mi | 3/3.5 | 2,812 (+0%) | 2mo | $469,000 | $167 | 89 |
| 1429 Oneil St | 0.08mi | 3/3.5 | 2,536 (-9%) | 4mo | $390,000 | $154 | 78 |
| 1310 W Dallas St | 0.40mi | 3/3.5 | 2,650 (-5%) | 2mo | $500,000 | $189 | 71 |
| 2810 Helena St | 0.30mi | 3/3.0 | 2,610 (-7%) | 5mo | $449,500 | $172 | 69 |
| 2404 Fairview Ave Unit C | 0.48mi | 3/3.5 | 2,715 (-3%) | 5mo | $465,000 | $171 | 68 |
| 717 Welch St | 0.56mi | 3/3.5 | 2,719 (-3%) | 1mo | $540,000 | $199 | 68 |
| 1316 W Dallas St | 0.40mi | 3/3.0 | 2,650 (-5%) | 5mo | $575,000 | $217 | 66 |
| 615 W Bell St | 0.50mi | 3/3.5 | 2,548 (-9%) | 2mo | $665,000 | $261 | 60 |
| 301 W Polk St | 0.41mi | 3/3.5 | 3,208 (+15%) | 1mo | $775,000 | $242 | 55 |
| 1210 Crocker St | 0.62mi | 3/2.5 | 2,577 (-8%) | 6mo | $599,999 | $233 | 49 |
| 3300 Taft St Unit B | 0.67mi | 3/3.5 | 3,150 (+12%) | 1mo | $649,000 | $206 | 47 |
| 1004 Stanford St Unit A | 0.62mi | 2/2.5 (-1) | 2,563 (-8%) | 6mo | $499,000 | $195 | 43 |
Match score weights: distance 35% · size 25% · config 20% · recency 20%. Top-matched comps best support the ARV.
Projected returns pro-forma
-3.0% appreciation · 0.0% rent growth · sell at horizon
- IRR
- -15.9%
- Equity multiple
- 0.45×
- Total profit
- $-68,730
- Equity at exit
- $66,947
- IRR
- -14.8%
- Equity multiple
- 0.28×
- Total profit
- $-90,127
- Equity at exit
- $38,821
Cash invested: $125,720 (down + closing). Projections, not guarantees.
Landlord ↔ Tenant lean methodology
- Overall (STATE)
- 87 Strongly Landlord-Friendly
- State Texas
- 87 Strongly Landlord-Friendly · R+5
- County
- — inherits STATE
- City
- — inherits STATE
ZIP-level market 77019
- Rents YoY
- -0.9%
- Active inventory
- 260
- Price-to-rent
- 7.8×
Monthly cashflow live
- Estimated rent
- $4,818 high interval (Pro) →
- Mortgage (P&I)
- −$2,355
- Tax from tax record
- −$803 /mo · $9,636/yr
- Insurance
- −$187
- HOA
- −$182
- Vacancy / Maint / Mgmt
- −$1,012
- Net cashflow
- $280
Break-even live
Sensitivity live
| Price | -10% $534 | -5% $407 | +0% $280 | +5% $153 | +10% $26 |
|---|---|---|---|---|---|
| Rent | -10% $-101 | -5% $89 | +0% $280 | +5% $470 | +10% $660 |
| Rate | -1.0pp $506 | -0.5pp $394 | base $280 | +0.5pp $163 | +1.0pp $45 |
UW: 25.0% down · 7.5% · 30yr · 1.5% tax · 5.0% vac · 8.0% maint · 8.0% mgmt
Financing live
Cash to close
- Down payment
- $112,250
- Closing costs
- $13,470
- Reserves months
- —
- Total cash needed
- —
Loan-product check · same deal, 3 products live
Conventional
25% down · 7.5% · 30yr
- Down + closing
- —
- Monthly P&I
- —
- Monthly cashflow
- —
- DSCR
- —
- Eligible?
- —
Personal DTI + credit; lowest rate.
DSCR
20% down · 8.5% · 30yr
- Down + closing
- —
- Monthly P&I
- —
- Monthly cashflow
- —
- DSCR
- —
- Eligible?
- —
No personal income docs; deal must DSCR.
Hard money
10% down · 12.0% · 12mo
- Down + closing
- —
- Monthly P&I
- —
- Monthly cashflow
- —
- DSCR
- —
- Eligible?
- —
Short-term bridge; refi at stabilization.
Rent comps 40 comps
| Address | Beds | Baths | Sqft | Rent | $/sqft | DOM | Units | Dist |
|---|---|---|---|---|---|---|---|---|
| 328 Bomar St Houston, TX | 3.0 | 3.5 | 2688 | $5,300 | $1.97 | 23d | 1 | 0.33mi |
| 414 Hyde Park Blvd Houston, TX | 3.0 | 3.5 | 2300 | $5,200 | $2.26 | 1d | 1 | 0.47mi |
| 420 Hawthorne St Houston, TX | 4.0 | 2.0 | 2230 | $3,373 | $1.51 | 45d | 1 | 0.68mi |
| 710 Stanford St Houston, TX | 3.0 | 4.0 | 2438 | $3,490 | $1.43 | 45d | 1 | 0.69mi |
| 1118 Columbus St Unit A Houston, TX | 3.0 | 3.5 | 2338 | $3,000 | $1.28 | 45d | 1 | 0.70mi |
| 1211 Marconi St Houston, TX | 4.0 | 3.5 | 3020 | $4,500 | $1.49 | 45d | 1 | 0.76mi |
| 3300 Main St Unit 3165 Houston, TX | 3.0 | 2.0 | 2861 | $7,453 | $2.61 | 0d | 1 | 0.78mi |
| 3300 Main St Unit 3333 Houston, TX | 3.0 | 2.0 | 2861 | $7,493 | $2.62 | 12d | 1 | 0.78mi |
| 1326 Fairview Ave Houston, TX | 3.0 | 3.0 | 2176 | $3,250 | $1.49 | 45d | 1 | 0.87mi |
| 2721 Austin St Houston, TX | 3.0 | 4.0 | 2607 | $3,000 | $1.15 | 26d | 1 | 0.90mi |
| 2416 La Branch St Houston, TX | 3.0 | 4.0 | 2540 | $2,900 | $1.14 | 45d | 1 | 0.91mi |
| 3411 Yoakum Blvd Unit 3165 Houston, TX | 3.0 | 2.0 | 3110 | $12,264 | $3.94 | 0d | 1 | 0.98mi |
| 3411 Yoakum Blvd Unit 510 Houston, TX | 3.0 | 2.0 | 3110 | $12,304 | $3.96 | 12d | 1 | 0.98mi |
| 2205 Commonwealth St Houston, TX | 4.0 | 4.0 | 2513 | $3,300 | $1.31 | 45d | 1 | 0.98mi |
| 2809 Crawford St Houston, TX | 2.0 | 2.0 | 1928 | $2,600 | $1.35 | 45d | 1 | 1.03mi |
| 3131 Memorial Ct Houston, TX | 2.0 | 1.0–2.5 | 1336 | $3,346 | $2.50 | 0d | 31 | 1.04mi |
| 4001 Fannin St Houston, TX | 3.0 | 1.0–3.0 | 1536 | $3,158 | $2.06 | 0d | 18 | 1.12mi |
| 3010 Chenevert St Unit 3010 Houston, TX | 3.0 | 3.5 | 3203 | $8,000 | $2.50 | 45d | 1 | 1.13mi |
| 3010 Chenevert St Unit 1019638P Houston, TX | 3.0 | 3.5 | 3196 | $7,988 | $2.50 | 9d | 1 | 1.13mi |
| 1406 McKinney St Houston, TX | 2.0 | 2.0 | 1987 | $5,075 | $2.55 | 26d | 1 | 1.20mi |
| 1400 McKinney St Houston, TX | 1.0–2.0 | 1.0–2.5 | 2166 | $12,100 | $5.59 | 0d | 9 | 1.20mi |
| 1501 Hawthorne St Houston, TX | 2.0 | 1.0 | 3341 | $1,525 | $0.46 | 45d | 1 | 1.23mi |
| 909 Texas Ave Houston, TX | 2.0 | 1.0–2.0 | 1262 | $3,129 | $2.48 | 3d | 36 | 1.25mi |
| 915 Texas Ave Unit 420 Houston, TX | 3.0 | 2.0 | 2366 | $4,655 | $1.97 | 45d | 1 | 1.26mi |
| 915 Texas Ave Unit 420 Houston, TX | 3.0 | 2.0 | 2366 | $4,655 | $1.97 | 20d | 1 | 1.26mi |
| 414 Milam St Unit 447 Houston, TX | 3.0 | 2.0 | 2421 | $8,991 | $3.71 | 12d | 1 | 1.26mi |
| 414 Milam St Unit 447 Houston, TX | 3.0 | 2.0 | 2421 | $8,973 | $3.71 | 45d | 1 | 1.26mi |
| 414 Milam St Unit 510 Houston, TX | 3.0 | 2.0 | 2421 | $9,230 | $3.81 | 15d | 1 | 1.26mi |
| 414 Milam St Unit 3165 Houston, TX | 3.0 | 2.0 | 2421 | $8,951 | $3.70 | 0d | 1 | 1.26mi |
| 2326 St Emanuel St Houston, TX | 3.0 | 3.5 | 2642 | $2,601 | $0.98 | 9d | 1 | 1.28mi |
| 414 Milam St Ph 2-4602 Houston, TX | 2.0 | 2.0 | 2158 | $8,990 | $4.17 | 45d | 1 | 1.29mi |
| 2521 Saint Emanuel St Unit 1047945P Houston, TX | 3.0 | 3.0 | 2292 | $2,727 | $1.19 | 0d | 1 | 1.31mi |
| 2519 Saint Emanuel St Unit 1241246P Houston, TX | 3.0 | 3.0 | 2389 | $2,621 | $1.10 | 0d | 1 | 1.31mi |
| 2103 McGowen St Unit 1244937P Houston, TX | 3.0 | 3.5 | 2292 | $4,732 | $2.06 | 0d | 1 | 1.33mi |
| 2107 McGowen St Unit 1244935P Houston, TX | 3.0 | 3.5 | 2497 | $4,711 | $1.89 | 4d | 1 | 1.33mi |
| 2109 McGowen St Unit 1244934P Houston, TX | 3.0 | 3.5 | 2497 | $4,245 | $1.70 | 0d | 1 | 1.33mi |
| 808 Crawford St Houston, TX | 1.0–3.0 | 1.0–3.5 | 1740 | $12,645 | $7.27 | 0d | 27 | 1.33mi |
| 2105 McGowen St Unit 1244936P Houston, TX | 3.0 | 3.5 | 2497 | $4,371 | $1.75 | 0d | 1 | 1.33mi |
| 3213 Saint Emanuel St Houston, TX | 4.0 | 3.5 | 2100 | $3,300 | $1.57 | 18d | 1 | 1.40mi |
| 1475 Texas St Houston, TX | 3.0 | 1.0–2.0 | 1304 | $6,350 | $4.87 | 45d | 28 | 1.41mi |
HOA detail
- Monthly dues
- $182 · $2,184/yr
- Likely covers
- security
Listing history 21 events
-
2026-06-21days on market $449,000 Active 33 DOM
-
2026-06-18days on market $449,000 Active 30 DOM
-
2026-06-17days on market $449,000 Active 29 DOM
-
2026-06-16days on market $449,000 Active 28 DOM
-
2026-06-15days on market $449,000 Active 27 DOM
-
2026-06-13days on market $449,000 Active 25 DOM
-
2026-06-10days on market $449,000 Active 21 DOM
-
2026-06-08days on market $449,000 Active 20 DOM
-
2026-06-07days on market $449,000 Active 19 DOM
-
2026-06-04days on market $449,000 Active 16 DOM
-
2026-06-01days on market $449,000 Active 13 DOM
-
2026-05-31days on market $449,000 Active 12 DOM
-
2026-05-15historical $449,000 786-char remark
-
2020-10-17historical
-
2020-10-17price $449,900
-
2020-09-02price $399,900
-
2020-08-14price $409,990
-
2020-08-03$429,900 Active
-
2002-05-31soldstatus
-
2002-03-26historical
-
2001-12-06$299,000
ⓘ Source: listings_history table (triggers on properties + properties_extension) + one-shot
backfill from property_details.listing_events for pre-trigger history.
Tax reassessment forecast TX · Resets to sale price
- Current annual tax
- $9,636 · $803/mo
- Projected year-2 tax
- $9,636 · $803/mo
- Expected delta
- $0/yr ($0/mo · 0.0%)
ⓘ Screening estimate from a state-policy table — verify with the county assessor before closing.
Climate risk First Street
- Flood 1/10 Low FEMA zone X (unshaded) · 0% chance over 30 yrs
- Wildfire 1/10 Low
- Heat 9/10 Extreme 7 d/yr ≥109°F today · 24 d/yr by 30 yrs out
- Wind 9/10 Extreme 99% chance of damaging wind over 30 yrs
- Air quality 3/10 Moderate 2 unhealthy d/yr today · 3 by 30 yrs out
Nearby sold comps map
Loading sold comps map…
Walkable amenities ~0.75 mi
Loading nearby amenities…
Taxation est. · year 1
- Rental income
- $57,818
- − Mortgage interest
- −$25,151
- − Property taxes
- −$9,636
- − Insurance
- −$2,245
- − Repairs & maintenance
- −$4,625
- − Management
- −$4,625
- − HOA
- −$2,184
- − Depreciation
- −$13,062
- Taxable loss
- −$3,710
- Est. tax savings @ 24.0%
- +$890
- After-tax cash flow
- $4,247/yr
For passive investors: Depreciation is non-cash, so a rental often shows a tax loss while cash-flowing — sheltering income. Rental losses are passive: they offset passive income freely, and up to $25,000/yr can offset ordinary (W-2) income if you actively participate and your MAGI is under $100k (phasing out to $0 by $150k); unused losses carry forward. On sale, claimed depreciation is recaptured at up to 25%, and gains may owe capital-gains tax (a 1031 exchange can defer both). Figures are a year-1 estimate at your 24.0% rate — not tax advice; consult a CPA.
Schools (NCES district)
- District
- Houston ISD
- NCES district ID
- 4823640
- Math proficiency
- 27% ▼ -18.00%
- Reading proficiency
- 35% ▼ -6.00%
- Median HH income
- $46,054
- Composite
- 26.63/100
- National rank
- #7173
- State rank
- #593 of 826 in TX
Livability — Houston
- Score
- 74/100
- State rank
- #184
- US rank
- #4771
Category grades
Schools grade is shown separately in the Schools card above.
Census & demographics
- Census place
- Houston, TX
- County
- Harris County · 4,702,590 people
- City population
- 3,226,434
- Metro
- Houston-The Woodlands-Sugar Land, TX
- Population (ZIP)
- 23,708
- Household income
- $116,423
- Rent vs Own
- Severe rent burden
- 1844.0
Population outlook (Harris County) Hauer SSP2
- Today (2025)
- 5,571,493 people
- By 2030
- 6,089,821 · +9.3%
- By 2040
- 7,142,806 · +28.2%
- By 2050
- 8,185,864 · +46.9%
- By 2075
- 10,574,329 · +89.8%
- By 2100
- 12,109,958 · +117.4%
Race, ethnicity, and origin ACS 2023
- Neighborhood character
- Diverse neighborhood (Simpson 0.62)
- Race & ethnicity
- White 57% Hispanic / Latino 18% Two or more races 13% Asian 10% Black 9%
- Hispanic origin (detail)
- Mexican 12% Salvadoran 1%
- Common ancestry
- Lithuanian 4% Romanian 2% Slovak 2%
- Foreign-born
- 17% · Canada, China, Vietnam
- Languages at home
- 77% English-only · Spanish 11% Other Indo-European 4% Chinese 1%
Political lean MEDSL · Harris
- 2024 margin
- Lean D (+5.5) · D 52.0% · R 46.4% · Other 1.6%
- 2008→2024 swing
- +3.9pp toward D · 2008: 1.6pp · 2024: 5.5pp
- All cycles
- 2024: D+5.5 2020: D+13.3 2016: D+12.4 2012: D+0.1 2008: D+1.6
Not yet ingested
- Civics
- —
Market trends
- HPI YoY
- ▼ -131.69%
- Current HPI
- 179.271
- Rent YoY
- ▼ -0.95%
- Metro
- Houston-The Woodlands-Sugar Land, TX
- State GDP YoY
- ▲ 3.95%
- F500 in state
- 110
Industry mix (Fortune 500 HQ in TX)
| Industry | F500 HQs | Revenue |
|---|---|---|
| Energy | 16 | $1,198B |
|
||
| Technology | 5 | $198B |
|
||
| Engineering / Construction | 4 | $72B |
|
||
| Energy Services | 3 | $60B |
|
||
| Utilities | 3 | $41B |
|
||
| Healthcare | 2 | $330B |
|
||
Price history
+50.2% since first listed10 events — show timeline
- 2026-05-19 Listed $449,000 HARMLS
- 2026-05-15 Coming Soon $449,000 HARMLS
- 2020-10-17 Listing Removed — HARMLS
- 2020-10-17 Price Changed $449,900 HARMLS
- 2020-09-02 Price Changed $399,900 HARMLS
- 2020-08-14 Price Changed $409,990 HARMLS
- 2020-08-03 Listed $429,900 HARMLS
- 2002-05-31 Sold (Public Records) — Public Records
- 2002-03-26 Listing Removed — HARMLS
- 2001-12-06 Listed $299,000 HARMLS
Property tax history
+0.4%/yrLatest (2025): $9,636 · +8.4% YoY. Source: county tax records.
Cash-flow waterfall
monthlySold comps — $/sqft
last 12 mo · ≤1 miLoading sold comps…