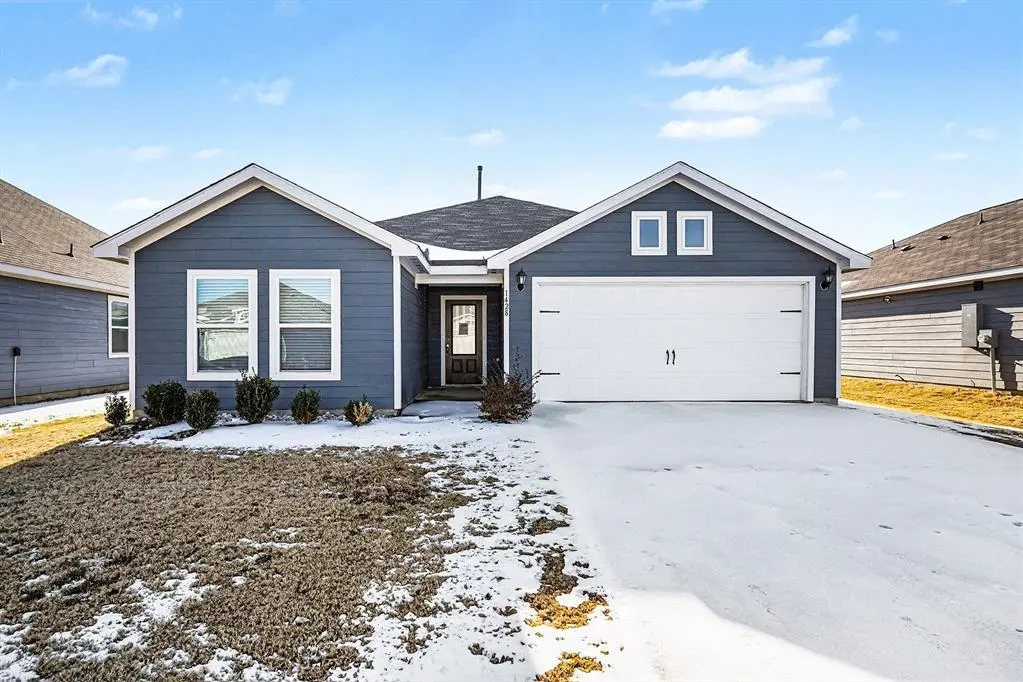
1428 Palamedes Dr · Fort Worth, TX
Flood risk 1/10 · Minimal
- FEMA flood zone
- X (unshaded)
- Chance of flooding over 30 yrs
- 0.0%
- Est. flood insurance / yr
- $507 – $1,088
Fire risk 3/10 · Minor
- Est. fire insurance / yr
- $1,222 – $2,270
Heat risk 8/10 · Major
- Hot days now (above 110°F)
- 7 days/yr
- Hot days in 30 yrs
- 26 days/yr
Wind risk 6/10 · Moderate
- Chance of severe wind over 30 yrs
- 27.0%
Air-quality risk 3/10 · Minor
- Unhealthy air days now
- 2 days/yr
- Unhealthy air days in 30 yrs
- 3 days/yr
Risk factors via First Street. Map © Google.
Why this score? — see what drove the D- grade
The composite is a weighted blend of 9 inputs, each scored 0–100. Each bar is that input's sub-score; the figure is the points it added to the 100-point composite (weight × sub-score).
- ARV discount +13.4/15.0
- Cash flow +7.8/30.0
- Livability +4.0/5.0
- 1% rule +3.2/10.0
- Rent growth +2.5/5.0
- Condition / age +2.5/5.0
- Schools +2.3/10.0
- DSCR +1.9/10.0
- Appreciation +0.0/10.0
$259,900
🖨 Deal sheet 📄 Offer letter ✓ Due diligence
Listing remarks MLS
This 3-bedroom, 2-bathroom home, built in 2022, offers the sleek efficiency and pristine condition of nearly new construction. The interior features a modern, open-concept layout with contemporary finishes and updated systems throughout, ensuring a completely move-in-ready experience with no updates or repairs required. With its generous bedroom count and clean architectural lines, this residence provides a fresh, turn-key foundation for a buyer seeking a low-maintenance lifestyle and the reliability of a recent build.
Key facts
- 5,619 sq ft lot
- 2 garage spots
- Built 2022
Neighborhood map
What this means for you Summary
Snapshot
- This is a 3-bed/2.0-bath single-family listed at $260k.
Deal economics
- At list price, monthly cash flow is $-285 ($-3k/yr) — negative.
- To cash-flow at today's rent, offer at most $209k (19.4% below list).
- To meet the 1% rule (rent ≥ 1% of price), the offer needs to be $214k (17.8% below list).
- Recommended offer: $209k (19.4% below list) — sets the bar for cash-flow.
- Cap rate 5.0% vs local median 3.9% in Fort Worth — meaningfully above typical; check what's discounted (condition, days-on-market, listing class) to confirm the premium yield is real.
Location & tenants
- Location reads 80/100 on livability (#49 in TX, #1,954 nationally) — a professional / high-income tenant draw. Strengths: amenities A+, cost of living A+, housing A+; Watch: schools D+, crime F.
- Everman ISD (suburban): math 21% / reading 32% proficiency, ranked #691 of 826 in TX (top 84%) — low school quality limits family demand, transient renter base, plan for 1-2y turnover; 77% free/reduced lunch — lower-income household profile, screen leases tightly.
- Market conditions: Rents flat; 374 active listings in the ZIP; 40 comparable units currently listed for rent nearby; rentals leasing fast (median 13d on market — plan ~1-2 weeks tenant-placement turnaround); solid renter incomes; 18,938 units permitted in Tarrant County in 2024 (8,336 in 5+ unit buildings).
- This rent runs 34% of the median local income ($76k/yr) — at the standard rent-burdened threshold; future hikes will face affordability resistance.
Forward outlook
- Local home prices are declining (-3.0%/yr); year-one equity from $2k of loan paydown is wiped out by about $8k of value loss. Plan a longer hold.
- Tarrant County population projected at +41% by 2050 — long-run rental-demand tailwind backs the buy-and-hold thesis.
Negotiation context
- It's been on market 127 days — a 12% lower offer ($229k) is reasonable based on typical stale-listing flexibility.
Risks & watch-outs
- Climate carrying-cost: major wind risk, 27% chance of damaging wind over 30y; extreme-heat days projected 7→26/yr by 2055 (HVAC capex compounding) — expect insurance premiums to compound above CPI over the hold.
Questions for the listing agent
- What do current leases actually rent for vs. the listed asking? Can we see a recent rent roll and the last 12 months of T-12 income?
- It's been on market 127 days. Have you received any prior offers? Is the seller open to a 19% concession, seller financing, or rate buy-down credit?
- What does the HOA fee cover, when was the last increase, and are there any pending special assessments or reserve-fund shortfalls?
- Why hasn't it sold? Are there any deal-killer items the seller is aware of (foundation, flood, title, zoning, code violations)?
- Is there a deadline driving the sale (1031 exchange, divorce, estate, relocation)? That informs how much negotiation room exists.
- Schools are D-rated, which usually means shorter tenancies and higher turnover. Who's the typical renter profile here, and what's been the actual vacancy rate?
- Crime grade is F in this area — have there been break-ins, vandalism, or insurance claims at this property in the last 3 years? What carrier currently insures it and at what premium?
- The area grade is low — what's the realistic commute time and amenity access for the typical tenant pool here? Any planned neighborhood developments (good or bad) we should know about?
- What's the average days-on-market for RENTAL listings here right now (not sales)? A rising rental-DOM trend means longer vacancies and softer asking-rent achievability than the comps imply.
- What's the recent tenant-quality profile in this submarket — average credit score on applications, eviction rate, late-payment / NSF rate, and stable-employment percentage? A property-management company in the area should have these aggregated.
- How much new for-sale + rental construction is in the pipeline within 1–3 miles? Heavy new supply typically softens prices + rents 12–24 months out; constrained supply supports both.
Investment metrics
- 1% rule
- 0.82% ✗
- Cap rate
- 4.97%
- Cash-on-cash
- -4.71%
- DSCR
- 0.79
- GRM
- 10.1
CMA / ARV
- ARV (median comp)
- $298,911
- List price
- $259,900
- Delta
- -11.38%
- Verdict
- UNDERPRICED
- Comps
- 20 within 1.0 mi
Show comp detail 12 sales within ~0.75 mi
| Address | Dist | Beds/Ba | Sqft | Sold | Price | $/sf | Match |
|---|---|---|---|---|---|---|---|
| 1452 Palamedes Dr | 0.06mi | 4/2.0 (+1) | 1,726 (+8%) | 3mo | $254,900 | $148 | 77 |
| 9709 Dan Meyer Dr | 0.12mi | 4/2.0 (+1) | 1,726 (+8%) | 1mo | $285,000 | $165 | 76 |
| 1505 Harvester Dr | 0.27mi | 4/2.0 (+1) | 1,724 (+8%) | 2mo | $309,900 | $180 | 68 |
| 1405 Orange Tree Dr | 0.50mi | 4/2.0 (+1) | 1,657 (+3%) | 2mo | $297,990 | $180 | 64 |
| 1425 Orange Tree Dr | 0.49mi | 4/2.0 (+1) | 1,662 (+4%) | 3mo | $292,990 | $176 | 64 |
| 1604 Queens Brook Ct | 0.40mi | 3/2.0 | 1,439 (-10%) | 1mo | $249,900 | $174 | 63 |
| 1400 Orange Tree Dr | 0.66mi | 4/2.0 (+1) | 1,662 (+4%) | 1mo | $303,990 | $183 | 58 |
| 1421 Orange Tree Dr | 0.49mi | 4/2.0 (+1) | 1,477 (-8%) | 3mo | $281,990 | $191 | 57 |
| 10329 Kingspoint Blvd | 0.52mi | 4/2.0 (+1) | 1,767 (+10%) | 3mo | $299,999 | $170 | 52 |
| 1753 Leevon Ln | 0.63mi | 4/2.0 (+1) | 1,791 (+12%) | 1mo | $317,685 | $177 | 46 |
| 1749 Leevon Ln | 0.64mi | 4/2.0 (+1) | 1,834 (+14%) | 1mo | $322,685 | $176 | 40 |
| 10300 Station Ln | 0.71mi | 4/2.0 (+1) | 1,405 (-12%) | 2mo | $297,685 | $212 | 40 |
Match score weights: distance 35% · size 25% · config 20% · recency 20%. Top-matched comps best support the ARV.
Projected returns pro-forma
-3.0% appreciation · 0.11% rent growth · sell at horizon
- IRR
- -27.9%
- Equity multiple
- 0.09×
- Total profit
- $-66,193
- Equity at exit
- $38,752
- IRR
- -44.5%
- Equity multiple
- -0.43×
- Total profit
- $-103,865
- Equity at exit
- $22,471
Cash invested: $72,772 (down + closing). Projections, not guarantees.
Landlord ↔ Tenant lean methodology
- Overall (STATE)
- 87 Strongly Landlord-Friendly
- State Texas
- 87 Strongly Landlord-Friendly · R+5
- County
- — inherits STATE
- City
- — inherits STATE
ZIP-level market 76140
- Home prices YoY
- -21.8%
- Rents YoY
- 0.1%
- Active inventory
- 374
- Price-to-rent
- 10.1×
Monthly cashflow live
- Estimated rent
- $2,137 high interval (Pro) →
- Mortgage (P&I)
- −$1,363
- Tax from tax record
- −$466 /mo · $5,594/yr
- Insurance
- −$108
- HOA
- −$36
- Vacancy / Maint / Mgmt
- −$449
- Net cashflow
- $-285
Break-even live
UW: 25.0% down · 7.5% · 30yr · 1.5% tax · 5.0% vac · 8.0% maint · 8.0% mgmt
Financing live
Cash to close
- Down payment
- $64,975
- Closing costs
- $7,797
- Reserves months
- —
- Total cash needed
- —
Loan-product check · same deal, 3 products live
Conventional
25% down · 7.5% · 30yr
- Down + closing
- —
- Monthly P&I
- —
- Monthly cashflow
- —
- DSCR
- —
- Eligible?
- —
Personal DTI + credit; lowest rate.
DSCR
20% down · 8.5% · 30yr
- Down + closing
- —
- Monthly P&I
- —
- Monthly cashflow
- —
- DSCR
- —
- Eligible?
- —
No personal income docs; deal must DSCR.
Hard money
10% down · 12.0% · 12mo
- Down + closing
- —
- Monthly P&I
- —
- Monthly cashflow
- —
- DSCR
- —
- Eligible?
- —
Short-term bridge; refi at stabilization.
Rent comps 40 comps
| Address | Beds | Baths | Sqft | Rent | $/sqft | DOM | Units | Dist |
|---|---|---|---|---|---|---|---|---|
| 1421 Sunkiss Dr Fort Worth, TX | 3.0 | 2.0 | 1604 | $1,995 | $1.24 | 2d | 1 | 0.03mi |
| 1417 Palamedes Dr Fort Worth, TX | 4.0 | 2.5 | 2153 | $2,295 | $1.07 | 7d | 1 | 0.03mi |
| 1401 Sunkiss Dr Fort Worth, TX | 3.0 | 2.0 | 1600 | $2,095 | $1.31 | 12d | 1 | 0.06mi |
| 1456 Palamedes Dr Fort Worth, TX | 3.0 | 2.0 | 1316 | $2,000 | $1.52 | 4d | 1 | 0.07mi |
| 9632 Sierra Grande Dr Fort Worth, TX | 3.0 | 2.0 | 1600 | $1,895 | $1.18 | 43d | 1 | 0.09mi |
| 9637 Sierra Grande Dr Fort Worth, TX | 4.0 | 2.5 | 2131 | $2,155 | $1.01 | 22d | 1 | 0.09mi |
| 1317 Woodwinds Dr Fort Worth, TX | 4.0 | 2.5 | 2131 | $2,400 | $1.13 | 12d | 1 | 0.09mi |
| 1329 Woodwinds Dr Fort Worth, TX | 4.0 | 2.0 | 1803 | $2,320 | $1.29 | 5d | 1 | 0.12mi |
| 9609 Sierra Grande Dr Fort Worth, TX | 4.0 | 2.0 | 1754 | $2,175 | $1.24 | 7d | 1 | 0.15mi |
| 1417 Woodwinds Dr Fort Worth, TX | 4.0 | 2.5 | 2131 | $2,370 | $1.11 | 2d | 1 | 0.18mi |
| 1444 Harvester Dr Fort Worth, TX | 3.0–5.0 | 2.0–2.5 | 1840 | $2,080 | $1.13 | 1d | 1 | 0.22mi |
| 1505 Woodwinds Dr Fort Worth, TX | 4.0 | 2.0 | 1600 | $2,280 | $1.43 | 19d | 1 | 0.22mi |
| 1500 Four Seasons Ln Fort Worth, TX | 1.0–3.0 | 1.0–2.0 | 876 | $1,400 | $1.60 | 22d | 1 | 0.23mi |
| 1500 Harvester Dr Fort Worth, TX | 4.0 | 2.0 | 1600 | $2,280 | $1.43 | 4d | 1 | 0.23mi |
| 1513 Woodwinds Dr Fort Worth, TX | 4.0 | 2.5 | 2131 | $2,519 | $1.18 | 24d | 1 | 0.24mi |
| 1508 Harvester Dr Fort Worth, TX | 4.0 | 2.0 | 1724 | $2,328 | $1.35 | 7d | 1 | 0.25mi |
| 1313 Redpine Dr Fort Worth, TX | 3.0 | 2.0 | 1316 | $2,000 | $1.52 | 3d | 1 | 0.27mi |
| 1540 Woodwinds Dr Fort Worth, TX | 4.0 | 2.0 | 1600 | $2,280 | $1.43 | 5d | 1 | 0.27mi |
| 1524 Harvester Dr Fort Worth, TX | 4.0 | 2.5 | 2131 | $2,520 | $1.18 | 5d | 1 | 0.27mi |
| 1533 Woodwinds Dr Fort Worth, TX | 4.0 | 2.5 | 2131 | $2,519 | $1.18 | 43d | 1 | 0.27mi |
| 1300 Hazelnut Dr Fort Worth, TX | 3.0 | 2.0 | 1448 | $2,300 | $1.59 | 5d | 1 | 0.31mi |
| 1412 Royal Meadows Trl Fort Worth, TX | 3.0 | 2.0 | 1576 | $1,779 | $1.13 | 3d | 1 | 0.36mi |
| 9324 Cynthia Ct Fort Worth, TX | 4.0 | 2.0 | 1916 | $2,000 | $1.04 | 11d | 1 | 0.45mi |
| 9308 Cynthia Ct Fort Worth, TX | 3.0 | 2.0 | 1811 | $2,200 | $1.21 | 2d | 1 | 0.49mi |
| 1794 Farleigh Ct Fort Worth, TX | 3.0 | 2.5 | 1440 | $1,495 | $1.04 | 7d | 1 | 0.53mi |
| 10213 S Race St Fort Worth, TX | 4.0 | 2.0 | 1819 | $1,961 | $1.08 | 22d | 1 | 0.54mi |
| 1928 Alanbrooke Dr Fort Worth, TX | 4.0 | 2.0 | 1765 | $2,100 | $1.19 | 43d | 1 | 0.55mi |
| 1824 Alanbrooke Dr Fort Worth, TX | 3.0 | 2.0 | 1597 | $1,940 | $1.21 | 43d | 1 | 0.56mi |
| 1761 Belshire Ct Fort Worth, TX | 3.0 | 2.5 | 1440 | $1,495 | $1.04 | 43d | 1 | 0.59mi |
| 1766 Belshire Ct Fort Worth, TX | 3.0 | 2.5 | 1440 | $1,450 | $1.01 | 24d | 1 | 0.59mi |
| 1816 Christopher Dr Fort Worth, TX | 3.0 | 2.0 | 1655 | $1,905 | $1.15 | 24d | 1 | 0.61mi |
| 1905 Christopher Dr Fort Worth, TX | 4.0 | 2.0 | 2162 | $1,950 | $0.90 | 24d | 1 | 0.63mi |
| 9000 Christopher Cir Fort Worth, TX | 3.0 | 2.0 | 1270 | $1,745 | $1.37 | 15d | 1 | 0.69mi |
| 1432 Silver Oak Ln Fort Worth, TX | 4.0 | 3.0 | 1550 | $2,143 | $1.38 | 24d | 1 | 0.75mi |
| 9053 S Race St Unit 9086 Fort Worth, TX | 3.0 | 2.0 | 1185 | $1,464 | $1.24 | 43d | 1 | 0.75mi |
| 9053 S Race St Unit 9110 Fort Worth, TX | 2.0 | 2.0 | 1072 | $1,194 | $1.11 | 3d | 1 | 0.75mi |
| 9053 S Race St Unit 9086 Fort Worth, TX | 3.0 | 2.0 | 1185 | $1,570 | $1.32 | 12d | 1 | 0.75mi |
| 9053 S Race St Unit 3121 Fort Worth, TX | 3.0 | 2.0 | 1185 | $809 | $0.68 | 12d | 1 | 0.75mi |
| 9053 S Race St Unit 9086 Fort Worth, TX | 3.0 | 2.0 | 1185 | $1,421 | $1.20 | 3d | 1 | 0.75mi |
| 9053 S Race St Unit 9080 Fort Worth, TX | 2.0 | 2.0 | 1072 | $1,272 | $1.19 | 43d | 1 | 0.75mi |
HOA detail
- Monthly dues
- $36 · $432/yr
Listing history 18 events
-
2026-06-18price $259,900 Active 127 DOM
-
2026-06-18days on market $264,900 Active 127 DOM
-
2026-06-17days on market $264,900 Active 126 DOM
-
2026-06-16days on market $264,900 Active 125 DOM
-
2026-06-15days on market $264,900 Active 124 DOM
-
2026-06-13days on market $264,900 Active 122 DOM
-
2026-06-09days on market $264,900 Active 118 DOM
-
2026-06-08days on market $264,900 Active 117 DOM
-
2026-06-07days on market $264,900 Active 116 DOM
-
2026-06-04days on market $264,900 Active 113 DOM
-
2026-06-03days on market $264,900 Active 112 DOM
-
2026-06-02days on market $264,900 Active 111 DOM
-
2026-06-01days on market $264,900 Active 110 DOM
-
2026-05-31days on market $264,900 Active 109 DOM
-
2026-05-01price $269,900 524-char remark
Show marketing remark (524 chars)
This 3-bedroom, 2-bathroom home, built in 2022, offers the sleek efficiency and pristine condition of nearly new construction. The interior features a modern, open-concept layout with contemporary finishes and updated systems throughout, ensuring a completely move-in-ready experience with no updates or repairs required. With its generous bedroom count and clean architectural lines, this residence provides a fresh, turn-key foundation for a buyer seeking a low-maintenance lifestyle and the reliability of a recent build.
-
2026-04-08price $274,900 524-char remark
Show marketing remark (524 chars)
This 3-bedroom, 2-bathroom home, built in 2022, offers the sleek efficiency and pristine condition of nearly new construction. The interior features a modern, open-concept layout with contemporary finishes and updated systems throughout, ensuring a completely move-in-ready experience with no updates or repairs required. With its generous bedroom count and clean architectural lines, this residence provides a fresh, turn-key foundation for a buyer seeking a low-maintenance lifestyle and the reliability of a recent build.
-
2026-03-05price $279,900 524-char remark
Show marketing remark (524 chars)
This 3-bedroom, 2-bathroom home, built in 2022, offers the sleek efficiency and pristine condition of nearly new construction. The interior features a modern, open-concept layout with contemporary finishes and updated systems throughout, ensuring a completely move-in-ready experience with no updates or repairs required. With its generous bedroom count and clean architectural lines, this residence provides a fresh, turn-key foundation for a buyer seeking a low-maintenance lifestyle and the reliability of a recent build.
-
2026-02-11$289,900 Active 524-char remark
Show marketing remark (524 chars)
This 3-bedroom, 2-bathroom home, built in 2022, offers the sleek efficiency and pristine condition of nearly new construction. The interior features a modern, open-concept layout with contemporary finishes and updated systems throughout, ensuring a completely move-in-ready experience with no updates or repairs required. With its generous bedroom count and clean architectural lines, this residence provides a fresh, turn-key foundation for a buyer seeking a low-maintenance lifestyle and the reliability of a recent build.
ⓘ Source: listings_history table (triggers on properties + properties_extension) + one-shot
backfill from property_details.listing_events for pre-trigger history.
Tax reassessment forecast TX · Resets to sale price
- Current annual tax
- $5,594 · $466/mo
- Projected year-2 tax
- $5,594 · $466/mo
- Expected delta
- $0/yr ($0/mo · 0.0%)
ⓘ Screening estimate from a state-policy table — verify with the county assessor before closing.
Climate risk First Street
- Flood 1/10 Low FEMA zone X (unshaded) · 0% chance over 30 yrs
- Wildfire 3/10 Moderate
- Heat 8/10 Severe 7 d/yr ≥110°F today · 26 d/yr by 30 yrs out
- Wind 6/10 Major 27% chance of damaging wind over 30 yrs
- Air quality 3/10 Moderate 2 unhealthy d/yr today · 3 by 30 yrs out
Nearby sold comps map
Loading sold comps map…
Walkable amenities ~0.75 mi
Loading nearby amenities…
Taxation est. · year 1
- Rental income
- $25,640
- − Mortgage interest
- −$14,558
- − Property taxes
- −$5,594
- − Insurance
- −$1,300
- − Repairs & maintenance
- −$2,051
- − Management
- −$2,051
- − HOA
- −$432
- − Depreciation
- −$7,561
- Taxable loss
- −$7,907
- Est. tax savings @ 24.0%
- +$1,898
- After-tax cash flow
- $-1,528/yr
For passive investors: Depreciation is non-cash, so a rental often shows a tax loss while cash-flowing — sheltering income. Rental losses are passive: they offset passive income freely, and up to $25,000/yr can offset ordinary (W-2) income if you actively participate and your MAGI is under $100k (phasing out to $0 by $150k); unused losses carry forward. On sale, claimed depreciation is recaptured at up to 25%, and gains may owe capital-gains tax (a 1031 exchange can defer both). Figures are a year-1 estimate at your 24.0% rate — not tax advice; consult a CPA.
Schools (NCES district)
- District
- Everman ISD
- NCES district ID
- 4818810
- Math proficiency
- 21% ▼ -18.00%
- Reading proficiency
- 32% ▼ -4.00%
- Median HH income
- $44,803
- Composite
- 22.77/100
- National rank
- #8027
- State rank
- #691 of 826 in TX
Livability — Fort Worth
- Score
- 80/100
- State rank
- #49
- US rank
- #1954
Category grades
Schools grade is shown separately in the Schools card above.
Census & demographics
- Census place
- Fort Worth, TX
- County
- Tarrant County · 2,033,669 people
- City population
- 911,619
- Metro
- Dallas-Fort Worth-Arlington, TX
- Population (ZIP)
- 33,321
- Household income
- $75,955
- Rent vs Own
- Severe rent burden
- 1264.0
Population outlook (Tarrant County) Hauer SSP2
- Today (2025)
- 2,380,417 people
- By 2030
- 2,578,900 · +8.3%
- By 2040
- 2,974,995 · +25.0%
- By 2050
- 3,350,489 · +40.8%
- By 2075
- 4,216,909 · +77.2%
- By 2100
- 4,741,527 · +99.2%
Race, ethnicity, and origin ACS 2023
- Neighborhood character
- Diverse neighborhood (Simpson 0.68)
- Race & ethnicity
- Hispanic / Latino 39% Black 35% White 20% Two or more races 14% Asian 3%
- Hispanic origin (detail)
- Mexican 36%
- Common ancestry
- Scotch-Irish 2% Lithuanian 1% Slovak 1%
- Foreign-born
- 18% · Canada, Vietnam, China
- Languages at home
- 64% English-only · Spanish 32% Vietnamese 2% Chinese 1%
Political lean MEDSL · Tarrant
- 2024 margin
- Lean R (+5.1) · D 46.7% · R 51.9% · Other 1.4%
- 2008→2024 swing
- +6.6pp toward D · 2008: -11.7pp · 2024: -5.1pp
- All cycles
- 2024: R+5.1 2020: D+0.2 2016: R+8.7 2012: R+15.7 2008: R+11.7
Not yet ingested
- Civics
- —
Market trends
- HPI YoY
- ▼ -79.54%
- Current HPI
- 285.9894
- Rent YoY
- ▲ 0.11%
- Metro
- Dallas-Fort Worth-Arlington, TX
- State GDP YoY
- ▲ 3.95%
- F500 in state
- 110
Industry mix (Fortune 500 HQ in TX)
| Industry | F500 HQs | Revenue |
|---|---|---|
| Energy | 16 | $1,198B |
|
||
| Technology | 5 | $198B |
|
||
| Engineering / Construction | 4 | $72B |
|
||
| Energy Services | 3 | $60B |
|
||
| Utilities | 3 | $41B |
|
||
| Healthcare | 2 | $330B |
|
||
Price history
-6.9% since first listed4 events — show timeline
- 2026-05-01 Price Changed $269,900 NTREIS
- 2026-04-08 Price Changed $274,900 NTREIS
- 2026-03-05 Price Changed $279,900 NTREIS
- 2026-02-11 Listed $289,900 NTREIS
Property tax history
+79.7%/yrLatest (2025): $5,594 · -15.1% YoY. Source: county tax records.
Cash-flow waterfall
monthlySold comps — $/sqft
last 12 mo · ≤1 miLoading sold comps…