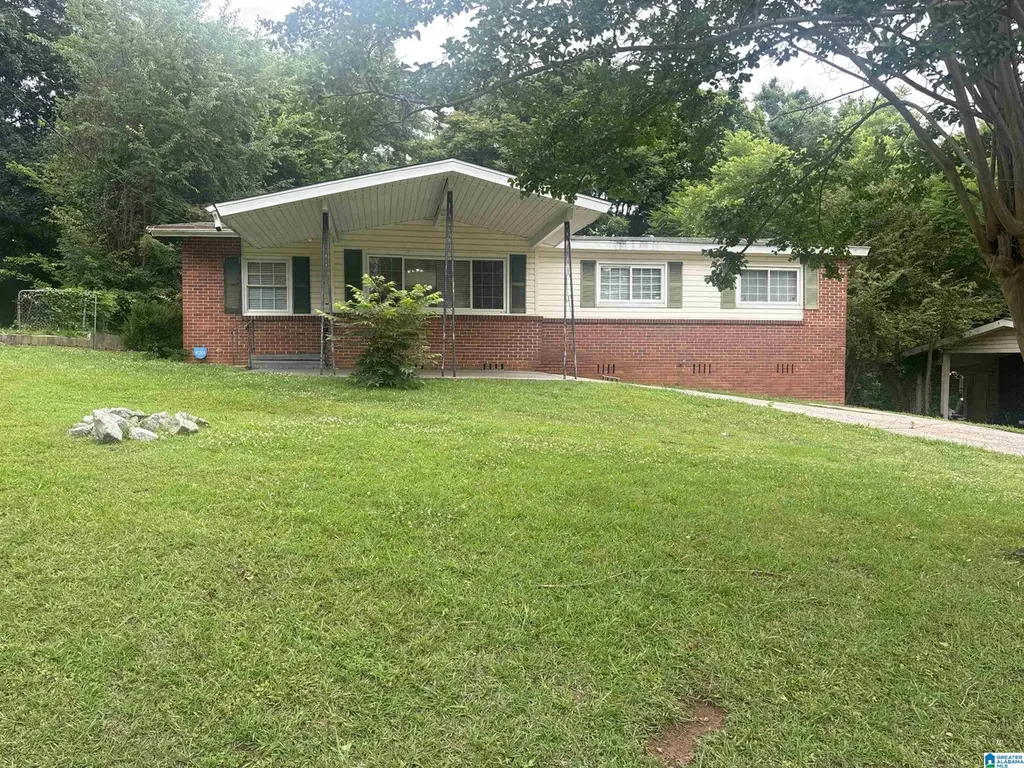
204 E Haven Dr · Birmingham, AL
Flood risk 1/10 · Minimal
- FEMA flood zone
- X (unshaded)
- Chance of flooding over 30 yrs
- 0.0%
- Est. flood insurance / yr
- $507 – $1,088
Fire risk 4/10 · Minor
- Est. fire insurance / yr
- $916 – $1,700
Heat risk 6/10 · Moderate
- Hot days now (above 105°F)
- 7 days/yr
- Hot days in 30 yrs
- 19 days/yr
Wind risk 6/10 · Moderate
- Chance of severe wind over 30 yrs
- 27.0%
Air-quality risk 5/10 · Moderate
- Unhealthy air days now
- 7 days/yr
- Unhealthy air days in 30 yrs
- 9 days/yr
Risk factors via First Street. Map © Google.
Why this score? — see what drove the C+ grade
The composite is a weighted blend of 9 inputs, each scored 0–100. Each bar is that input's sub-score; the figure is the points it added to the 100-point composite (weight × sub-score).
- Cash flow +24.1/30.0
- ARV discount +14.1/15.0
- DSCR +7.8/10.0
- 1% rule +6.2/10.0
- Livability +3.4/5.0
- Rent growth +3.3/5.0
- Condition / age +2.5/5.0
- Schools +0.9/10.0
- Appreciation +0.0/10.0
$114,900
🖨 Deal sheet 📄 Offer letter ✓ Due diligence
Listing remarks MLS
Property is tenant occupied. DO NOT DISTURB. Managed by Barrington Real Estate. Tenant pays $900 per month. Owner has multiple other rentals for sell.
Key facts
- Hardwood flooring
- Versatile den
- Functional layout
Tags
Property features AI
Finance
- Other: Property in the EAST HAVEN minor subdivision; Lot size approximately 0.24 acres
- HOA & community: No association fee
Exterior
- Parking: Attached parking; Driveway parking; One carport space
- Utilities: Public water; Electric water heater; Internet service availability unknown
- Home design: Existing single-family residence; 4-sided brick construction; Crawl space foundation
- Construction: 4-sided brick exterior; Crawl space foundation; Year built listed as existing
- Exterior features: Front porch; No patio, deck, pool, or garden listed; Not waterfront
Interior
- Kitchen: Laminate countertops; Gas oven; Refrigerator
- Bedrooms: Master bedroom on main level; Two additional bedrooms on main level
- Flooring: Hardwood
- Bathrooms: One full bath; One half bath; Tub/shower combo
- Heating & cooling: Central heating; Central cooling
- Interior features: Hardwood floors; Pull-down attic; Ceilings noted as 'Other (See Remarks)'; No additional interior features listed
- Laundry & utility: Main-level laundry room; Washer hookup; Electric dryer hookup
Neighborhood map
What this means for you Summary
Snapshot
- This is a 3-bed/1.5-bath single-family listed at $115k.
Deal economics
- At list price, monthly cash flow is $226 ($3k/yr) — positive.
- The deal already cash-flows at list — no discount required.
- Meets the 1% rule at list price ($1k rent vs $115k).
- Cap rate 8.7% vs local median 6.2% in Birmingham — top-decile yield for the area; either an underpriced asset or a hidden risk that comps aren't pricing in. Stress-test before assuming the spread holds.
Location & tenants
- Location reads 67/100 on livability (#78 in AL) — a middle-class / working-renter tenant base. Strengths: commute A+, cost of living A+, housing A+; Watch: amenities C-, crime F, employment F.
- Birmingham City (urban): math 4% / reading 20% proficiency, ranked #116 of 129 in AL (top 90%) — low school quality limits family demand, transient renter base, plan for 1-2y turnover; 82% free/reduced lunch — lower-income household profile, screen leases tightly.
- Zoned schools: Huffman Academy (math 0% / reading 17%, grade F, #594 of 627 statewide, top 95%, 735 students, 79% FRL); Huffman High Schoolmagnet (math 2% / reading 2%, grade F, #291 of 305 statewide, top 100%, 1,147 students, 72% FRL).
- Market conditions: Rents rising (+3.0%/yr); 334 active listings in the ZIP; 40 comparable units currently listed for rent nearby; rentals at typical pace (median 24d on market — plan ~3-4 weeks tenant-placement turnaround); 2,114 units permitted in Jefferson County in 2024 (556 in 5+ unit buildings).
Forward outlook
- Local home prices are declining (-3.0%/yr); year-one equity from $794 of loan paydown is wiped out by about $3k of value loss. Plan a longer hold.
- Jefferson County population projected to shrink 4% by 2050 — rents likely to lag national; underwrite the cash flow, not the appreciation.
Negotiation context
- Only 14 days on market — expect competitive offers; lowballing is unlikely to land.
- 3 sale attempts since 14y ago with the ask held roughly flat each time — persistent listings suggest the price (not the market) is what's stuck; bring a comps-based counter.
Risks & watch-outs
- Watch-outs: built in 1958 — expect roof / HVAC / electrical / plumbing capex.
- Climate carrying-cost: major wind risk, 27% chance of damaging wind over 30y; extreme-heat days projected 7→19/yr by 2055 (HVAC capex compounding) — expect insurance premiums to compound above CPI over the hold.
Questions for the listing agent
- Built in 1958 — when were the roof, HVAC, electrical panel, plumbing, and water heater last replaced?
- Is there a deadline driving the sale (1031 exchange, divorce, estate, relocation)? That informs how much negotiation room exists.
- Schools are F-rated, which usually means shorter tenancies and higher turnover. Who's the typical renter profile here, and what's been the actual vacancy rate?
- Crime grade is F in this area — have there been break-ins, vandalism, or insurance claims at this property in the last 3 years? What carrier currently insures it and at what premium?
- What's the average days-on-market for RENTAL listings here right now (not sales)? A rising rental-DOM trend means longer vacancies and softer asking-rent achievability than the comps imply.
- What's the recent tenant-quality profile in this submarket — average credit score on applications, eviction rate, late-payment / NSF rate, and stable-employment percentage? A property-management company in the area should have these aggregated.
- How much new for-sale + rental construction is in the pipeline within 1–3 miles? Heavy new supply typically softens prices + rents 12–24 months out; constrained supply supports both.
Investment metrics
- 1% rule
- 1.12% ✓
- Cap rate
- 8.65%
- Cash-on-cash
- 8.43%
- DSCR
- 1.38
- GRM
- 7.4
CMA / ARV
- ARV (on-the-fly)
- $134,757
- Comps found
- 12
Show comp detail 12 sales within ~0.75 mi
| Address | Dist | Beds/Ba | Sqft | Sold | Price | $/sf | Match |
|---|---|---|---|---|---|---|---|
| 1341 Hatfield Ln | 0.07mi | 3/1.5 | 1,318 (-9%) | 6mo | $100,500 | $76 | 76 |
| 1705 Lake Park Cir | 0.13mi | 2/2.0 (-1) | 1,339 (-8%) | 1mo | $125,000 | $93 | 74 |
| 1105 Rainbow Dr NE | 0.53mi | 3/2.0 | 1,392 (-4%) | 1mo | $107,500 | $77 | 66 |
| 852 Twin Lake Dr NE | 0.41mi | 3/1.5 | 1,364 (-6%) | 7mo | $115,000 | $84 | 65 |
| 1632 Bobolink Ln NE | 0.35mi | 3/2.0 | 1,327 (-8%) | 9mo | $130,000 | $98 | 60 |
| 432 Argonne Dr NE | 0.40mi | 3/2.0 | 1,566 (+8%) | 8mo | $101,700 | $65 | 59 |
| 1517 NW 3rd St | 0.55mi | 3/2.0 | 1,377 (-5%) | 8mo | $86,000 | $62 | 58 |
| 504 Lakeside Cir | 0.52mi | 2/2.0 (-1) | 1,555 (+7%) | 2mo | $210,000 | $135 | 55 |
| 550 Lakeside Cir | 0.55mi | 2/2.0 (-1) | 1,526 (+5%) | 7mo | $209,900 | $138 | 53 |
| 1409 4th Pl NW | 0.73mi | 3/2.0 | 1,363 (-6%) | 2mo | $192,000 | $141 | 52 |
| 1637 1st St NE | 0.46mi | 3/1.0 | 1,296 (-11%) | 9mo | $115,300 | $89 | 51 |
| 222 Polly Reed Rd | 0.67mi | 3/2.0 | 1,662 (+15%) | 8mo | $179,000 | $108 | 35 |
Match score weights: distance 35% · size 25% · config 20% · recency 20%. Top-matched comps best support the ARV.
Projected returns pro-forma
-3.0% appreciation · 3.04% rent growth · sell at horizon
- IRR
- -3.4%
- Equity multiple
- 0.87×
- Total profit
- $-4,147
- Equity at exit
- $17,132
- IRR
- 6.3%
- Equity multiple
- 1.47×
- Total profit
- $15,219
- Equity at exit
- $9,934
Cash invested: $32,172 (down + closing). Projections, not guarantees.
Landlord ↔ Tenant lean methodology
- Overall (STATE)
- 90 Strongly Landlord-Friendly
- State Alabama
- 90 Strongly Landlord-Friendly · R+15
- County
- — inherits STATE
- City
- — inherits STATE
ZIP-level market 35215
- Home prices YoY
- -34.4%
- Rents YoY
- 3.0%
- Active inventory
- 334
- Price-to-rent
- 7.4×
Monthly cashflow live
- Estimated rent
- $1,288 high interval (Pro) →
- Mortgage (P&I)
- −$603
- Tax from tax record
- −$141 /mo · $1,689/yr
- Insurance
- −$48
- HOA
- −$0
- Vacancy / Maint / Mgmt
- −$270
- Net cashflow
- $226
Break-even live
UW: 25.0% down · 7.5% · 30yr · 1.5% tax · 5.0% vac · 8.0% maint · 8.0% mgmt
Financing live
Cash to close
- Down payment
- $28,725
- Closing costs
- $3,447
- Reserves months
- —
- Total cash needed
- —
Loan-product check · same deal, 3 products live
Conventional
25% down · 7.5% · 30yr
- Down + closing
- —
- Monthly P&I
- —
- Monthly cashflow
- —
- DSCR
- —
- Eligible?
- —
Personal DTI + credit; lowest rate.
DSCR
20% down · 8.5% · 30yr
- Down + closing
- —
- Monthly P&I
- —
- Monthly cashflow
- —
- DSCR
- —
- Eligible?
- —
No personal income docs; deal must DSCR.
Hard money
10% down · 12.0% · 12mo
- Down + closing
- —
- Monthly P&I
- —
- Monthly cashflow
- —
- DSCR
- —
- Eligible?
- —
Short-term bridge; refi at stabilization.
Rent comps 40 comps
| Address | Beds | Baths | Sqft | Rent | $/sqft | DOM | Units | Dist |
|---|---|---|---|---|---|---|---|---|
| 239 Lake Drive Cir NE Birmingham, AL | 3.0 | 1.0 | 1159 | $1,125 | $0.97 | 3d | 1 | 0.16mi |
| 1541 Charter East Cir NE Birmingham, AL | 1.0–2.0 | 1.0–1.5 | 807 | $1,095 | $1.36 | 2d | 8 | 0.17mi |
| 241 Lake Drive Cir NE Birmingham, AL | 2.0 | 1.0 | 1358 | $1,025 | $0.75 | 2d | 1 | 0.18mi |
| 224 13th Ave NE Birmingham, AL | 3.0 | 1.5 | 1213 | $1,273 | $1.05 | 21d | 1 | 0.24mi |
| 213 Meadwood Dr NE Center Point, AL | 3.0 | 1.0 | 1194 | $995 | $0.83 | 44d | 1 | 0.28mi |
| 341 Argonne Dr NE Center Point, AL | 3.0 | 1.0 | 1040 | $1,300 | $1.25 | 3d | 1 | 0.39mi |
| 1628 1st St NE Center Point, AL | 3.0 | 1.0 | 1027 | $1,165 | $1.13 | 44d | 1 | 0.40mi |
| 1259 Huffman Rd Center Point, AL | 3.0 | 2.0 | 1662 | $1,556 | $0.94 | 44d | 1 | 0.52mi |
| 1629 1st St NW Center Point, AL | 3.0 | 1.0 | 900 | $1,025 | $1.14 | 24d | 1 | 0.53mi |
| 1340 Orlando Cir NE Birmingham, AL | 3.0 | 2.0 | 1329 | $1,166 | $0.88 | 24d | 1 | 0.53mi |
| 1628 1st St NW Center Point, AL | 3.0 | 1.0 | 1124 | $1,150 | $1.02 | 44d | 1 | 0.55mi |
| 108 13th Ave NW Center Point, AL | 4.0 | 2.0 | 1444 | $1,265 | $0.88 | 24d | 1 | 0.56mi |
| 1720 2nd St NE Center Point, AL | 3.0 | 2.0 | 1100 | $1,400 | $1.27 | 44d | 1 | 0.58mi |
| 1360 Orlando Cir NE Birmingham, AL | 3.0 | 2.0 | 1489 | $1,455 | $0.98 | 24d | 1 | 0.60mi |
| 324 13th Ter NW Center Point, AL | 3.0 | 1.5 | 1418 | $1,295 | $0.91 | 24d | 1 | 0.67mi |
| 1617 3rd Pl NW Center Point, AL | 3.0 | 2.0 | 1404 | $1,150 | $0.82 | 24d | 1 | 0.68mi |
| 405 13th Ct NW Center Point, AL | 4.0 | 1.5 | 1248 | $1,415 | $1.13 | 21d | 1 | 0.71mi |
| 1700 Serene Dr Birmingham, AL | 4.0 | 1.5 | 1543 | $1,630 | $1.06 | 2d | 1 | 0.71mi |
| 1237 Linwood St Birmingham, AL | 3.0 | 1.5 | 1066 | $995 | $0.93 | 44d | 1 | 0.72mi |
| 428 15th Ter NW Center Point, AL | 3.0 | 2.0 | 1528 | $1,795 | $1.17 | 3d | 1 | 0.74mi |
| 434 15th Ter NW Center Point, AL | 3.0 | 2.0 | 1053 | $1,200 | $1.14 | 44d | 1 | 0.77mi |
| 1153 Linwood St Birmingham, AL | 3.0 | 2.0 | 1250 | $1,295 | $1.04 | 3d | 1 | 0.79mi |
| 1225 Birchwood St Birmingham, AL | 3.0 | 2.0 | 1092 | $1,175 | $1.08 | 3d | 1 | 0.79mi |
| 120 Shawnee Ln NW Birmingham, AL | 3.0 | 1.0 | 1120 | $1,075 | $0.96 | 44d | 1 | 0.81mi |
| 1232 Oakwood St Birmingham, AL | 3.0 | 1.5 | 1301 | $1,223 | $0.94 | 24d | 1 | 0.86mi |
| 113 19th Ave NW Center Point, AL | 3.0 | 2.0 | 1407 | $1,250 | $0.89 | 11d | 1 | 0.88mi |
| 405 18th Ave NW Center Point, AL | 3.0 | 2.0 | 1162 | $1,299 | $1.12 | 44d | 1 | 0.89mi |
| 305 18th Ct NW Center Point, AL | 3.0 | 1.5 | 1270 | $1,100 | $0.87 | 44d | 1 | 0.89mi |
| 400 13th Ave NW Birmingham, AL | 2.0 | 1.0 | 1100 | $890 | $0.81 | 44d | 1 | 0.90mi |
| 1333 5th Pl NW Center Point, AL | 3.0 | 2.0 | 1056 | $1,275 | $1.21 | 44d | 1 | 0.90mi |
| 1356 5th Pl NW Center Point, AL | 3.0 | 1.0 | 1064 | $1,105 | $1.04 | 44d | 1 | 0.92mi |
| 1305 5th Pl NW Center Point, AL | 3.0 | 2.0 | 1092 | $1,200 | $1.10 | 44d | 1 | 0.93mi |
| 1700 4th Pl NW Center Point, AL | 3.0 | 1.0 | 914 | $1,075 | $1.18 | 24d | 1 | 0.93mi |
| 500 15th Ave NW Center Point, AL | 3.0 | 1.0 | 1079 | $1,050 | $0.97 | 3d | 1 | 0.93mi |
| 1301 5th Pl NW Center Point, AL | 3.0 | 1.0 | 1170 | $1,100 | $0.94 | 3d | 1 | 0.93mi |
| 744 Vaughn Cir Birmingham, AL | 4.0 | 2.0 | 1516 | $1,561 | $1.03 | 24d | 1 | 0.94mi |
| 1328 5th Pl NW Center Point, AL | 3.0 | 1.0 | 1250 | $1,050 | $0.84 | 16d | 1 | 0.94mi |
| 1712 4th Pl NW Center Point, AL | 3.0 | 1.0 | 1182 | $1,150 | $0.97 | 24d | 1 | 0.94mi |
| 901 Eldorado Dr Birmingham, AL | 4.0 | 2.0 | 1680 | $1,415 | $0.84 | 15d | 1 | 0.94mi |
| 1905 2nd St NW Center Point, AL | 3.0 | 1.0 | 1258 | $1,395 | $1.11 | 44d | 1 | 0.95mi |
Listing history 21 events
-
2026-06-13statusdays on market $114,900 Pending 14 DOM
-
2026-06-10days on market $114,900 Active 13 DOM
-
2026-06-09days on market $114,900 Active 12 DOM
-
2026-06-08days on market $114,900 Active 11 DOM
-
2026-06-07days on market $114,900 Active 10 DOM
-
2026-06-03days on market $114,900 Active 6 DOM
-
2026-06-02days on market $114,900 Active 5 DOM
-
2026-06-01days on market $114,900 Active 4 DOM
-
2026-05-31days on market $114,900 Active 3 DOM
-
2026-05-28$114,900 Active
-
2022-07-25soldstatus $107,900 Sold 150-char remark
Show marketing remark (150 chars)
Property is tenant occupied. DO NOT DISTURB. Managed by Barrington Real Estate. Tenant pays $900 per month. Owner has multiple other rentals for sell.
-
2022-07-25soldstatus $319,400
Show marketing remark (150 chars)
Property is tenant occupied. DO NOT DISTURB. Managed by Barrington Real Estate. Tenant pays $900 per month. Owner has multiple other rentals for sell.
-
2022-06-16status Pending 150-char remark
Show marketing remark (150 chars)
Property is tenant occupied. DO NOT DISTURB. Managed by Barrington Real Estate. Tenant pays $900 per month. Owner has multiple other rentals for sell.
-
2022-05-31$117,750 Active 150-char remark
Show marketing remark (150 chars)
Property is tenant occupied. DO NOT DISTURB. Managed by Barrington Real Estate. Tenant pays $900 per month. Owner has multiple other rentals for sell.
-
2018-12-13soldstatus $197,000
-
2012-07-12soldstatus $30,000 327-char remark
Show marketing remark (327 chars)
TAKE ANOTHER LOOK AT THIS 3BR, 1.5BA, SPACIOUS KITCHEN AND BEDROOMS, FORMAL LIVING AND DINING ROOM, SEPERATE LAUNDRY ROOM. PERFECT HOME FOR A FIRST TIME BUYER, THIS ONE WILL NOT LAST LONG. PURCHASE PROPERTY FOR AS LITTLE AS 3% DOWN THIS IS A FANNIE MAE HOMEPATH PROPERTY AND APPROVED FOR HOMEPATH RENOVATION MORTGAGE FINANCING.
-
2012-06-06$32,000 327-char remark
Show marketing remark (327 chars)
TAKE ANOTHER LOOK AT THIS 3BR, 1.5BA, SPACIOUS KITCHEN AND BEDROOMS, FORMAL LIVING AND DINING ROOM, SEPERATE LAUNDRY ROOM. PERFECT HOME FOR A FIRST TIME BUYER, THIS ONE WILL NOT LAST LONG. PURCHASE PROPERTY FOR AS LITTLE AS 3% DOWN THIS IS A FANNIE MAE HOMEPATH PROPERTY AND APPROVED FOR HOMEPATH RENOVATION MORTGAGE FINANCING.
-
2012-05-31soldstatus $92,149
-
2006-08-24soldstatus $96,000
-
1982-09-25soldstatus $43,053
-
1978-08-01soldstatus $35,000
ⓘ Source: listings_history table (triggers on properties + properties_extension) + one-shot
backfill from property_details.listing_events for pre-trigger history.
Tax reassessment forecast AL · Resets to sale price
- Current annual tax
- $1,689 · $141/mo
- Projected year-2 tax
- $1,689 · $141/mo
- Expected delta
- $0/yr ($0/mo · 0.0%)
ⓘ Screening estimate from a state-policy table — verify with the county assessor before closing.
Climate risk First Street
- Flood 1/10 Low FEMA zone X (unshaded) · 0% chance over 30 yrs
- Wildfire 4/10 Moderate
- Heat 6/10 Major 7 d/yr ≥105°F today · 19 d/yr by 30 yrs out
- Wind 6/10 Major 27% chance of damaging wind over 30 yrs
- Air quality 5/10 Major 7 unhealthy d/yr today · 9 by 30 yrs out
Nearby sold comps map
Loading sold comps map…
Walkable amenities ~0.75 mi
Loading nearby amenities…
Taxation est. · year 1
- Rental income
- $15,453
- − Mortgage interest
- −$6,436
- − Property taxes
- −$1,689
- − Insurance
- −$574
- − Repairs & maintenance
- −$1,236
- − Management
- −$1,236
- − Depreciation
- −$3,343
- Taxable income
- $938
- Est. tax owed @ 24.0%
- −$225
- After-tax cash flow
- $2,488/yr
For passive investors: Depreciation is non-cash, so a rental often shows a tax loss while cash-flowing — sheltering income. Rental losses are passive: they offset passive income freely, and up to $25,000/yr can offset ordinary (W-2) income if you actively participate and your MAGI is under $100k (phasing out to $0 by $150k); unused losses carry forward. On sale, claimed depreciation is recaptured at up to 25%, and gains may owe capital-gains tax (a 1031 exchange can defer both). Figures are a year-1 estimate at your 24.0% rate — not tax advice; consult a CPA.
Schools (NCES district)
- District
- Birmingham City
- NCES district ID
- 0100390
- Math proficiency
- 4% ▼ -17.00%
- Reading proficiency
- 20% ▼ -4.00%
- Median HH income
- $31,988
- Composite
- 9.49/100
- National rank
- #9850
- State rank
- #116 of 129 in AL
Livability — Birmingham
- Score
- 67/100
- State rank
- #78
- US rank
- #10412
Category grades
Schools grade is shown separately in the Schools card above.
Census & demographics
- Census place
- Birmingham, AL
- County
- Jefferson County · 527,445 people
- City population
- 210,422
- Metro
- Birmingham-Hoover, AL
- Population (ZIP)
- 43,903
- Household income
- $52,793
- Rent vs Own
- Severe rent burden
- 1729.0
Population outlook (Jefferson County) Hauer SSP2
- Today (2025)
- 669,185 people
- By 2030
- 669,694 · +0.1%
- By 2040
- 661,388 · -1.2%
- By 2050
- 643,086 · -3.9%
- By 2075
- 577,267 · -13.7%
- By 2100
- 474,758 · -29.1%
Race, ethnicity, and origin ACS 2023
- Neighborhood character
- Predominantly Black (75%)
- Race & ethnicity
- Black 75% White 15% Hispanic / Latino 7% Two or more races 3%
- Hispanic origin (detail)
- Mexican 4%
- Common ancestry
- Lithuanian 1% Italian 1% Slovak 1%
- Foreign-born
- 4% · Canada
- Languages at home
- 92% English-only · Spanish 7%
Political lean MEDSL · Jefferson
- 2024 margin
- D (+10.4) · D 54.6% · R 44.2% · Other 1.2%
- 2008→2024 swing
- +5.4pp toward D · 2008: 5.1pp · 2024: 10.4pp
- All cycles
- 2024: D+10.4 2020: D+13.2 2016: D+7.2 2012: D+6.0 2008: D+5.1
Not yet ingested
- Civics
- —
Market trends
- HPI YoY
- ▼ -112.97%
- Current HPI
- 215.0607
- Rent YoY
- ▲ 3.04%
- Metro
- Birmingham-Hoover, AL
- State GDP YoY
- ▲ 2.94%
- F500 in state
- 4
Industry mix (Fortune 500 HQ in AL)
| Industry | F500 HQs | Revenue |
|---|---|---|
| Financial Services | 1 | $8B |
|
||
| Healthcare | 1 | $5B |
|
||
Price history
+228.3% since first listed12 events — show timeline
- 2026-05-28 Listed $114,900 Greater Alabama MLS
- 2022-07-25 Sold (Public Records) $319,400 Public Records
- 2022-07-25 Sold (MLS) $107,900 Greater Alabama MLS
- 2022-06-16 Pending — Greater Alabama MLS
- 2022-05-31 Listed $117,750 Greater Alabama MLS
- 2018-12-13 Sold (Public Records) $197,000 Public Records
- 2012-07-12 Sold (MLS) $30,000 Greater Alabama MLS
- 2012-06-06 Listed $32,000 Greater Alabama MLS
- 2012-05-31 Sold (Public Records) $92,149 Public Records
- 2006-08-24 Sold (Public Records) $96,000 Public Records
- 1982-09-25 Sold (Public Records) $43,053 Public Records
- 1978-08-01 Sold (Public Records) $35,000 Public Records
Property tax history
+4.1%/yrLatest (2025): $1,689 · +0.0% YoY. Source: county tax records.
Cash-flow waterfall
monthlySold comps — $/sqft
last 12 mo · ≤1 miLoading sold comps…